. 2023 Jul 29;14(1):4576.
doi: 10.1038/s41467-023-39629-5.

Clade density and the evolution of diversity-dependent diversification

Affiliations

Clade density and the evolution of diversity-dependent diversification

Marcio R Pie et al. Nat Commun. .

Abstract

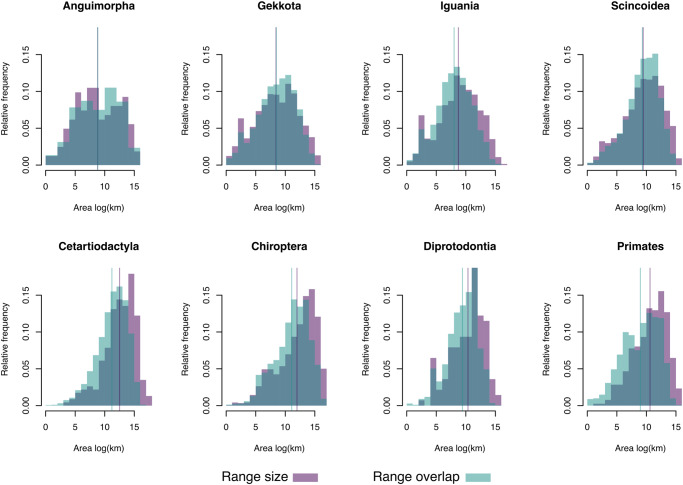
The assumption of an ecological limit to the number of species in a given region is frequently invoked in evolutionary studies, yet its empirical basis is remarkably meager. We explore this assumption by integrating data on geographical distributions and phylogenetic relationships of nearly six thousand terrestrial vertebrate species. In particular, we test whether sympatry with closely-related species leads to decreasing speciation rates. We introduce the concept of clade density, which is the sum of the areas of overlap between a given species and other members of its higher taxon, weighted by their phylogenetic distance. Our results showed that, regardless of the chosen taxon and uncertainty in the phylogenetic relationships between the studied species, there is no significant relationship between clade density and speciation rate. We argue that the mechanistic foundation of diversity-dependent diversification is fragile, and that a better understanding of the mechanisms driving regional species pools is sorely needed.


Conflict of interest statement

The authors declare no competing interests.

Figures

Fig. 1
Fig. 1. Steps involved in the calculation of clade density.
We begin with a set of five species, whose phylogenetic relationships and range sizes are provided in A and geographical distributions are shown in B. From the geographical distributions, it is possible to obtain a range overlap matrix, which measures the area of overlap between each pair of species (C). The phylogeny is then used to calculate the phylogenetic variance-covariance matrix (D), which is then multiplied to each element in the range overlap matrix by the phylogenetic variance-covariance (E, F). All elements in each line are then summed to obtain the estimates of clade density for each species (G).
Fig. 2
Fig. 2. Frequency distributions of range sizes and range overlap sizes for different terrestrial vertebrate groups.
Range overlap sizes were calculated for all pairs of species in each taxon. Vertical lines indicate the means of the corresponding log-transformed data. Source data are provided as a Source Data file.
Fig. 3
Fig. 3. Violin plots of clade densities across species in different terrestrial vertebrate groups.
Distributions are invariably asymmetric, with most species showing relatively low values of clade density. The number of species in each clade is as follows: Anguimorpha [N = 162], Gekkota [N = 1225], Iguania [N = 1395], Scincoidea [N = 1216], Cetartiodactyla [N = 230], Chiroptera [N = 1182], Diprotodontia [N = 139], and Primates [N = 387]. Data are presented as: Anguimorpha [min = 0; lower whisker=0; 25th percentile = 261.134; median = 778.52; 75th percentile = 2013.554; upper whisker = 4642.184; max = 17754.086], Gekkota [min = 0; lower whisker = 0; 25th percentile = 297.563; median = 954.457; 75th percentile = 2469.793; upper whisker = 5728.137; max = 37806.053], Iguania [min = 0; lower whisker = 0; 25th percentile = 1089.367; median = 3097.616; 75th percentile = 7538.88; upper whisker = 17213.15; max = 43206.41], Scincoidea [min = 0; lower whisker = 0; 25th percentile = 1239.11; median = 3777.291; 75th percentile = 14321.733; upper whisker = 33945.67; max = 129425.128], Cetartiodactyla [min = 0; lower whisker = 0; 25th percentile = 859.038; median = 2556.897; 75th percentile = 5330.742; upper whisker = 12038.3; max = 18265.094], Chiroptera [min = 0; lower whisker = 0; 25th percentile = 2148.482; median = 5211.879; 75th percentile = 10922.92; upper whisker = 24084.58; max = 43382.571], Diprotodontia [min = 0; lower whisker = 0; 25th percentile = 653.209; median = 1377.411; 75th percentile = 2197.731; upper whisker = 4514.512; max = 8386.167], and Primates [min = 0; lower whisker = 0; 25th percentile = 973.24; median = 2016.426; 75th percentile = 3676.591; upper whisker = 7731.617; max = 22711.306]. Source data are provided as a Source Data file.
Fig. 4
Fig. 4. Global distribution of 10% of the species with the highest clade density value in each analyzed clade.
More intense colors indicate a concentration of overlapping ranges. In the case of squamates (a), the analyzed clades include: Iguania (blue), Gekkota (red), Scincoidea (yellow), and Anguimorpha (green). For mammals (b), the analyzed clades consist of: Chiroptera (blue), Diprotodondia (red), Cetartiodactyla (yellow), and Primates (green). The silhouette images were available under Public Domain license at PhyloPic. Maps were generated in QGIS (version 3.22.3) using range maps obtained from IUCN.
Fig. 5
Fig. 5. Frequency distribution of the slopes of relationships between variation in clade density and speciation rate (λDR).
Distribution is based on different tested topologies in each taxon. Source data are provided as a Source Data file.

References

    1. Elton, C. S. The Ecology Of Animals (Wiley, 1950).
    1. Hutchinson GE. Homage to santa rosalia or why are there so many kinds of animals? Am. Nat. 1959;93:145–159. doi: 10.1086/282070. - DOI
    1. Hutchinson GE. The paradox of the plankton. Am. Nat. 1961;95:137–145. doi: 10.1086/282171. - DOI
    1. Macarthur RH. Patterns of species diversity. Biol. Rev. 1965;40:510–533. doi: 10.1111/j.1469-185X.1965.tb00815.x. - DOI
    1. MacArthur R, Levins R. The limiting similarity, convergence, and divergence of coexisting species. Am. Nat. 1967;101:377–385. doi: 10.1086/282505. - DOI

Publication types