. 2023 Jul 29;22(1):119.
doi: 10.1186/s12943-023-01809-8.

METTL1 promotes tumorigenesis through tRNA-derived fragment biogenesis in prostate cancer

Affiliations

METTL1 promotes tumorigenesis through tRNA-derived fragment biogenesis in prostate cancer

Raquel García-Vílchez et al. Mol Cancer. .

Abstract

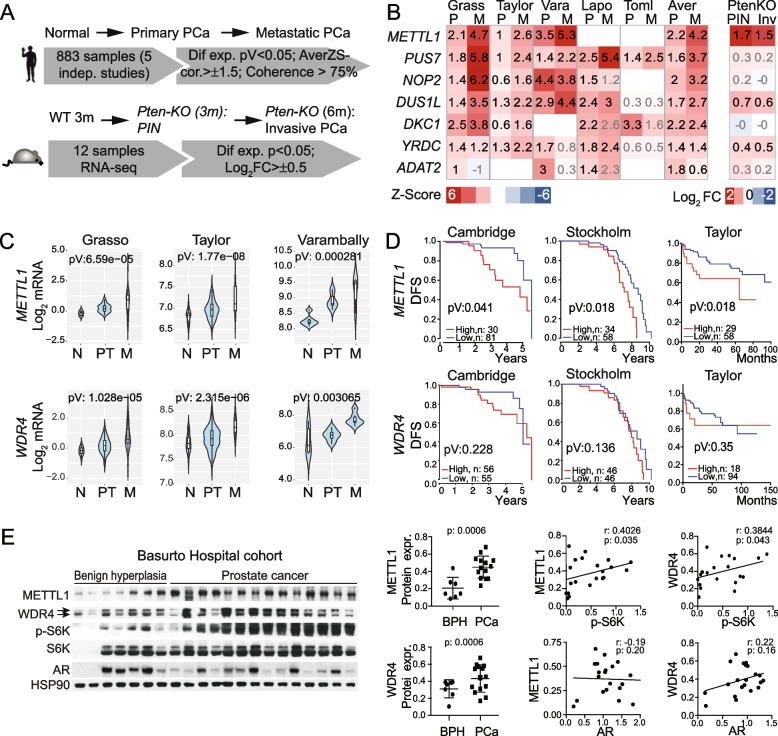
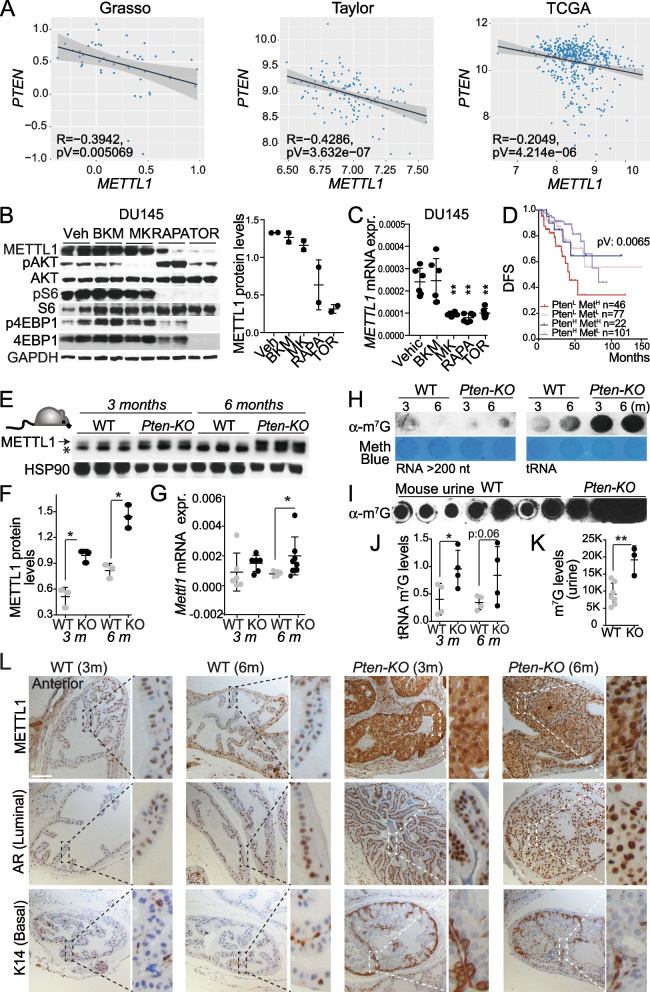
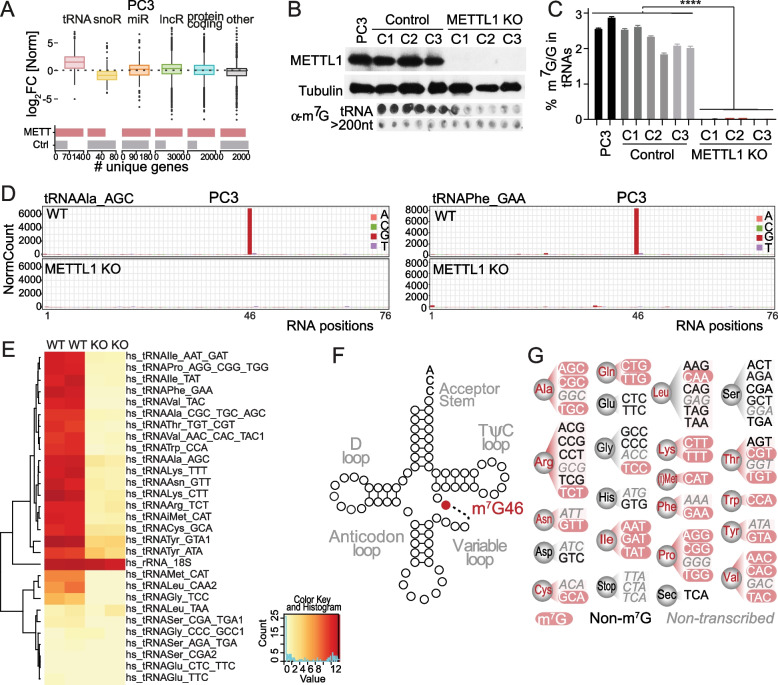
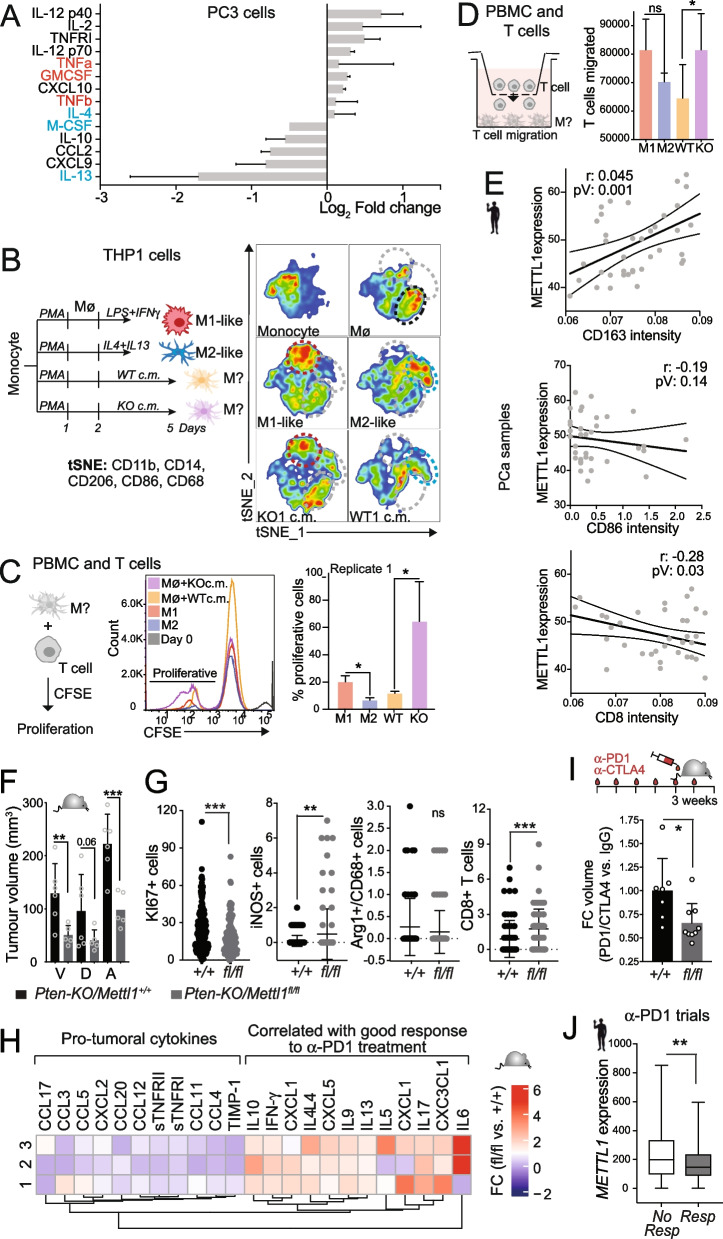
Newly growing evidence highlights the essential role that epitranscriptomic marks play in the development of many cancers; however, little is known about the role and implications of altered epitranscriptome deposition in prostate cancer. Here, we show that the transfer RNA N7-methylguanosine (m7G) transferase METTL1 is highly expressed in primary and advanced prostate tumours. Mechanistically, we find that METTL1 depletion causes the loss of m7G tRNA methylation and promotes the biogenesis of a novel class of small non-coding RNAs derived from 5'tRNA fragments. 5'tRNA-derived small RNAs steer translation control to favour the synthesis of key regulators of tumour growth suppression, interferon pathway, and immune effectors. Knockdown of Mettl1 in prostate cancer preclinical models increases intratumoural infiltration of pro-inflammatory immune cells and enhances responses to immunotherapy. Collectively, our findings reveal a therapeutically actionable role of METTL1-directed m7G tRNA methylation in cancer cell translation control and tumour biology.

Keywords: 7-methylguanosine; Epitranscriptome; Immune checkpoint blockade; Interferon; Prostate cancer; RNA modifications; Tumour microenvironment (TME); tRNA fragments.


Conflict of interest statement

The authors declare no competing interests.

Figures

Fig. 1
Fig. 1
METTL1 is upregulated in prostate cancer. A A schematic overview of the research workflow used to identify altered expression of RMPs associated with PCa. B Heatmap of average Z-scores of mRNA expression values in human primary (P) and metastatic (M) PCa samples compared to healthy tissue for significant differentially expressed RNA-modifying enzymes reveals METTL1 as the most overexpressed RMPs in PCa. Data from are from Grasso et al. [7] (n = N: 12, P: 49, M: 27); Taylor et al. [6] (n = N: 29, P: 131, M: 19); Varambally et al. [42] (n = N: 6, P: 7, M: 6); Lapointe et al. [44] (n = N: 9, P: 13, M: 4); Tomlins et al. [43] (n = N: 23, P: 32, M: 20) (left panel) datasets. Z-score averages for all datasets are also shown as “Aver”. Z-score values are indicated using numeric values. Grey Z-score values indicate no significant p-value. The right heatmap shows the average log2 fold change in mRNA expression values in Pten-cKO mice with prostate intraepithelial neoplasia (PIN) and invasive prostate carcinoma (Inv) compared to normal prostate tissue (right panel) (n = 4). C METTL1 and WDR4 expression are increased in primary (PT) and metastatic tumours (M) compared to normal tissues (N). Data are from Grasso et al. [7], Taylor et al. [6], and Varambally et al. [42] datasets. Log2-normalised gene expression values are shown. D High expression of METTL1 but not WDR4 is associated with poor patient prognosis. Kaplan–Meier curves representing biochemical recurrence-free survival (DFS) of patient groups selected according to gene expression, data from the Cambridge, Stockholm and Taylor cohorts [6, 46]. Data were retrieved from the camcAPP [48] and cBioportal. E Western blot from benign prostatic hyperplasia (BPH) (n = 7) and PCa patient samples (n = 14) (upper panel) and correlation analysis between METTL1 and WDR4 expression, AR and phospho-S6K (right panels). Statistical tests: ANOVA test (B, C), and log-rank Cox test (D). Data are represented as mean ± standard deviation (SD). Student’s t-test and Spearman’s correlation test (E)
Fig. 2
Fig. 2
PI3K-AKT-mTORC pathway mediate upregulation of METTL1 expression in PCa. A Correlation analysis between METTL1 and PTEN expression in human primary prostate tumours expression datasets. Plotted values correspond to the log2-normalised gene expression values for each patient in the indicated dataset. The black line represents linear regression, grey area indicates the limits of the confidence intervals. Pearson’s correlation coefficient (R) and p-values are indicated. Grasso n = 88; Taylor n = 183; TCGA n = 497. B, C METTL1 expression is regulated downstream of AKT signalling. Western blot (B) and RT-qPCR (C) analyses of METTL1 expression upon PI3K pathway inhibition in DU145 cells. DMSO as vehicle (Veh), BKM-120 (BKM) as pan-PI3K inhibitor, MK2206 (MK) as AKT inhibitor, rapamycin (RAPA) as mTORC1 inhibitor, and Torin (TOR) as mTORC1/2 inhibitor. For western blotting, cells were treated for 48 h, and for RT-qPCR, for 8 h. Means ± SD are shown (n = 2) (B) and (n = 6) (C). D Stratification of patients with a worse prognosis according to high METTL1 levels and low PTEN expression. Kaplan–Meier curves representing the disease-free survival (DFS) of patient groups selected according to Q1 (PtenL) and Q4 (PtenH) quartile expression of PTEN, and METTL1 high (MetH, log2-normalised expression > 8.72) and METTL1 low (MetL, log2-normalised expression < 8.72) in recurrent and disease-free (DF) tumour samples from the TCGA dataset. E–G Mettl1 is highly expressed in mouse prostate tumours. Mettl1 expression analysis in Pten-KO mice at 3 and 6 months of age compared to wild-type mice (WT) at the same ages by western blot (E, F) and RT-qPCR (G). * in (E) indicates an unspecific band. Means ± SD are shown for three (F) and five replicates (G). H, J Increased 7-guanine tRNA methylation in RNA from prostate tumours compared with that in normal prostate. North-dot blot of m7G levels in long RNAs (> 200 nucleotides long RNAs) and tRNAs extracted from prostatic tissue of Pten-KO mice with intraepithelial prostatic neoplasia (at 3 months of age) or invasive tumour (at 6 months), and wild-type (WT) mice of the same age. Methylene blue staining was used as the loading control (H, bottom panel). Means ± SD are represented (n = 4) (J). I, K Increased 7-guanine tRNA methylation in the urine of mice bearing PCa tumours. North-dot blot of m.7G levels from the urines of Pten-KO mice with invasive tumour (at 6 months), and wild-type (WT) mice of the same age. Means ± SD are shown (n > 3). L Representative images of immunostained sections for Mettl1 and markers for luminal (AR), and basal (K14) cells in Pten-KO prostates (anterior lobes) at initiation (3 m) and in invasive carcinoma (6 m) and in age-matched wild-type (WT) prostates. Scale bars represent 50 μm. Statistical tests: one-tailed Student’s t-test (C), log-rank test (D), Mann–Whitney test (F, G, J, K). *p < 0.05, **p < 0.01, ***p < 0.001
Fig. 3
Fig. 3
METTL1 preferentially methylates tRNAs. A tRNAs are the most common RNA species bound to METTL1. Upper panel: Boxplot representing the median Log2 fold change of reads per million (RPM) per transcript bound to METTL1 in PC3 cells. Lower panel: The bar plot shows the total number of unique genes bound to METTL1. B Validation of the lack of METTL1 expression and m7G tRNA methylation in PC3 METTL1 KO cell lines. Western blot of METTL1 (upper panel) and north-dot blot of m7G levels (lower panel). Proteins, long RNAs (> 200 nucleotides), and tRNAs (< 200 nucleotides) were extracted from three independent PC3 METTL1 KO clones and three control clones. Parental PC3 cells are shown. C LC–MS analysis of m7G levels in tRNAs isolated from PC3 METTL1 KO, control, and parental PC3 cells validate the absence of m7G in tRNAs extracted from METTL1 KO cells. Means ± SD are represented (n = 3). D Normalised cleavage signals for the tRNAs AlaAGC and PheGAA in PC3 WT and METTL1 KO cells. Letters on the right show the bases where methylation occurs. E Heatmap showing normalised cleavage values for all tRNAs with guanosines at position 46 in PC3 WT and METTL1 KO cells (n = 2 for each genotype). F tRNA secondary structure showing METTL1-methylated guanines (red circles) in the variable loop. G Graphical summary of tRNA isoacceptors methylated by METTL1 (red) and non-methylated or non-transcribed (grey). Statistical tests: two-tailed Student’s t-test (C). ****p < 0.0001
Fig. 4
Fig. 4
The lack of m7G methylation in tRNAs leads to 5'tRNA fragment accumulation. A Heatmap showing no differences in the levels of mature tRNAs (log2 normalised reads; RPKM) measured using tRNA-seq data. Rows represent individual tRNA isoacceptors and columns represent independent replicates. tRNA isoacceptor expression levels are row-scaled (each row is normalised to their mean expression and standard variation). B The top pie chart represents the percentage of all abundant tRNA fragments identified in PC3 METTL1 KO cells compared to that in WT cells. The bottom pie chart represents the percentage of differentially express tRNA fragments: fragments with log2 fold change (FC) > 2 and p value < 0.05 in PC3 METTL1 KO cells versus WT cells. The pie charts show that while 5'tRNA fragments are very abundant in KO cells, 5'TOGs are significantly overexpressed in KO cells compared to WT cells. 3'tRFS: 3' tRNA fragments; Int-tRFs: internal tRFs; 5'tRNA: 5'tRNA fragments > 18 and < 35 nucleotides; 5'-halves: 5'tRNA fragments > 35 nucleotides; 5'TOGs: 5'tRNA fragments > 18 and < 35 nucleotides, with 5′ terminal oligoguanine. C The boxplot shows the log2 fold change (FC) of all fragments (not just the differentially expressed tRNA fragments) in PC3 METTL1 KO versus WT cells. D Size and abundance (density) of 5'TOGs Cys-derived (5G) or Ala-derived (4G) fragments differentially expressed (log2 FC > 1.5, > 18 nt, and p < 0.05) in PC3 METTL1 KO cells versus WT cells. E Summary of 5'TOGs formed in PC3 METTL1 KO cells. F Increased tRNA fragmentation was observed by northern blot detection of Cys-derived 5’TOGs in PC3 METTL1 KO vs. WT cells (2 technical replicates of 2 biological replicates are represented) (left panel). The boxplot of the right shows quantification of densities of Cys-derived 5'TOGs formed versus full-length tRNAs. G, H Cys-derived 5'TOG fragments are induced by stress. Northern blot detection of Cys-derived 5'TOG in PC3 and DU145 METTL1 KO and WT cells unexposed (0 h), or after 2 and 8 h of oxidative stress exposure. The boxplots of the right show the fraction of Cys-derived 5'tRFs formed normalised to the fraction of full length tRNAs. Values are from two biological replicates, shown in this figure and in Supplementary Fig. S4G and S4J. The loading control of tRNA is shown in the bottom panel as red-safe staining (F–H). Bands corresponding to full length tRNAs are indicated with stars and 5'tRNA fragments are indicated with arrows. Statistical tests: one-tailed Student’s t-test. **p < 0.01 (F–H)
Fig. 5
Fig. 5
METTL1 downregulation suppresses protein synthesis, proliferation and tumour growth in vivo. A Global protein synthesis rate measured by flow cytometry analysis of OP-puromycin (OP-puro) incorporation reflects reduced protein synthesis in PC3 METTL1 KO cells compared to the control (WT). Fluorescence was normalised to cell size (FSC) in WT and METTL1 KO cells. Two biological and three technical replicates and the mean ± SD are shown. B Translation initiation and regulatory factors are displaced from the cap of mRNAs in METTL1 KO cells. Log2 fold change (FC) binding of the indicated translation initiation and regulatory factors to m7G-cap-coated sepharose beads in PC3 METTL1 KO vs. WT cells. Densitometry data were normalised to the input. Mean ± SEM, n = 3. C Anti-TOG RNAs block the 5'TOG-dependent displacement of translation initiation factors in vitro. Log2 FC of translation initiation factors bound to synthetic biotinylated-5'TOG in PC3 WT cells transfected with 5'TOG + Anti-TOGs (ANT) compared to PC3 WT cells transfected with 5'TOG + scramble RNAs (TOG). Densitometry data were normalised to the input. Mean ± SEM, n = 4. D Displacement of translation initiation factors from mRNA caps is TOG-dependent and can be reversed by expressing anti-TOG RNAs. Log2 fold change (FC) of m7G-cap-bound translation initiation factors in PC3 WT and METTL1 KO cells transfected with biotinylated-5'TOG (TOG) or anti-TOG RNA (ANT) versus cells transfected with scramble RNA oligonucleotides. Densitometry data were normalised to the input. Mean ± SEM, n = 3. Original wester blots are shown in supplementary figure S5 (B, C, D). E Growth curves of PC3 METTL1 KO, WT, and parental cells (PC3). Mean ± SD, n = 3. The dotted line represents the average growth of WT and parental or KO cells. F Reduced cell division rate, as measured by BrdU incorporation. G METTL1 depletion increased apoptosis in PC3 METTL1 KO cells. Flow cytometry analysis of Annexin V staining. Mean ± SD, n = 3. H Reduced spheroid formation capacity in PC3 METTL1 KO cells. Means ± SD, n = 3. The dotted line represents the average values of all WT or KO cells. I Tumour growth in xenografted PC3 METTL1 KO and WT cells in athymic nude mice reflects impaired tumour formation in the absence of METTL1. Mean ± SEM, n = 10. J-L Protein expression (J) and m7G methylation levels of tRNAs (K, L) of PC3 METTL1 KO cells ectopically expressing a doxycycline-inducible HA-tagged wild-type (WT) or a catalytic dead mutant (AFPA) version of METTL1. PC3 METTL1 KO cells were infected with an empty vector (eV) as a control. Methylene blue staining was used as the loading control (L, bottom panel). Mean ± SD, n = 3 (L). M, N Proliferation (M) and spheroid formation capacity (N) were dependent on METTL1 catalytic activity. PC3 METTL1 KO cells re-expressing METTL1 (WT) or catalytic dead mutant (AFPA) compared to METTL1 KO cells infected with empty vector (eV). Mean ± SD, n = 6. O, P 5'TOG transfection induces apoptosis and reduces cell proliferation. Percentage of apoptotic (O) and growth rates (P) of PC3 METTL1 KO and WT cells after transfection with synthetic 5'TOGs (TOG) or anti-TOG (ANT) RNAs. Controls (Cont) were transfected with scramble RNAs. Mean ± SD, n = 6 (O), n ≥ 10 (P). Statistical tests: Two-way ANOVA (E, I, L), one-way ANOVA (F, G, H), and one-tailed Student’s t-test (A-D, M-P). *p < 0.05, **p < 0.01, ***p < 0.001, ****p < 0.0001
Fig. 6
Fig. 6
Loss of m7G tRNA methylation results in distinct translational programmes. A Schematic overview of nascent polypeptide OP-puro-labelling and enrichment followed by LC–MS/MS peptide identification and quantification analysis (upper panel). Lower panel shows common differentially expressed nascent proteins ranked in a volcano plot according to their statistical p-value (-Log10 pV) and their relative abundance ratio (Log2 FC) between four replicates of PC3 WT and METTL1 KO cells. Coloured dots represent statistically (p-value < 0.05) upregulated (red) and downregulated (blue) proteins in METTL1 KO cells. B Gene Ontology (GO) category enrichment of biological processes in significantly (p-value < 0.05) upregulated (UP, FC > 1) or downregulated (Down, FC < 1) nascent proteins in METTL1 KO cells compared to WT cells. Categories were ranked according to their statistical P-value (-Log10 pV) and fold enrichment of genes found for each category. C No correlation between differentially expressed proteins (protein log2 FC) and their mRNA (protein log2 FC) was observed in PC3 WT vs. METTL1 KO cells. Coloured dots represent significant (p-value < 0.05) differentially expressed proteins (blue), mRNAs (yellow) or both (red) for each gene. D Representative polysome profile in WT (grey line) and METTL1 KO PC3 cells (red line) (left panel) shows reduced translation in METTL1 KO cells. The fraction of the abundance of each mRNA in each polysome fraction is shown with respect to the content in all fractions, reflecting increased translation of IRF9 and ISG15 in METTL1 KO cells. Mean ± SEM, n = 3. The right boxplot represents the fold change (FC) of mRNA content in the polysome fraction relative to non-polysome fractions. E Increased IRF9, ISG15 and STAT1 protein expression observed in PC3 METTL1 KO cells is 5'TOG-dependent. Protein expression levels are represented as log2 fold change for WT (grey bars) transfected with 5'TOG RNA (TOG) versus scramble control RNA (Ct), and METTL1 KO cells (red bars) transfected with anti-TOG RNAs (ANT) versus scramble control RNAs (Ct). Mean ± SEM, n = 3. Original western blots are shown in supplementary figure S7. F, G STAT1-dependence of apoptosis (F) and growth rates (G) of METTL1 KO and WT PC3 cells. KO cells were transfected with siScramble or siSTAT1. Mean ± SD, n = 6 (F, G). Statistical tests: One-tailed Student’s t-test was used (E–G). *p < 0.05, **p < 0.01, ***p < 0.001
Fig. 7
Fig. 7
METTL1 low expression in PCa is associated with increased cytotoxic infiltration and good response to ICB treatment. A Cytokine content in PC3 METTL1 KO compared to WT cell-conditioned media shows upregulation of pro-inflammatory (red) and downregulation of anti-inflammatory (blue) cytokines in METTL1 KO cells. The mean ± SD log2 fold change is shown (n = 4). The full expression array is shown in supplementary figure S8. B The upper panel shows a schematic overview of the workflow followed to analyse M1- or M2-like endotype polarisation of THP-1-derived Mø macrophages exposed to METTL1 KO and WT cell-conditioned medium (c.m.). The lower panel shows the T-distributed stochastic neighbour embedding (tSNE) analysis of macrophage polarisation (n = 3). C Proliferation of human peripheral blood CD3+ T cells co-cultured with primary Mø macrophages exposed to PC3 WT or METTL1 KO cells’ c.m. (n = three technical, two biological replicates). D Migration of human peripheral blood CD3+ T cells towards primary macrophages exposed to PC3 WT or METTL1 KO cells’ c.m. (n = three technical, two biological replicates). E Correlation between METTL1 expression and the immune cell infiltrates of M1-like macrophages (CD86), M2-like macrophages (CD163), and CD8+ T cells in human PCa samples. Immunostainings are shown in supplementary figure S8. F Prostate tumour volume from Pten-KO/Mettl1 + / + and Pten-KO/Mettl1flox/flox five-month-old mice reflects reduced tumour burden after conditional Mettl1 deletion. Ventral (V), dorsal (D) and anterior (A) lobes. Mean ± SD, n ≥ 5. G Conditional deletion of Mettl1 resulted in reduced tumour proliferation (Ki67 + cells) and increased immune infiltration of iNOS + (M1-like) macrophages and CD8+ T cells. Staining of tumours from Pten-KO/Mettl1 + / + (+ / +) and Pten-KO/Mettl1flox/flox (fl/fl) five-month-old mice. Mean ± SD, n ≥ 5, > 10 images per biological replicate. H Fold change of cytokines content in Pten-KO/Mettl1flox/flox versus Pten-KO/Mettl1 + / + tumours (n = 3). I Significant decrease in tumour volume (fold change: FC) in Pten-KO/Mettl1flox/flox (fl/fl) mice treated with anti-PD1 + anti-CTLA4 antibodies compared to untreated controls (IgG). Pten-KO/Mettl1 + / + (+ / +) mice tumour volume did not change after anti-PD1 + anti-CTLA4 treatment. Mean ± SD, n ≥ 6. J METTL1 mRNA expression levels in anti-PD1 responders and non-responders in clinical trials of breast cancer, ovarian cancer, colorectal cancer, and glioblastoma (n = 484). The data were retrieved from the ROC plotter. Statistical tests: Pearson’s correlation (r), p-value (pV), and linear regression with 95% confidence (bands) are shown (E). One-tailed Student’s t-test (A, C, D, G), Mann–Whitney test (F, I, J), *p < 0.05, **p < 0.01, ***p < 0.001

References

    1. Sung H, Ferlay J, Siegel RL, Laversanne M, Soerjomataram I, Jemal A, Bray F. Global Cancer Statistics 2020: GLOBOCAN estimates of incidence and mortality worldwide for 36 cancers in 185 countries. CA Cancer J Clin. 2021;71:209–249. - PubMed
    1. Attard G, Parker C, Eeles RA, Schroder F, Tomlins SA, Tannock I, Drake CG, de Bono JS. Prostate cancer. Lancet. 2016;387:70–82. - PubMed
    1. Cancer Genome Atlas Research N. The molecular taxonomy of primary prostate cancer. Cell. 2015;163:1011–25. - PMC - PubMed
    1. Armenia J, Wankowicz SAM, Liu D, Gao J, Kundra R, Reznik E, Chatila WK, Chakravarty D, Han GC, Coleman I, et al. The long tail of oncogenic drivers in prostate cancer. Nat Genet. 2018;50:645–651. - PMC - PubMed
    1. Robinson D, Van Allen EM, Wu YM, Schultz N, Lonigro RJ, Mosquera JM, Montgomery B, Taplin ME, Pritchard CC, Attard G, et al. Integrative clinical genomics of advanced prostate cancer. Cell. 2015;161:1215–1228. - PMC - PubMed

Publication types