. 2023 Oct 2;220(10):e20230037.
doi: 10.1084/jem.20230037. Epub 2023 Jul 26.

Type I interferons drive MAIT cell functions against bacterial pneumonia

Affiliations

Type I interferons drive MAIT cell functions against bacterial pneumonia

Juan Carlos López-Rodríguez et al. J Exp Med. .

Abstract

Mucosal-associated invariant T (MAIT) cells are abundant in the lung and contribute to host defense against infections. During bacterial infections, MAIT cell activation has been proposed to require T cell receptor (TCR)-mediated recognition of antigens derived from the riboflavin synthesis pathway presented by the antigen-presenting molecule MR1. MAIT cells can also be activated by cytokines in an MR1-independent manner, yet the contribution of MR1-dependent vs. -independent signals to MAIT cell functions in vivo remains unclear. Here, we use Klebsiella pneumoniae as a model of bacterial pneumonia and demonstrate that MAIT cell activation is independent of MR1 and primarily driven by type I interferons (IFNs). During Klebsiella infection, type I IFNs stimulate activation of murine and human MAIT cells, induce a Th1/cytotoxic transcriptional program, and modulate MAIT cell location within the lungs. Consequently, adoptive transfer or boosting of pulmonary MAIT cells protect mice from Klebsiella infection, with protection being dependent on direct type I IFN signaling on MAIT cells. These findings reveal type I IFNs as new molecular targets to manipulate MAIT cell functions during bacterial infections.


Conflict of interest statement

Disclosures: P. Klenerman reported having acted as a consultant/advisory board member for UCB, AZ, Infinitopes, and Biomunex. No other disclosures were reported.

Figures

None
Graphical abstract
Figure 1.
Figure 1.
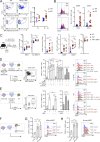
K. pneumoniae induces MR1-independent accumulation and activation of pulmonary MAIT cells. (A and B) Flow cytometry plots and quantification of MAIT cell absolute numbers (A) or mean fluorescence intensity (MFI) for MAIT cells’ CD69 and CD25 (B) in the lungs of WT mice 48 h after infection with K. pneumoniae (+KP, red) or uninfected controls (−KP, blue). Stainings with 5-OP-RU MR1–loaded tetramer (top) or control Ac-6-FP–loaded tetramer (bottom) are shown in A. Lines represent mean ± SEM, each dot is a mouse (n = 5–17), and data are pooled from more than three independent experiments. *P < 0.05, **P < 0.01, ***P < 0.001; two-way ANOVA with Tukey’s multiple comparisons (A) or unpaired two-tailed t test (B). (C) WT mice were injected with αMR1 antibody or isotype control prior to Klebsiella infection. Absolute numbers and frequency of pulmonary MAIT cells and non-MAIT T cells, MFI for CD69 and CD25, and lung bacterial burden (CFUs) are shown. Lines represent mean ± SEM, each dot is a mouse (n = 6–9), and data are pooled from two to three independent experiments. *P < 0.05, **P < 0.01; one-way ANOVA with Tukey’s multiple comparisons. (D) Murine T cells (enriched from spleen and inguinal lymph nodes of WT mice as B220 cells) were cultured (for 3 h) with RAW264.7 macrophages in the presence/absence of alive K. pneumoniae (MOI = 100) or 5-OP-RU and blocking antibodies as indicated. The frequency of CD69+ MAIT cells measured by flow cytometry is shown. Bars represent mean ± SEM, each dot is an independent experiment (n = 4–5) performed with T cells obtained from five to six mice. Right: Representative histograms for MAIT cells’ CD69 (including MFI values) after culture with Klebsiella (top) or 5-OP-RU (bottom). ***P < 0.001, ****P < 0.0001; ns, not significant, two-way ANOVA with Tukey’s multiple comparisons test. (E) Human CD8+ T cells were cultured (for 18 h) with autologous CD14+ monocytes in the presence/absence of (fixed) K. pneumoniae or 5-OP-RU and blocking antibodies as indicated. The frequency of CD69+ MAIT cells measured by flow cytometry is shown. Bars represent mean ± SEM, each dot is an independent experiment (n = 4) with data from two donors. Right: Representative histograms for MAIT cells’ CD69 (including MFI values) after culture with Klebsiella (top) or 5-OP-RU (bottom). *P < 0.5, **P < 0.01, ****P < 0.0001; ns, not significant, two-way ANOVA with Tukey’s multiple comparisons test. (F) Experimental setup for coculture of murine (G) and human (H) MAIT cells with WT (KP, Kp43816) or mutant (KPΔribD) Klebsiella. (G) Murine T cells (enriched from spleen and inguinal lymph nodes of WT mice as B220 cells) were cultured (for 3 h) with RAW264.7 macrophages in the presence/absence of WT (KP, Kp43816) or mutant KPΔribD as indicated. Representative histograms and frequency of CD69+ MAIT cells measured by flow cytometry are shown. Bars represent mean ± SEM, data are pooled from two independent experiments performed with T cells obtained from three mice. **P < 0.01; ns, not significant, one-way ANOVA with Tukey’s multiple comparisons test. (H) Human CD8+ T cells were cultured (for 18 h) with autologous CD14+ monocytes in the presence/absence of WT (KP, Kp43816) or mutant KPΔribD as indicated. Representative histograms and frequency of CD69+ MAIT cells measured by flow cytometry are shown. Bars represent mean ± SEM, data pooled from two independent experiments. ****P < 0.0001; ns, not significant, one-way ANOVA with Tukey’s multiple comparisons test.
Figure S1.
Figure S1.
Pulmonary MAIT cell populations during K. pneumonia infection. (A) Flow cytometry gating strategy for pulmonary MAIT cells (ZombieTCRβ+CD44+MR1:Tetramer (5-OP-RU)+) in WT C57BL/6J mice. (B) Body-weight loss in WT mice at 24 and 48 h after infection with K. pneumoniae (+KP, red) or uninfected controls (−KP, blue). Lines represent mean ± SEM, each dot is a mouse (n = 12–23). ***P < 0.001, ****P < 0.0001, two-way ANOVA with Tukey’s multiple comparisons test. (C) Bacterial burden in the lungs, spleen, and liver of infected WT mice at the indicated time points; each dot is a mouse (n = 5–8). (D) Absolute numbers of pulmonary non-MAIT T cells (left) and MAIT cell frequencies (respect to TCRβ+ cells, right) in WT mice 48 h after infection with K. pneumoniae (+KP, red) or uninfected controls (−KP, blue). Lines represent mean ± SEM, each dot is a mouse (n = 5–17), data pooled from more than three independent experiments. **P < 0.01; two-way ANOVA with Tukey’s multiple comparisons. (E) Representative flow cytometry plots showing expression of the depicted markers in pulmonary MAIT cells 48 h after infection with K. pneumoniae. FMO, fluorescence minus one. (F) Flow cytometry quantification of RORγt/T-bet expression and CD4/CD8 expression for pulmonary MAIT cells 48 h after infection with K. pneumoniae (+KP, red) or uninfected controls (−KP, blue). Each dot is a mouse (n = 3–7); data pooled from two to three independent experiments. (G) Flow cytometry plots showing expression of CD69 and CD25 in pulmonary MAIT cells from WT mice receiving i.n. 5-OP-RU or PBS (control). Mice were injected with anti-MR1 blocking antibody or isotype control (iso) 24 h earlier. Absolute numbers and frequency of pulmonary MAIT cells and non-MAIT T cells and MFI for CD69 and CD25 are shown. Lines represent mean ± SEM, each dot is a mouse (n = 3–4). *P < 0.05, **P < 0.01, ***P < 0.001, ****P < 0.0001; one-way ANOVA with Tukey’s multiple comparisons. (H) Left: Nur77 expression in pulmonary MAIT cells from WT mice infected with Klebsiella (left), CD69+ and CD69 MAIT cells from Klebsiella-infected mice (middle), pulmonary MAIT cells from 5-OP-RU injected mice (5-OP), or splenic MAIT cells from mice infected with E. coli (i.p., 5 × 10³ CFUs/mouse, right). Lines represent mean ± SEM; each dot is a mouse (n = 4); data pooled from two to three independent experiments. Right: Representative flow cytometry plots for Nur77 expression for pulmonary MAIT cells for mice infected with Klebsiella (left) or receiving 5-OP-RU (right). *P < 0.05; **P < 0.01; ns, not significant, unpaired two-tailed t test. (I) Representative flow cytometry profiles showing expression of MR1 in RAW264.7 cells (left) or CD14+ monocytes (right). (J) Murine T cells (enriched from spleen and inguinal lymph nodes of WT mice as B220 cells) were cultured with RAW264.7 macrophages in the presence/absence of K. pneumoniae (for 24 h, left) or S. aureus (SA, for 3 h, right) and blocking antibodies as indicated. Representative histograms for MAIT cells CD69 (including MFI values) and frequency of CD69+ MAIT cells in response to SA (right) are shown. Bars represent mean ± SEM, data are pooled from two independent experiments with T cell isolated from three to five mice. *P < 0.5, **P < 0.01, ANOVA with Tukey’s multiple comparisons test.
Figure 2.
Figure 2.
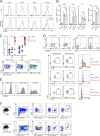
Type I IFN drives MAIT cell activation in response to Klebsiella. (A–E) Human MAIT cells were sorted from PBMCs (four healthy donors) after incubation with Klebsiella, IFNα2A, influenza virus, or no stimuli (control) and subjected to RNAseq analyses. (A) Volcano plot including DEGs up- (red) or downregulated (blue) in response to Klebsiella vs. control. Labeled genes are colored black. A log2 fold change cut-off of 0.5 and adjusted P value cut-off of 0.01 were applied. (B) Left: Relative gene expression of selected transcripts in MAIT cells exposed to Klebsiella (red) vs. control (blue). Boxes show 25th to 75th percentiles with whiskers being max/min values. Top right: Results of GSEA hallmark pathway analysis showing top enriched gene sets. Normalized enrichment score (NES) values indicate enrichment (red bars, positive NES) in response to Klebsiella or in control (blue bars, negative NES). Bottom right: GSEA enrichment plot of “interferon alpha response” gene set. (C) Venn diagram showing the number of DEGs in MAIT cells in response to Klebsiella, IFNα2A, or influenza. (D) Heatmap for fold change of selected transcripts significantly changed in MAIT cells in response to Klebsiella, IFNα2A, or influenza vs. control. (E) Venn diagram (left) showing the number of DEGs in MAIT cells in response to Klebsiella and 5-OP-RU (transcriptomic data obtained from Hinks et al. [2019]; Lamichhane et al. [2019]). Functional enrichment analysis (right) of genes positively changed on MAIT cells exposed to 5-OP-RU and Klebsiella (“common DEGs,” top) or for DEGs enriched only on MAIT cells exposed to Klebsiella but not in cells treated with 5-OP-RU (“Klebsiella only DEGs,” bottom). Top GO terms are shown ranked by P values. (F) Human CD8+ T cells were cultured (for 18 h) with autologous CD14+ monocytes in presence/absence of (fixed) K. pneumoniae and blocking antibodies and/or the type I IFN inhibitor B18R as indicated. Frequency of CD69+ MAIT cells (measured by flow cytometry) is shown. Bars represent mean ± SEM, each dot is an independent experiment (n = 4) with data from two donors, ***P < 0.001, ****P < 0.0001; ns, not significant, two-way ANOVA with Tukey’s multiple comparisons test. (G) Murine MAIT cells were sorted from the lungs of WT or IFNAR-KO mice (previously injected with 5-OP-RU+LPS to expand the MAIT cell population) and cultured (for 18 h) with RAW264.7 macrophages in the presence/absence of (fixed) K. pneumoniae and blocking antibodies as indicated. Left: Representative histograms for MAIT cells’ CD69 (including MFI values) after culture with Klebsiella and blocking antibodies. Right: Frequency of CD69+ MAIT cells measured by flow cytometry. Bars represent mean ± SEM, each dot is an independent experiment (n = 3–8) performed with MAIT cells obtained from 5 to 10 mice. ***P < 0.001, ****P < 0.0001, one-way ANOVA with Tukey’s multiple comparisons test. (H) WT mice were injected with αIFNAR antibody or isotype control prior to infection with K. pneumoniae. Flow cytometry plot for CD69 expression (middle) and quantification of CD69 MFI (right) for pulmonary MAIT cells are shown. Lines represent mean ± SEM, each dot is a mouse (n = 5–6), and data are pooled from two independent experiments. ****P < 0.0001, one-way ANOVA with Tukey’s multiple comparisons test. (I) Murine MAIT cells were sorted from the lungs of WT mice (previously injected with 5-OP-RU+LPS to expand the MAIT cell population) and cultured with IFNα (top) or the supernatant of Klebsiella-treated RAW264.7 cells (bottom). Representative flow cytometry plots (from three independent experiments) show phosphorylation of STAT1 in MAIT cells after 60 min of stimulation. Red profile = stimulated cells; blue = unstimulated controls. (J) MAIT cells were sort-purified from murine lungs (left) or human PBMCs (right) and incubated with IFNα for 18 h. Frequency of CD69+ MAIT cells (measured by flow cytometry) is shown. Bars represent mean ± SEM, and each dot is a replicate from three independent experiments performed with MAIT cells obtained from five mice each (left) or pooled data from two donors (right). **P < 0.01, ***P < 0.001, unpaired two-tailed t test.
Figure S2.
Figure S2.
MAIT cells’ transcriptional programs. (A–F) Human MAIT cells were sorted from PBMCs (four healthy donors) after incubation with Klebsiella, IFNα2A, influenza virus, or no stimuli (control) and subjected to RNAseq analyses. (A and B) Functional enrichment analysis of genes positively changed in MAIT cells exposed to Klebsiella vs. control (A), or for DEGs enriched in MAIT cells exposed to Klebsiella, IFNα, and influenza (B; “common DEGs”). The GO terms are shown ranked by P values. Enrichment and P values (from a Fisher’s exact test with Bonferroni correction) were calculated with PANTHER tools. (C and D) Human MAIT cells were sorted from PBMCs (four healthy donors) after incubation with IFNα2A (C), influenza virus (D; or no stimuli [control]) and subjected to RNAseq analyses. Left: Volcano plots including DEGs up- (red) or downregulated (blue) in response to IFNα vs. control (C) or influenza vs. control (D). Labeled genes are colored black. A log2 fold change cut-off of 0.5 and adjusted P value cut-off of 0.01 were applied. Right: Results of GSEA hallmark pathway analysis showing enriched gene sets. Adjusted P values and NES for the indicated pathways are shown (red bars, positive NES; blue bars, negative NES). (E) Analyses of DEGs enriched in MAIT cells exposed to Klebsiella but not in cells exposed to IFNα or influenza (K. pneumoniae “only DEGs”). Labeled genes are colored black. A log2 fold change cut-off of 0.5 and adjusted P value cut off of 0.01 were applied. Top right: Functional enrichment analysis of K. pneumoniae “only DEGs.” The GO terms are shown ranked by P values. Enrichment and P values (from a Fisher’s exact test with Bonferroni correction) were calculated with PANTHER tools. Bottom right: Relative gene expression of selected transcripts in MAIT cells exposed to Klebsiella (red) vs. control (blue). Boxes show 25th to 75th percentiles with whiskers being max/min values. (F) Heatmap (left) and GSEA plot (right) for “tissue repair” associated genes as described by Hinks et al. (2019). (G and H) MAIT cells were sorted from the lungs of WT mice (previously injected with 5-OP-RU+LPS to expand the MAIT cell population) and cultured (18 h) with RAW264.7 macrophages in the presence/absence of K. pneumoniae, 5-OP-RU, and/or anti-MR1 blocking antibody (1 or 10 μg/ml) or isotype (control) as indicated. Frequencies (G) and representative histograms (H) for MAIT cells CD69 (including MFI values) are shown from two independent experiments performed with MAIT cells obtained from three to five mice. Bars represent mean ± SEM, ****P < 0.0001, one-way ANOVA with Tukey’s multiple comparisons test.
Figure S3.
Figure S3.
Type I IFN–dependent MAIT cell activation. (A) Murine MAIT cells were sorted from the lungs of WT mice (previously injected with 5-OP-RU+LPS to expand the MAIT cell population) and cultured with IFNα or the supernatant of Klebsiella-treated RAW264.7 cells. Representative flow cytometry plots (from three independent experiments) show phosphorylation of STAT1 in MAIT cells at the indicated time points after stimulation with IFNα (top) or the supernatant of Klebsiella-treated RAW264.7 cells (bottom). Red profile = stimulated cells; blue = unstimulated controls. (B) MAIT cells were sorted from the lungs of WT mice (previously injected with 5-OP-RU+LPS to expand the MAIT cell population) and cultured (for 18 h) with RAW264.7 macrophages in the presence/absence of WT (KP, Kp43816) or mutant KPΔribD as indicated. Frequencies of Granzyme B (GrzB+), IFN-γ+, IL-17+, or CD69+ MAIT cells is shown; data are pooled from two independent experiments with MAIT cells obtained from three to five mice. Bars represent mean ± SEM, *P < 0.5, ***P < 0.001, ****P < 0.0001; ns, not significant, one-way ANOVA with Tukey’s multiple comparisons test. (C) Flow cytometry plots and quantification of MAIT cell frequency in WT mice after i.n. challenges with PBS (blue), LPS (black), and 5-OP-RU+LPS (red). Lines represent mean ± SEM, each dot represents a mouse (n = 5–20). **P < 0.01, one-way ANOVA with Tukey’s multiple comparisons test. (D) Flow cytometry plots showing T-bet/RORγt, CD4/CD8, CD69/CD25/CD137, IFNγ/IL-17A/GramB in pulmonary MAIT cells from PBS-treated (control) vs. 5-OP-RU/LPS-treated mice. (E) Flow cytometry plots for CXCR6 expression in MAIT cells (CD3ε+MR1(5-OP-RU)Tetramer+), invariant natural killer T (iNKT) cells (CD3ε+CD1d(PBS-57)Tetramer+), and γδT cells (CD3ε+TCRγδ+) in the lungs of WT mice. (F) Flow cytometry plots showing CD3+GFP+ cells and frequency of MAIT cells, iNKT cells, and γδ T cells within the CD3+GFP+ population in the lung of CXCR6-eGFP mice without (top) or with (bottom) 5-OP-RU+LPS administration.
Figure 3.
Figure 3.
Type I IFNs control MAIT cell effector functions during K. pneumoniae infection. (A) GSEA plots showing enrichment for the transcriptional signatures for MAIT1-cytotoxic/effector phenotype (Vorkas et al., 2022) for MAIT cells treated with Klebsiella (top) or IFNα2A (bottom). FDR, false discovery rate. (B and C) Murine MAIT cells were sorted from the lungs of WT or IFNAR-KO mice (previously injected with 5-OP-RU+LPS to expand the MAIT cell population) and cultured (for 18 h) with RAW264.7 macrophages in the presence/absence of K. pneumoniae and blocking antibodies as indicated. Flow cytometry profiles (B) and normalized frequencies (respect to KP+ condition, C) of Granzyme B (GrzB)+, IFN-γ+, or IL-17+ MAIT cells (measured by flow cytometry) are shown. Bars represent mean ± SEM, each dot is an independent experiment (n = 3–8) performed with MAIT cells obtained from 5 to 10 mice. ns, not significant; *P < 0.05, **P < 0.01, ****P < 0.0001, one-way ANOVA with Tukey’s multiple comparisons test. (D) Secretion of Granzyme B (GrzB), IL-17A, and IFN-γ by sorted pulmonary murine MAIT cells after overnight incubation with IFNα (or untreated control). Bars represent mean ± SEM, data are pooled from five independent experiments performed with MAIT cells obtained from 5 to 10 mice each, ***P < 0.001; one-way ANOVA with Tukey’s multiple comparisons test. (E) WT mice or IFNAR-KO mice were infected with Klebsiella (+KP) and frequency of Granzyme B+ or IL-17+ MAIT cells in the lung of infected animals was measured at 48 hpi. WT mice were injected with αIFNAR antibody or isotype control (Iso) prior to infection as indicated. Bars represent mean ± SEM, each dot is a mouse (n = 5–12), and data pooled from three to four independent experiments. **P < 0.01 ***P < 0.001, ****P < 0.0001, one-way ANOVA with Tukey’s multiple comparisons test. (F) Human CD8+ T cells were cultured (for 18 h) with autologous CD14+ monocytes in the presence/absence of (fixed) K. pneumoniae and blocking antibodies and/or the type I IFN inhibitor B18R as indicated. The frequency of Granzyme B+ MAIT cells is shown. Bars represent mean ± SEM, each dot is an independent experiment (n = 4) with data from two donors, ****P < 0.0001; ns, not significant, two-way ANOVA with Tukey’s multiple comparisons test. (G) Murine MAIT cells were sorted from the lungs of WT mice (previously injected with 5-OP-RU+LPS to expand the MAIT cell population) and cultured (for 18 h) with RAW264.7 macrophages in presence of WT (KP, Kp43816) or mutant KPΔribD as indicated. Representative flow cytometry profiles of Granzyme B (GrzB)+, IFN-γ+, or IL-17+ MAIT cells (left) and CD69 expression (MFI, right) are shown. Data are representative from two independent experiments performed with MAIT cells obtained from three to five mice. (H) Human CD8+ T cells were cultured (for 18 h) with autologous CD14+ monocytes in presence/absence of WT (KP, Kp43816) or mutant KPΔribD as indicated. Flow cytometry profiles and frequencies of Granzyme B (GrzB)+ MAIT cells is shown. Bars represent mean ± SEM, with data pooled from two independent experiments. *P < 0.05; one-way ANOVA with Tukey’s multiple comparisons test.
Figure 4.
Figure 4.
Type I IFN controls MAIT cell–dependent protection from K. pneumoniae infection. (A) Pulmonary MAIT cells from WT or IFNAR-KO mice (previously injected with 5-OP-RU+LPS to expand the MAIT cell population) were sorted and transferred intravenously into TCRα-deficient mice (day 0), followed by i.p. anti-CD4 and anti-CD8 antibody injection (days 2 and 6) to deplete any residual conventional T cells. On day 14, mice were infected with Klebsiella. Flow cytometry plots show the population of MAIT cells recovered from the lungs of control mice (no adoptive transfer) or those receiving WT (middle) or IFNAR-KO MAIT cells (right). Lung bacterial burden (absolute CFUs) were quantified at 48 hpi (right). Boxes show 25th to 75th percentiles with whiskers being max/min values, each dot is a mouse (n = 4–13), and data are pooled from three to six independent experiments, **P < 0.01, Kruskal–Wallis test. (B–D) Pulmonary MAIT cells from WT mice (previously injected with 5-OP-RU+LPS to expand the MAIT cell population) were sorted and transferred intravenously into IFNAR-KO (C) or MR1-KO mice (D). On day 7, after transfer, mice were infected with Klebsiella. Body-weight loss and lung bacterial burden (as absolute number of CFUs) were quantified at 48 hpi in WT, IFNAR-KO, or IFNAR-KO+MAIT mice (C) or in MR1-KO and MR1-KO+MAIT mice (D). Lines represent mean ± SEM (left) and boxes (right) show 25th to 75th percentiles with whiskers being max/min values, each dot is a mouse (n = 3–10), and data are pooled from two to four independent experiments, *P < 0.05, **P < 0.01, ***P < 0.001; ANOVA with Tukey’s multiple comparisons test (C, left), Kruskal–Wallis test (C, right), unpaired t test (D, left), Mann–Whitney test (D, right). (E and F) WT mice received three doses of 5-OP-RU+LPS, LPS, or PBS (control) as indicated (days 0, 2, and 4) and were infected with Klebsiella at day 7. (E) Body-weight loss (left) and lung bacterial burden (as absolute number of CFUs, right) are shown for mice receiving PBS (control, blue), LPS (black), or 5-OP-RU+LPS (red). Lines represent mean ± SEM (left) and boxes (right) show 25th to 75th percentiles with whiskers being max/min values. Each dot is a mouse (n = 6–7) and data are pooled from three to four independent experiments, **P < 0.01, ***P < 0.001, ****P < 0.0001 two-way ANOVA with Tukey’s multiple comparisons test (left) or Kruskal–Wallis test (right). (F) Lung sections stained with H&E of Klebsiella-infected WT mice pretreated with PBS, LPS, or 5-OP-RU+LPS as indicated. Quantification of lung injury (alveolar macrophages and neutrophils infiltration as well as intravascular bacterial lesions) is shown. Lung injury scores were determined by blinded scoring (from 0 to 12). Scale bar = 200 μm. Lines represent mean ± SEM, each dot is a mouse (n = 3–6), **P < 0.01, ***P < 0.001, two-way ANOVA with Tukey’s multiple comparisons test. (G) WT mice received three doses of 5-OP-RU+LPS and were injected with the depicted blocking antibodies (or isotype controls) prior to infection with Klebsiella. Bacterial burden (CFUs) recovered from the lungs are shown. Boxes show 25th to 75th percentiles with whiskers being max/min values, each dot is a mouse (n = 4–7), and data are pooled from two to three independent experiments, **P < 0.01, ns, not significant, Mann–Whitney test. (H) WT or IFNAR-KO mice were i.n. treated with 5-OP-RU+LPS and then infected with 5 × 10⁴ CFUs of K. pneumoniae. Plots represent lung bacterial burden (CFUs) at 48 hpi for WT (blue) and IFNAR-KO (red) mice. Boxes show 25th to 75th percentiles with whiskers being max/min values, each dot is a mouse (n = 7–8), and data are pooled from three independent experiments, **P < 0.01, Mann–Whitney test.
Figure 5.
Figure 5.
K. pneumoniae infection induces MAIT cell relocation in the lung tissue. (A and B) WT mice were infected with K. pneumoniae or received PBS (−KP, control) and were i.v. injected with FITC-labeled αCD45 antibody 3 min prior to tissue collection. (A) Representative flow cytometry plots (middle) and quantification (right) of the frequency of pulmonary MAIT cells stained (CD45+) or not (CD45) with FITC-labeled αCD45. (B) Representative flow cytometry plots (left) and quantification (right) of the frequency of CD69+ pulmonary MAIT cells stained (CD45+) or not (CD45) with FITC-labeled αCD45. Lines represent mean ± SEM, each dot is a mouse (n = 5), and data are pooled from two to three independent experiments. *P < 0.05, ***P < 0.001, ****P < 0.0001, two-way ANOVA with Tukey’s multiple comparisons test. (C) Left: Staining of lung tissue (FLASH) for CXCR6-GFP mice (previously injected with 5-OP-RU+LPS to expand the MAIT cell population) showing GFP (pink), CD3 (yellow), and podoplanin (blue). Arrowheads indicate MAIT cells identified as CD3+GFP+ cells. Mice were infected with K. pneumoniae (+KP) or received PBS (−KP) and αIFNAR blocking antibody (bottom) or isotype control (top) prior to infection. Scale bar = 50 μm. Right: Quantification of cell distance evaluated by measuring the spatial distance (μm) between CD3+GFP+ cells. Each dot represents the average distance (μm) between all CD3+GFP+ cells per frame (n = 9–18 frames per condition) from two independent experiments. *P < 0.05, **P < 0.01, two-way ANOVA with Tukey’s multiple comparisons.

References

    1. Balestrino, D., Haagensen J.A., Rich C., and Forestier C.. 2005. Characterization of type 2 quorum sensing in Klebsiella pneumoniae and relationship with biofilm formation. J. Bacteriol. 187:2870–2880. 10.1128/JB.187.8.2870-2880.2005 - DOI - PMC - PubMed
    1. Bengoechea, J.A., and Sa Pessoa J.. 2019. Klebsiella pneumoniae infection biology: Living to counteract host defences. FEMS Microbiol. Rev. 43:123–144. 10.1093/femsre/fuy043 - DOI - PMC - PubMed
    1. Blasius, A.L., Cella M., Maldonado J., Takai T., and Colonna M.. 2006. Siglec-H is an IPC-specific receptor that modulates type I IFN secretion through DAP12. Blood. 107:2474–2476. 10.1182/blood-2005-09-3746 - DOI - PMC - PubMed
    1. Boulouis, C., Sia W.R., Gulam M.Y., Teo J.Q.M., Png Y.T., Phan T.K., Mak J.Y.W., Fairlie D.P., Poon I.K.H., Koh T.H., et al. . 2020. Human MAIT cell cytolytic effector proteins synergize to overcome carbapenem resistance in Escherichia coli. PLoS Biol. 18:e3000644. 10.1371/journal.pbio.3000644 - DOI - PMC - PubMed
    1. Cano, V., March C., Insua J.L., Aguiló N., Llobet E., Moranta D., Regueiro V., Brennan G.P., Millán-Lou M.I., Martín C., et al. . 2015. Klebsiella pneumoniae survives within macrophages by avoiding delivery to lysosomes. Cell. Microbiol. 17:1537–1560. 10.1111/cmi.12466 - DOI - PubMed

Publication types

Substances