. 2023 Sep:95:104725.
doi: 10.1016/j.ebiom.2023.104725. Epub 2023 Jul 28.

Neuronal actin cytoskeleton gain of function in the human brain

Affiliations

Neuronal actin cytoskeleton gain of function in the human brain

Kinga Szigeti et al. EBioMedicine. 2023 Sep.

Abstract

Background: While advancements in imaging techniques have led to major strides in deciphering the human brain, successful interventions are elusive and represent some of the most persistent translational gaps in medicine. Human restricted CHRFAM7A has been associated with neuropsychiatric disorders.

Methods: The physiological role of CHRFAM7A in human brain is explored using multiomics approach on 600 post mortem human brain tissue samples. The emerging pathways and mechanistic hypotheses are tested and validated in an isogenic hiPSC model of CHRFAM7A knock-in medial ganglionic eminence progenitors and neurons.

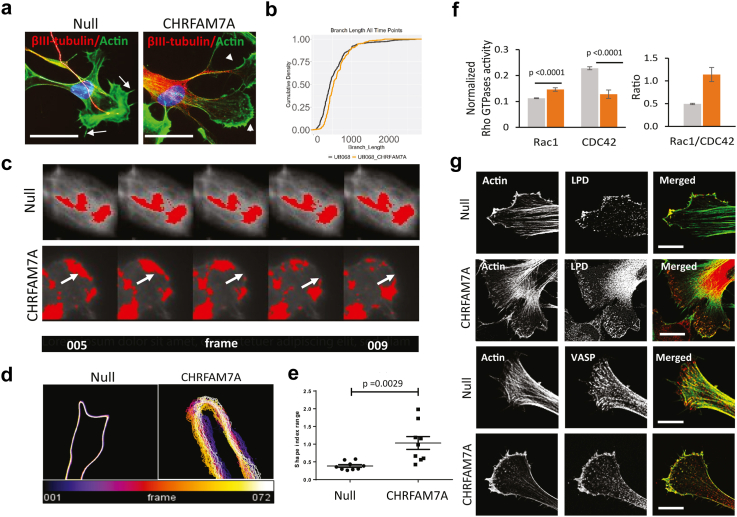
Findings: CHRFAM7A is identified as a modulator of intracellular calcium dynamics and an upstream regulator of Rac1. Rac1 activation re-designs the actin cytoskeleton leading to dynamic actin driven remodeling of membrane protrusion and a switch from filopodia to lamellipodia. The reinforced cytoskeleton leads to an advantage to tolerate stiffer mechanical properties of the extracellular environment.

Interpretation: CHRFAM7A modifies the actin cytoskeleton to a more dynamic and stiffness resistant state in an α7nAChR dependent manner. CHRFAM7A may facilitate neuronal adaptation to changes in the brain environment in physiological and pathological conditions contributing to risk or recovery. Understanding how CHRFAM7A affects human brain requires human studies in the areas of memory formation and erasure, cognitive reserve, and neuronal plasticity.

Funding: This work is supported in part by the Community Foundation for Greater Buffalo (Kinga Szigeti). Also, in part by the International Society for Neurochemistry (ISN) and The Company of Biologists (Nicolas Rosas). ROSMAP is supported by NIA grants P30AG10161, P30AG72975, R01AG15819, R01AG17917. U01AG46152, and U01AG61356.

Keywords: Actin cytoskeleton; CHRFAM7A; Human brain; Multiomics analysis; iPSC.


Conflict of interest statement

Declaration of interests The authors declare no conflict of interest.

Figures

Fig. 1
Fig. 1
RNAseq analysis predicts CHRFAM7A effect on the synapse as a structure. a. Relevant sample and data distribution in the ROSMAP study. b. Demographic characterization of the cohort with RNAseq and SRM proteomics data. c. Kernel distribution of Aβ peptide quantified by SRM in disease groups in the ROSMAP cohort demonstrates disease relevance (created with BioRender.com). d. Aβ peptide and CHRFAM7A gene expression associated pathways (red, upregulated, blue downregulated) using a multivariable regression model. Aβ associated pathways align with AD related neurodegeneration including increased ECM and decreased metabolism. CHRFAM7A top 3 pathways are related to the synapse without neurotransmitter specificity suggesting a functional role in the synapse as a structure. e. Heatmap depicting the leading edges of the top pathway positively associated with CHRFAM7A expression. f. Pie chart depicting the frequency of cytoskeleton (48%) and Ca2+ signalling (19%) associated genes in top 100 positively correlated genes with CHRFAM7A. g. Pie chart depicting the distribution of structural gene categories. h. Violin plots of cytoskeleton (top panel) and Ca2+ signalling associated genes (bottom panel) in CHRFAM7A gene expression quartiles. To compare the difference of means between quartiles, Kruskal–Wallis test (non-parametric ANOVA) was performed.
Fig. 2
Fig. 2
Ca2+dynamics. a. Representative fluorescent Ca2+ time-lapse video recordings of null and CHRFAM7A KI isogenic iPSC derived MGE progenitors. b. Representative fluorescent Ca2+ traces from cells marked in videos in a. c. Representative time-lapse video frames demonstrating the Ca2+ signal change over time in null and CHRFAM7A MGE progenitors (white box active Ca2+ signal time interval in Null, red box active Ca2+ signal time interval in CHRFAM7A KI MGE progenitors). d. Cumulative density curves of Ca2+ peak characteristics in null and CHRFAM7A KI isogenic iPSC derived MGE progenitors. Operator independent analysis of single cell Ca2+ tracings was performed in MatLab. (3 independent experiments, 50–100 peaks per cell line). Statistical comparison was performed using the two-sample Kolmogorov–Smirnov test. Multiple testing correction was performed by the Bonferroni method. (A amplitude, FWHM form width at half maximum amplitude). e. Proposed mechanism of CHRFAM7A modified Ca2+ Flux (created with BioRender.com). f. Ca2+ dynamics curve morphology indicates a shift in time occupancy of CICR to IICR in the presence of CHRFAM7A.
Fig. 3
Fig. 3
Actin cytoskeleton gain of function. a. Representative confocal images of iPSC derived MGE progenitors 48 h after plating on Matrigel. (Red–βIII-tubulin; green—Actin, phalloidin). Filopodia are indicated by arrows and lamellipodia by arrowheads. Scale bar, 10 μm. b. Cumulative density curves of branch length in MGE progenitors (48 h after plating) derived from the null (grey) and CHRFAM7A KI (orange) lines. Statistical comparison was performed using the two-sample Kolmogorov–Smirnov test, not significant. c. Actin lattice change over time depicted in consecutive frames of live actin video recording in MGE progenitors derived from the null and CHRFAM7A KI lines (arrows: area of interest over time). d. Live actin imaging of MGE progenitors: representative image of growth cone surface undulations depicted by overlaying colour coded frames (Supplementary Video 1–6). e. Cell surface topology dynamic changes over time are quantified as variance in shape index in null and CHRFAM7A KI isogenic iPSC derived MGE progenitors (n = 3; independent two-tailed-T-test, the horizontal lines represent median and IQR). f. Activation of small GTPases in response to Matrigel in null (grey) and CHRFAM7A KI isogenic (orange) MGE progenitors detected by G-LISA and Rac1/CDC42 ratio (n = 3; independent two-tailed T-test. Multiple testing correction was performed by Bonferroni). g. Representative confocal images demonstrating differential staining of lamellipodia (by lamellipodin, LPD) and filopodia (by VASP) in MGE progenitors derived from the two lines.
Fig. 4
Fig. 4
CHRFAM7A-dependent adaptation to mechanical properties of the extracellular environment. a. Schematic depicting Young's modulus of rodent and human brain. Hydrogel concentrations corresponding to the Young's modulus in kPa (gold) is contrasted to the standard procedure of Matrigel coating (blue). b. Changes in growth cone morphology in response to hydrogel stiffness: representative images of MGE progenitors derived from the null and CHRFAM7A KI lines. c. G-LISA demonstrating activation of small GTPases (top panel) on 2 kPa hydrogel; Rac1/CDC42 ratio (bottom panel) in MGE progenitors derived from the null (grey) and CHRFAM7A KI (orange) lines (n = 3; independent two-tailed T-test. Multiple testing correction was performed by Bonferroni). d. Atomic Force microscopy (AFM): intracellular stiffness of MGE progenitors derived from null (grey) and CHRFAM7A KI (orange) iPSC lines and seeded for 2 h on 0.03 and 0.1 stiffness hydrogels in the absence or presence of Rac1 inhibitor, EHT1864. Total of 50 cells were analyzed for each condition from 5 independent experiments. Averages were compared by an independent two-tailed T-test. Multiple testing correction was performed by Bonferroni. e. Representative images of β-III-tubulin immunofluorescent microscopy of null and CHRFAM7A KI isogenic iPSC derived MGE progenitors 48 h after plating on 0.03% and 0.1% hydrogels. f. Arborization of null (grey) and CHRFAM7A KI (orange) isogenic iPSC derived MGE progenitors on 0.03% and 0.1% hydrogels (left panel) (n = 3 independent experiments, 10 images of total 50 MGE progenitors counted; independent two-tailed T-test). g. Percentage of unipolar (Uni), Bipolar (Bi) and Multipolar (Multi) cells in the total population of MGE progenitors plated on the soft and stiff hydrogel (right panel) h. G-LISA of small GTPases CDC42, Rac1 and RhoA in null (grey) and CHRFAM7A KI (orange) isogenic iPSC derived MGE progenitors on 0.03% and 0.1% hydrogels (n = 3 independent experiments; independent two-tailed T-test). i. Representative images showing differences in axon guidance of MGE progenitors plated on 0.1% stiffness hydrogel. j. MMP2 and MMP9 gene expression levels of null (grey) and CHRFAM7A KI (orange) MGE progenitors upon exposure for 1 h to fibronectin coated stiff hydrogel (0.1%) in the absence or presence of Rac1 inhibitor, EHT1864. PCR data from 3 to 5 independent experiments are depicted as bar graphs with SD. Statistical analysis was performed by an independent two-tailed T-test.
Fig. 5
Fig. 5
CHRFAM7A effect on structure of the synapse. a. Schematic depicting dendritogenesis timeline and formation of synapsis (created with BioRender.com). b. Representative Synaptophysin and MAP2 confocal images demonstrating a difference in dendritic spinogenesis in neurons (D 30 after plating MGE progenitors) derived from null and CHRFAM7A KI lines. Quantification of number (c.) and area (d.) of synapsis on neurons derived from both lines. Statistical comparison was performed using the two-sample Kolmogorov–Smirnov test. Representative immunoblot (e.) and densitometric analysis (f.) of presynaptic (synaptophysin) and postsynaptic (PSD95) markers in a crude synaptosome fraction isolated from the null and CHRFAM7A KI iPSC derived neurons (n = 3 independent experiments, independent two-tailed T-test). g. Representative dendritic spine images of null and CHRFAM7A KI iPSC derived neurons. The neurons are stained with phalloidin followed by confocal microscopy and ImageJ processing. h. Dendritic spine length difference between the null UB068 (grey) and CHRFAM7A (orange). (N = 50 from 3 independent experiments, independent two-tailed T-test). i. Schematic depicting dendritic spine types and colour code for quantification (created with BioRender.com). j Quantification of dendritic spines in neurons derived from two iPSC lines. 20 images from 3 independent experiments. Statistical analysis was performed by non-parametric two-tailed Mann–Whitney test.

References

    1. Bitar M., Kuiper S., O'Brien E.A., Barry G. Genes with human-specific features are primarily involved withbrain, immune and metabolic evolution. BMC Bioinformatics. 2019;20(9):406. - PMC - PubMed
    1. Florio M., Namba T., Pääbo S., Hiller M., Huttner W.B. A single splice site mutation in human-specific ARHGAP11B causes basal progenitor amplification. Sci Adv. 2016;2(12) - PMC - PubMed
    1. Sinkus M.L., Graw S., Freedman R., Ross R.G., Lester H.A., Leonard S. The human CHRNA7 and CHRFAM7A genes: a review of the genetics, regulation, and function. Neuropharmacology. 2015;96(Pt B):274–288. - PMC - PubMed
    1. Swaminathan S., Huentelman M.J., Corneveaux J.J., et al. Analysis of copy number variation in Alzheimer's disease in a cohort of clinically characterized and neuropathologically verified individuals. PLoS One. 2012;7(12) - PMC - PubMed
    1. Lew A.R., Kellermayer T.R., Sule B.P., Szigeti K. Copy number variations in adult-onset neuropsychiatric diseases. Curr Genomics. 2018;19(6):420–430. - PMC - PubMed