Review
. 2023 Jul 24:15:101-112.
doi: 10.2147/EB.S384763. eCollection 2023.

Monitoring Eye Movement in Patients with Parkinson's Disease: What Can It Tell Us?

Affiliations
Review

Monitoring Eye Movement in Patients with Parkinson's Disease: What Can It Tell Us?

Yue Ran Sun et al. Eye Brain. .

Abstract

Parkinson's disease (PD) affects approximately 10 million individuals worldwide. Visual impairments are a common feature of PD. Patients report difficulties with visual scanning, impaired depth perception and spatial navigation, and blurry and double vision. Examination of PD patients reveals abnormal fixational saccades, strabismus, impaired convergence, and abnormal visually-guided saccades. This review aims to describe objective features of abnormal eye movements in PD and to discuss the structures and pathways through which these abnormalities may manifest.

Keywords: Parkinson’s disease; eye movement; gaze holding; saccades; strabismus; vergence.


Conflict of interest statement

The authors report no conflicts of interest in this work.

Figures

Figure 1
Figure 1
Eye position traces from a healthy control participant (A), and a PD patient (B). Composite vectors of horizontal and vertical eye positions are shown. Saccade amplitude (closed arrows, (A)) and intersaccadic interval (ISI, closed arrows, (A)) are the two metrics we used to characterize microsaccades including squarewaves. Microsaccades are depicted by an open arrow in (B); in several instances the microsaccades are followed by return eye movement comprising squarewave (closed arrow, (B)). ISI: Intersaccadic interval, deg: degrees, ms: millisecond. Adapted from Beylergil SB, Murray J, Noecker AM et al. Effects of subthalamic deep brain stimulation on fixational eye movements in Parkinson’s disease.J Comput Neurosci. 49(3):345–356, Springer Nature, 2021, permission from SNCSC.
Figure 2
Figure 2
Summary of microsaccade analyses. (A) Median saccade amplitudes of the individuals in DBS-off and DBS-on conditions. Asterisks indicate 6 patients showing a significant change due to DBS. (B) Normalized composite amplitude histograms of microsaccades of PD subjects who showed a significant decrease in saccade amplitude due to DBS. Histograms in DBS-on (red) and DBS-off (blue with black edges) conditions are plotted with the normalized frequency histogram of amplitude in healthy controls (HC; gray line). (C) Normalized composite amplitude histograms of microsaccades of PD subjects who showed a significant increase in saccade amplitude due to DBS. Histograms in DBS-on (red) and DBS-off (blue with no edge color) conditions are plotted with the normalized frequency histogram of amplitude in HC (gray line). (D) Normalized baseline (DBS-off) amplitudes of the two response groups that were shown in (B) (with black edge color) and (C) (no edge color). The asterisk indicates that the two distributions are statistically different. (E) Median intersaccadic interval (ISI) durations of the individuals in DBS-off and DBS-on conditions. Asterisks indicate the six patients who show a significant change in ISI due to DBS. (F) Normalized ISI histograms of PD subjects who showed a DBS-related decrease. Histograms in DBS-on (red) and DBS-off (blue with black edges) conditions are plotted with the normalized frequency histogram of amplitude in HC (gray line). (G) Normalized intersaccadic interval duration histograms of saccades of PD subjects who showed a DBS-related increase. Histograms in DBS-on (red) and DBS-off (blue with no edge color) conditions are plotted with the normalized frequency histogram of amplitude in HC (gray line). (H) Normalized baseline (DBS-off) ISI of the two response groups that were shown in (F) (with black edge color) and (G) (no edge color). The asterisk indicates that the two distributions are statistically different. Adapted from Beylergil SB, Murray J, Noecker AM et al. Effects of subthalamic deep brain stimulation on fixational eye movements in Parkinson’s disease. J Comput Neurosci. 49(3):345–356, Springer Nature, 2021, adapted with permission from SNCSC.
Figure 3
Figure 3
Schematic model of disparity and blur-driven vergence system. Each arm, one leading to vergence and the other leading to accommodation, is coupled to the other. There are four nodes of controllers. Blur controller and disparity controllers are upstream before cross-coupling occurs, while nodes “A” and “V” are downstream after cross-coupling has occurred. The upstream controllers are sensory while downstream nodes are motor. Known anatomical and physiological organization suggests that cerebral cortex and nucleus reticularis tegmenti pontis act as blur controller; fastigial and interpositus nucleus are disparity controller, node A is the Edinger-Westphal nucleus while node V is the supraoculomotor nucleus. Adapted with permission from Wolters Kluwer Health, Inc.: Gupta P, Beylergil S, Murray J et al. Effects of Parkinson Disease on Blur-Driven and Disparity-Driven Vergence Eye Movements. J Neuroophthalmol. 2021;41(4):442–451. Available from: https://journals.lww.com/jneuro-ophthalmology/Fulltext/2021/12000/Effects_of_Parkinson_Disease_on_Blur_Driven_and.4.aspx.
Figure 4
Figure 4
Comparison of disparity- and blur-driven vergence measured from PD patients and healthy controls. (A and B) The differences between right and left eyes (vergence) eye positions are plotted on the y-axis, corresponding time is plotted on the x-axis. The black line depicts the mean position in PD patients, while the blue line depicts the control subjects. The light shades (grey and light blue) depict the standard deviation of spread around the mean. (A) Depicts gaze shift in binocular viewing condition depicting disparity-driven vergence. (B) Depicts gaze shift in monocular viewing condition depicting blur-driven vergence. The overlapping values depict the lack of difference between healthy controls and PD patients in the case of blur-driven vergence. Readers are referred to Gupta et al 2021 for detailed patient demographics. Adapted with permission from Wolters Kluwer Health, Inc.: Gupta P, Beylergil S, Murray J et al. Effects of Parkinson Disease on Blur-Driven and Disparity-Driven Vergence Eye Movements. J Neuroophthalmol. 2021;41(4):442–451. Available from: https://journals.lww.com/jneuro-ophthalmology/Fulltext/2021/12000/Effects_of_Parkinson_Disease_on_Blur_Driven_and.4.aspx.
Figure 5
Figure 5
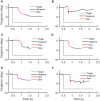
Different gaze-shifting strategies to compensate for disparity- and blur-driven vergence deficits in PD patients. The vergence position is plotted on y-axis while corresponding time is plotted on x-axis. Grey line depicts desired target position. Panels A-D depict strategies in binocular viewing: (A) pure slow, (B) pure fast, (C) slow fast, (D) fast slow. Panels E and F depict strategies in monocular viewing: (E) fast slow, (F) pure fast. Readers are referred to Gupta et al 2021 for detailed patient demographics. Adapted with permission from Wolters Kluwer Health, Inc.: Gupta P, Beylergil S, Murray J et al. Effects of Parkinson Disease on Blur-Driven and Disparity-Driven Vergence Eye Movements. J Neuroophthalmol. 2021;41(4):442–451. Available from: https://journals.lww.com/jneuro-ophthalmology/Fulltext/2021/12000/Effects_of_Parkinson_Disease_on_Blur_Driven_and.4.aspx.
Figure 6
Figure 6
Gaze-shift strategies utilized by healthy controls and PD patients. For healthy controls, (A and B) depict strategies in binocular viewing during (A) convergence and (B) divergence, while (C and D) depict strategies in monocular viewing during (C) convergence and (D) divergence. For PD patients, (E and F) depict strategies in binocular viewing during (E) convergence and (F) divergence, while (G and H) depict strategies in monocular viewing during (G) convergence and (H) divergence. Readers are referred to Gupta et al 2021 for detailed patient demographics. Adapted with permission from Wolters Kluwer Health, Inc.: Gupta P, Beylergil S, Murray J et al. Effects of Parkinson Disease on Blur-Driven and Disparity-Driven Vergence Eye Movements. J Neuroophthalmol. 2021;41(4):442–451. https://journals.lww.com/jneuro-ophthalmology/Fulltext/2021/12000/Effects_of_Parkinson_Disease_on_Blur_Driven_and.4.aspx.
Figure 7
Figure 7
Examples of visually guided saccades from healthy subject (A-C) and PD patient (G-I). The black line depicts the right eye, and the grey trace depicts the left eye. In the first row of subplots, the eye position is plotted on the y-axis while the x-axis depicts the corresponding time in seconds. (A) Illustrates a normal visually-guided vertical saccade from a healthy subject. (D and G) Depict examples of visually-guided (D) vertical and (G) horizontal saccades from the same PD subject. Red arrows depict interruption in ongoing saccades. The middle row of subplots depicts eye velocity; eye velocity is plotted on the y-axis while the x-axis illustrates the corresponding time. (B) Depicts the eye velocity of a normal visually-guided saccade recorded from a healthy subject, while (E and H) depict vertical and horizontal eye velocity respectively from a PD patient. Red arrows illustrate the interruptions in a saccade when the eye velocity was zero (H) or when the eye moved at slower velocity in the opposite direction (E). The bottom row of the subplots depict trajectories of horizontal and vertical saccades; the green dot is start point, and the red dot is the stop point. (C) Depicts normal saccade from the healthy subject, while panel F and I depict (F) vertical and (I) horizontal saccades in a PD patient. Arrows in (F) highlight curvature in the saccade trajectory. Adapted from Prog Brain Res. 249, Shaikh AG, Ghasia FF. Saccades in Parkinson’s disease: Hypometric, slow, and maladaptive. 81–94, Copyright 2019, with permission from Elsevier.

Similar articles

Cited by

References

    1. Parkinson’s Foundation. Statistics; 2023. Available from: https://www.parkinson.org/understanding-parkinsons/statistics. Accessed Jun 1, 2023.
    1. Almer Z, Klein KS, Marsh L, Gerstenhaber M, Repka MX. Ocular Motor And Sensory Function In Parkinson’s disease. Ophthalmology. 2012;119(1):178–182. doi:10.1016/j.ophtha.2011.06.040 - DOI - PMC - PubMed
    1. Armstrong RA. Oculo-visual dysfunction in Parkinson’s disease. J Parkinson’s Dis. 2015;5(4):715–726. doi:10.3233/jpd-150686 - DOI - PMC - PubMed
    1. Antoniades CA, Demeyere N, Kennard C, Humphreys GW, Hu MT. Antisaccades and executive dysfunction in early drug-naive Parkinson’s disease: the discovery study. Mov Disord. 2015;30(6):843–847. doi:10.1002/mds.26134 - DOI - PubMed
    1. Lepore FE. Parkinson’s Disease and Diplopia. Neuro-Ophthalmology. 2006;30(2–3):37–40. doi:10.1080/01658100600742838 - DOI