

Oridonin impedes breast cancer growth by blocking cells in S phase and inhibiting the PI3K/AKT/mTOR signaling pathway
- PMID: 37519735
- PMCID: PMC10372243
- DOI: 10.1016/j.heliyon.2023.e18046
Oridonin impedes breast cancer growth by blocking cells in S phase and inhibiting the PI3K/AKT/mTOR signaling pathway
Abstract
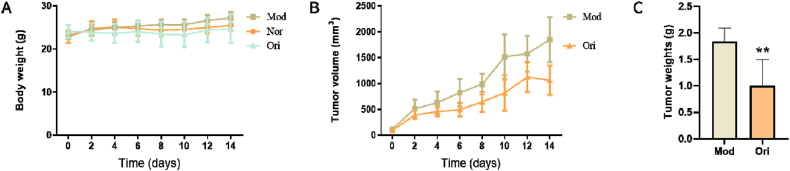
Breast cancer is one of the most common cancers. Oridonin, a traditional Chinese medicine, is believed to inhibit tumor growth, but its particular effects on breast cancer remain unknown. In this study, we examined oridonin's effects on 4T1, MCF-7, and MDAMB-231 cellular activity using CCK8. Scratch assays were used to detect oridonin's effects on cellular migration. Oridonin's effects on the breast cancer cell cycle were studied using flow cytometry, and expression of cell cycle related proteins p53, CDK2, and p21 was detected using Western blot assays. Metabolomics assays were used to detect changes in small molecule metabolites and metabolic pathways in breast cancer cells after treatment with oridonin. Oridonin's effects on breast cancer growth were also studied using xenograft mice. Metabolomics assays were used to detect changes in metabolites and metabolic pathways in xenograft mouse plasma in a control group, model group, and drug administration group. Experimental results showed that oridonin could significantly inhibit breast cancer growth both in vivo and in vitro. Scratch experiments showed that oridonin could inhibit breast cancer cell migration. Oridonin was also able to arrest cells in S phase by affecting several cell cycle-related proteins, including p53, CDK2, and p21. Metabolomic analysis of 4T1 cells identified a total of 33 differential metabolites, including multiple amino acids (such as l-Glutamic acid, l-Asparagine, l-Histidine, l-Valine, and l-Isoleucine). KEGG pathway enrichment analysis showed significant changes in aminoacyl-tRNA biosynthesis, and in multiple amino acid metabolic pathways. Plasma metabolomic analyses of xenograft mice revealed 28 differentially-expressed metabolites between the different animal model groups, including multiple amino acids. KEGG pathway analysis showed significant alterations in multiple amino acid metabolic pathways in oridonin-treated mice. Additionally, changes in the expression of PI3K, AKT and mTOR proteins, as well as in branched amino acids, suggest that oridonin affects the PI3K/AKT/mTOR signaling pathway by inhibiting the biosynthesis of valine, leucine and isoleucine. Taken together, our results suggest that oridonin has strong anti-tumor activity in vitro and in vivo, and has potential as an adjuvant to breast cancer treatment regimens.
Keywords: Amino acid metabolism; Breast cancer; Metabolomics; Oridonin; PI3K/AKT/mTOR signaling pathway.
© 2023 The Authors. Published by Elsevier Ltd.
Conflict of interest statement
The authors declare that they have no known competing financial interests or personal relationships that could have appeared to influence the work reported in this paper.
Figures


References
-
- Kumar P., Aggarwal R. An overview of triple-negative breast cancer. Archives of gynecology and obstetrics. Arch. Gynecol. Obstet. 2016;293(2):247–269. - PubMed
-
- Maughan K.L., et al. Treatment of breast cancer. American family physician. Am. Fam. Physician. 2010;81(11):1339–1346. - PubMed
-
- Medema J.P., Vermeulen L. Microenvironmental regulation of stem cells in intestinal homeostasis and cancer. Nature. 2011;474(7351):318–326. - PubMed
-
- Xiong H. Study on modern pharmacological and chemical components and clinical medication of Isodon rubescens. Inner Mongolia traditional. Chin. Med. 2014;33(22):2.
LinkOut - more resources
Full Text Sources
Research Materials
Miscellaneous
