

Assessment of soil respiration process in a mangrove swamp of Panama's Bay
- PMID: 37519757
- PMCID: PMC10372315
- DOI: 10.1016/j.heliyon.2023.e18189
Assessment of soil respiration process in a mangrove swamp of Panama's Bay
Abstract
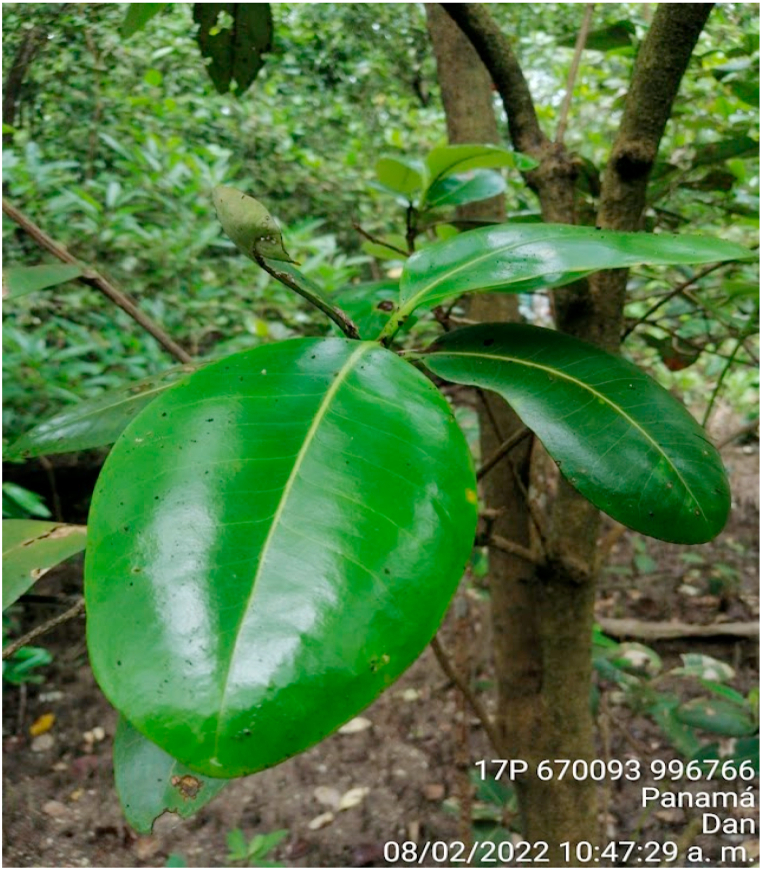
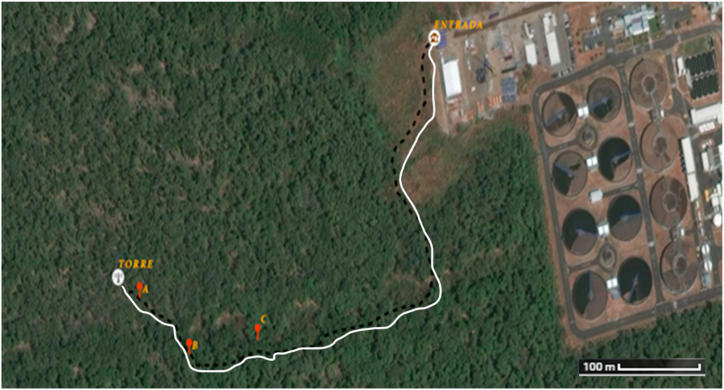
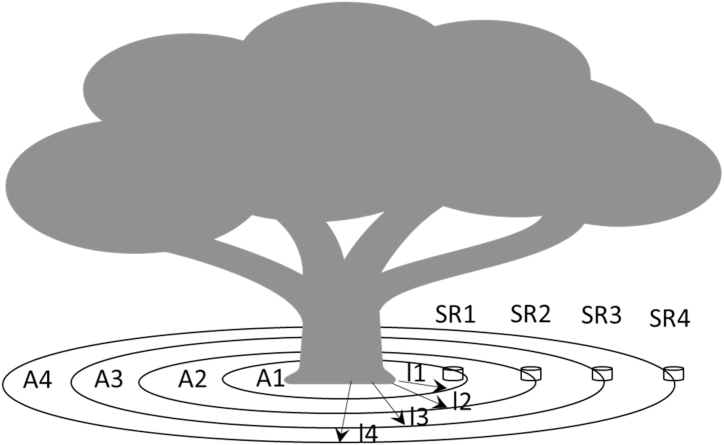
Studies reveal that mangroves have the ability to store underground carbon more than a tropical forest, and this function is classified as the second most important to mitigate the effects of climate change. However, part of the carbon fixed returns to the atmosphere, and this is done through soil respiration. The present study seeks to quantify the total soil efflux (a subrogate of total soil respiration) that includes both autotrophic and heterotrophic soil efflux, emitted by a Panama's mangrove swamp, as well as to investigate what drivers are important. Firstly, 3 plots were established with predominant mangroves species, such as salty mangrove tree (Avicennia bicolor Standl.) and black mangrove tree (Avicennia germinans L.). Secondly, a forest inventory was carried out in one ha, resulting in 371 trees ha-1, where the salty mangrove tree prevailed with 219 individuals in front of the black mangrove tree, with 152 trees. In addition, tree level measurements were performed such as diameter at breast height (DBH), crown diameter and distance between trees. Third, using a Licor 6400XT infrared gas analyzer system and a meteorological tower, soil CO2 fluxes and air and soil temperature were measured respectively. Results showed a total of 33.61 t of CO2 ha-1 emitted by the soil of the mangrove in 3.5 months.
Keywords: CO2 flux; Climate change; Coast of Panama; Land flow; Linear multiple regression; Wetlands.
© 2023 Published by Elsevier Ltd.
Conflict of interest statement
The authors declare that they have no known competing financial interests or personal relationships that could have appeared to influence the work reported in this paper
Figures


References
-
- González Gaudiano E.J., Meira Cartea P.Á. Educación para el cambio climático ¿Educar sobre el clima o para el cambio? Perfiles Educ. 2020;42(168):157–174. http://www.scielo.org.mx/pdf/peredu/v42n168/0185-2698-peredu-42-168-157.pdf Recuperado el 17 de Febrero de 2022. de.
-
- Trespalacios J., Blanquicett C., Carrillo P. Gases y efecto invernadero. 2018. https://www.academia.edu/38002440/Gases_y_efecto_invernadero Instituto Desarrollo Sostenible. Escuela Internacional de Doctorado. Universidad del Norte. SENA. Basilea-Suiza: DSTO. Obtenido de.
-
- ANAM-ARAP . In: Manglares de Panamá: importancia. mejores prácticas y regulaciones vigentes. Primera ed. Tarté A., editor. Novo Art. S.A; Panamá: 2013. https://online.fliphtml5.com/eebm/lojx/ Obtenido de.
-
- MIAMBIENTE y PNUD . República de Panamá: Ministerio Federal de Medio Ambiente; 2017. Protocolo para medición de carbono en ecosistemas de manglar en Panamá.
-
- Boone Kauffman J., Donato D.C., Adame M.F. CIFOR; Idonesia: 2013. Protocolo para la medición. monitoreo y reporte de la estructura. biomasa y reservas de carbono de los manglares.
LinkOut - more resources
Full Text Sources
Research Materials
Miscellaneous
