. 2023 Jul 14:13:1182944.
doi: 10.3389/fonc.2023.1182944. eCollection 2023.

Prognostic scoring system based on eosinophil- and basophil-related markers for predicting the prognosis of patients with stage II and stage III colorectal cancer: a retrospective cohort study

Affiliations

Prognostic scoring system based on eosinophil- and basophil-related markers for predicting the prognosis of patients with stage II and stage III colorectal cancer: a retrospective cohort study

Lijing Gao et al. Front Oncol. .

Abstract

Background: Systemic inflammation is associated with the prognosis of colorectal cancer (CRC). The current study aimed to construct a comprehensively inflammatory prognostic scoring system named risk score (RS) based on eosinophil- and basophil-related markers and assess its prognostic value in patients with stage II and stage III CRC.

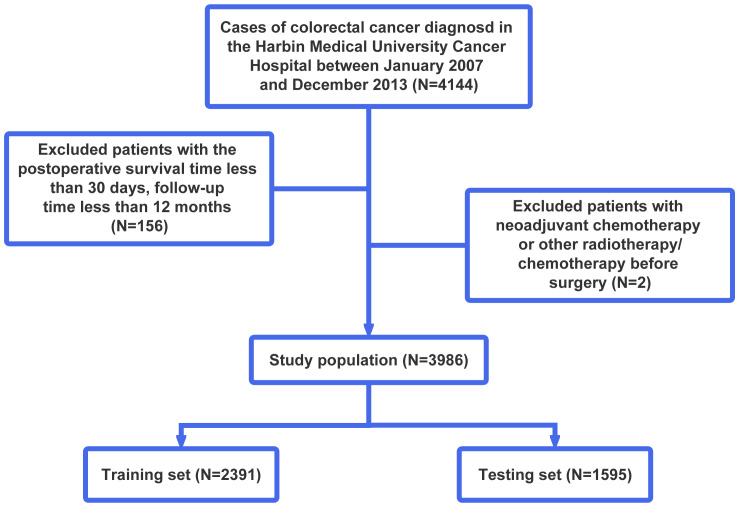
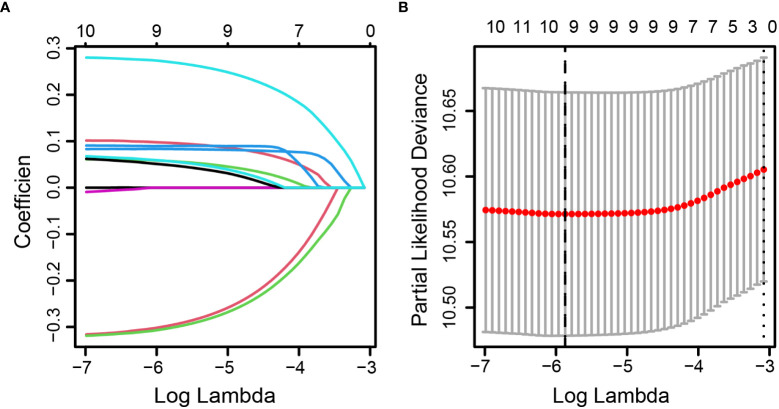
Patients and methods: A total of 3,986 patients were enrolled from January 2007 to December 2013. The last follow-up time was January 2019. They were randomly assigned to the training set and testing set in a 3:2 split ratio. Least absolute shrinkage and selection operator (LASSO)-Cox regression analysis was performed to select the optimal prognostic factors in the construction of RS. The Kaplan-Meier curve, time-dependent receiver operating characteristic (ROC), and Cox analysis were used to evaluate the association between RS and overall survival (OS).

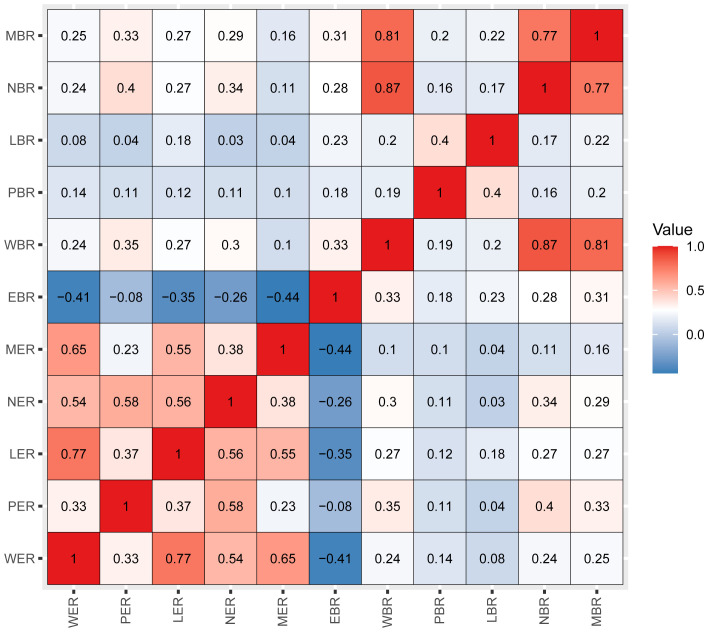
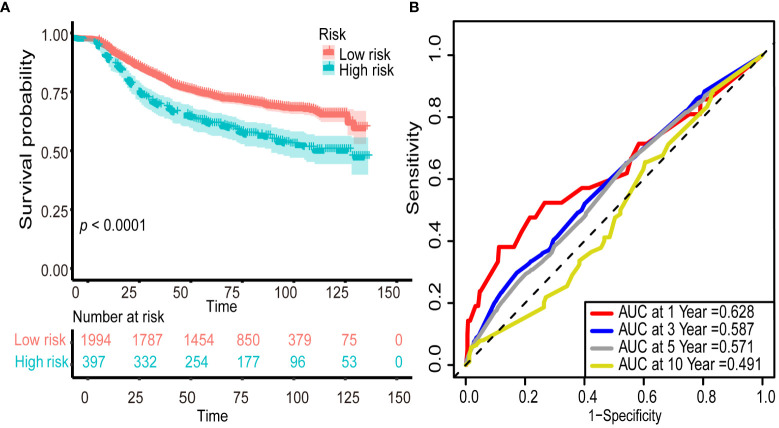
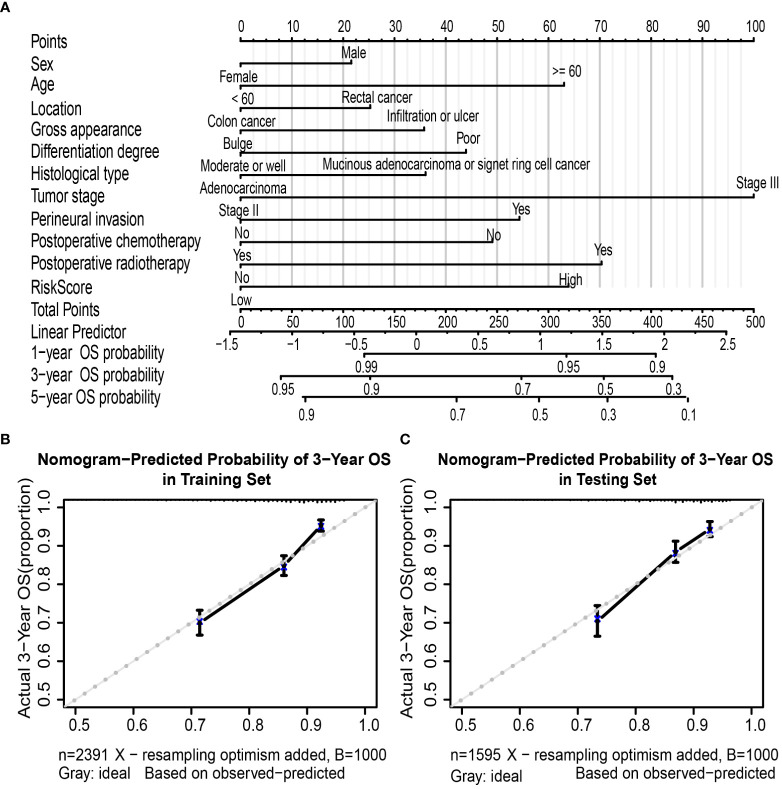
Results: In the training set, all inflammatory markers showed certain prognostic values. Based on LASSO-Cox analysis, nine markers were integrated to construct RS. The Kaplan-Meier curve showed that a higher RS (RS > 0) had a significantly worse prognosis (log-rank p< 0.0001). RS (>0) remained an independent prognostic factor for OS (hazard ratio (HR): 1.70, 95% confidence interval (CI), 1.43-2.03, p< 0.001). The prognostic value of RS was validated in the entire cohort. Time-dependent ROC analysis showed that RS had a stable prognostic effect throughout the follow-up times and could enhance the prognostic ability of the stage by combination. Nomogram was established based on RS and clinicopathological factors for predicting OS in the training set and validated in the testing set. The area under the curve (AUC) values of the 3-year OS in the training and testing sets were 0.748 and 0.720, respectively. The nomogram had a satisfactory predictive accuracy and had better clinical application value than the tumor stage alone.

Conclusions: RS might be an independent prognostic factor for OS in patients with stage II and III CRC, which is helpful for risk stratification of patients. Additionally, the nomogram might be used for personalized prediction and might contribute to formulating a better clinical treatment plan.

Keywords: basophils; biomarker; colorectal cancer; eosinophils; inflammation; prognosis; risk score.


Conflict of interest statement

The authors declare that the research was conducted in the absence of any commercial or financial relationships that could be construed as a potential conflict of interest.

Figures

Figure 1
Figure 1
Flowchart of patient selection. According to the exclusion criteria, a total of 3,986 patients were included in this study, and they were randomly allocated into the training and testing sets in a 3:2 ratio.
Figure 2
Figure 2
Pearson’s correlation coefficients among the 11 inflammatory markers. Blue indicates negative correlation, and red indicates positive correlation. Darker colors are associated with stronger correlation coefficients. WER, white blood cell-to-eosinophil ratio; PER, platelet-to-eosinophil ratio; LER, lymphocyte-to-eosinophil ratio; NER, neutrophil-to-eosinophil ratio; MER, monocyte-to-eosinophil ratio; EBR, eosinophil-to-basophil ratio; WBR, white blood cell-to-basophil ratio; PBR, platelet-to-basophil ratio; LBR, lymphocyte-to-basophil ratio; NBR, neutrophil-to-basophil ratio; MBR, monocyte-to-basophil ratio.
Figure 3
Figure 3
Identification of optimal inflammatory markers in colorectal cancer patients. Selection of optimal inflammatory markers in the LASSO model (A). Tenfold cross-validation for tuning parameter (λ) selection in the LASSO model (B). The dotted vertical lines were drawn at the optimal values using the maximum criteria and the one standard error of the maximum criteria. LASSO, least absolute shrinkage and selection operator.
Figure 4
Figure 4
Predictive overall survival performance of risk score using Kaplan–Meier survival curve and time-dependent ROC analysis. The Kaplan–Meier survival curve showed that the overall survival probability in the low-risk group was significantly higher than that in the high-risk group (log-rank p< 0.0001; (A). The prognostic accuracy of risk score was evaluated by the time-dependent ROC, yielding AUC values with 1-, 3-, 5-, and 10-year overall survival rates in the training set (B). ROC, receiver operating characteristic; AUC, area under the curve.
Figure 5
Figure 5
Nomogram to predict OS in colorectal cancer patients. Nomogram was performed by using risk score and clinical characteristics for predicting OS (A). Calibration curves of the nomogram to predict OS at 3 years in the training set (B) and the testing set (C). Nomogram can be interpreted by assigning points to each clinicopathological characteristic and risk score of patients at the top line and then summing up the points to predict the 1-, 3-, and 5-year OS probability of patients with CRC. Calibration curve; the y-axis represents the actual OS proportion, and the x-axis represents the nomogram-predicted probability of OS. The reference line is 45° and represents a perfect calibration by an ideal model. OS, overall survival; CRC, colorectal cancer.

Similar articles

Cited by

References

    1. Sung H, Ferlay J, Siegel R, Laversanne M, Soerjomataram I, Jemal A, et al. . Global cancer statistics 2020: GLOBOCAN estimates of incidence and mortality worldwide for 36 cancers in 185 countries. CA Cancer J Clin (2021) 71(3):209–49. doi: 10.3322/caac.21660 - DOI - PubMed
    1. Siegel RL, Miller KD, Jemal A. Cancer statistics, 2019. CA Cancer J Clin (2019) 69:7–34. doi: 10.3322/caac.21551 - DOI - PubMed
    1. Chen W, Zheng R, Baade PD, Zhang S, Zeng H, Bray F, et al. . Cancer statistics in China, 2015. CA Cancer J Clin (2016) 66:115–32. doi: 10.3322/caac.21338 - DOI - PubMed
    1. Miller KD, Nogueira L, Mariotto AB, Rowland JH, Yabroff KR, Alfano CM, et al. . Cancer treatment and survivorship statistics, 2019. CA Cancer J Clin (2019) 69:363–85. doi: 10.3322/caac.21565 - DOI - PubMed
    1. DeSantis CE, Lin CC, Mariotto AB, Siegel RL, Stein KD, Kramer JL, et al. . Cancer treatment and survivorship statistics, 2014. CA Cancer J Clin (2014) 64:252–71. doi: 10.3322/caac.21235 - DOI - PubMed

LinkOut - more resources