. 2023 Jul 14:14:1114749.
doi: 10.3389/fgene.2023.1114749. eCollection 2023.

A protein-coding gene expression atlas from the brain of pregnant and non-pregnant goats

Affiliations

A protein-coding gene expression atlas from the brain of pregnant and non-pregnant goats

María Gracia Luigi-Sierra et al. Front Genet. .

Abstract

Background: The brain is an extraordinarily complex organ with multiple anatomical structures involved in highly specialized functions related with behavior and physiological homeostasis. Our goal was to build an atlas of protein-coding gene expression in the goat brain by sequencing the transcriptomes of 12 brain regions in seven female Murciano-Granadina goats, from which three of them were 1-month pregnant. Results: Between 14,889 (cerebellar hemisphere) and 15,592 (pineal gland) protein-coding genes were expressed in goat brain regions, and most of them displayed ubiquitous or broad patterns of expression across tissues. Principal component analysis and hierarchical clustering based on the patterns of mRNA expression revealed that samples from certain brain regions tend to group according to their position in the anterior-posterior axis of the neural tube, i.e., hindbrain (pons and medulla oblongata), midbrain (rostral colliculus) and forebrain (frontal neocortex, olfactory bulb, hypothalamus, and hippocampus). Exceptions to this observation were cerebellum and glandular tissues (pineal gland and hypophysis), which showed highly divergent mRNA expression profiles. Differential expression analysis between pregnant and non-pregnant goats revealed moderate changes of mRNA expression in the frontal neocortex, hippocampus, adenohypophysis and pons, and very dramatic changes in the olfactory bulb. Many genes showing differential expression in this organ are related to olfactory function and behavior in humans. Conclusion: With the exception of cerebellum and glandular tissues, there is a relationship between the cellular origin of sampled regions along the anterior-posterior axis of the neural tube and their mRNA expression patterns in the goat adult brain. Gestation induces substantial changes in the mRNA expression of the olfactory bulb, a finding consistent with the key role of this anatomical structure on the development of maternal behavior.

Keywords: RNA-Seq; differential gene expression (DGE); embryonic vesicle; encephalon; gestation; goat.


Conflict of interest statement

The authors declare that the research was conducted in the absence of any commercial or financial relationships that could be construed as a potential conflict of interest.

Figures
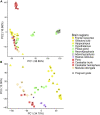
FIGURE 1
FIGURE 1
Principal component analysis (PCA) of samples from 12 goat brain regions. (A) Principal component analysis (PCA) of samples from 12 brain regions (adenohypophysis, cerebellar hemisphere, cerebellar trunk, frontal neocortex, hippocampus, hypothalamus, medulla oblongata, neurohypophysis, pineal gland, pons, olfactory bulb and rostral colliculus) retrieved from seven Murciano-Granadina female goats. (B) Same PCA without samples from adenohypophysis, cerebellar hemisphere, cerebellar trunk/peduncle, neurohypophysis, and pineal gland. Samples obtained from pregnant goats have been marked with a black dot.
FIGURE 2
FIGURE 2
Hierarchical clustering of samples from 12 brain regions retrieved from seven Murciano-Granadina goats based on their mRNA expression profiles. Dendrogram displaying the clustering patterns of samples from 12 brain regions. In most cases, samples cluster according to their region of origin and, moreover, regional clusters tend to group according to the forebrain, midbrain or hindbrain embryonic vesicle they originate from. Exceptions to this general observation are hypothalamus, that groups with rostral colliculus, and two main groups of outliers: cerebellum and glandular tissues (pineal gland and hypophysis). In the right part of the figure, we indicate the embryonic vesicle from which each region is derived. In an initial developmental stage of mammals, three forebrain (prosencephalon), midbrain (mesencephalon) and hindbrain (rhombencephalon) vesicles are formed. Subsequently, prosencephalon is subdivided into two further vesicles (telencephalon and diencephalon) and so does rhombencephalon (metencephalon and myelencephalon). Adenohypophysis does not originate from any of these five vesicles, but from the oral ectoderm. Samples obtained from pregnant goats have been marked with a black triangle on the side.
FIGURE 3
FIGURE 3
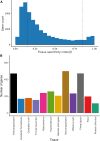
Tissue specificity of protein-coding genes expressed in 12 goat brain regions. (A) Histogram representing the tissue specificity of 17,054 protein-coding genes expressed in 12 goat brain regions (in at least one sample) and surpassing QC filters. The number of genes is indicated in the y-axis, while Tau specificity scores (τ, see Materials and Methods for details) are shown in the x-axis. The dashed line indicates = 0.85 threshold that defines tissue-specificity. (B) Number of genes with tissue-specific expression (τ > 0.85) in each of the 12 brain regions under study.
FIGURE 4
FIGURE 4
Volcano plots of differentially expressed genes in eleven brain regions when comparing pregnant and non-pregnant goats. (A) Brain regions little affected by pregnancy, i.e., cerebellar hemisphere, cerebellar trunk/peduncle, hypothalamus, medulla oblongata, neurohypophysis and rostral colliculus. (B) Brain regions moderately or strongly affected by pregnancy, i.e., adenohypophysis, frontal neocortex, hippocampus, olfactory bulb, and pons. Genes with a fold change below -1.5 and a q-value below 0.05 are depicted in blue, while genes with a fold change over 1.5 and a q-value < 0.05 are depicted in red. Grey dots represent genes that do not display differential expression.

References

    1. Abdul H. M., Sama M. A., Furman J. L., Mathis D. M., Beckett T. L., Weidner A. M., et al. (2009). Cognitive decline in Alzheimer’s disease is associated with selective changes in calcineurin/NFAT signaling. J. Neurosci. 29, 12957–12969. 10.1523/jneurosci.1064-09.2009 - DOI - PMC - PubMed
    1. Angoa-Pérez M., Kane M. J., Sykes C. E., Perrine S. A., Church M. W., Kuhn D. M. (2014). Brain serotonin determines maternal behavior and offspring survival. Genes. Brain Behav. 13, 579–591. 10.1111/gbb.12159 - DOI - PMC - PubMed
    1. Arbeitman M. N. (2019). Maternal experience leads to lasting gene expression changes in some regions of the mouse brain. G3 Genes., Genomes, Genet. 9, 2623–2628. 10.1534/g3.119.400249 - DOI - PMC - PubMed
    1. Ardlie K. G., DeLuca D. S., Segrè A. v., Sullivan T. J., Young T. R., Gelfand E. T., et al. (2015). Human genomics. The genotype-tissue expression (GTEx) pilot analysis: Multitissue gene regulation in humans. Science 348, 648–660. 10.1126/science.1262110 - DOI - PMC - PubMed
    1. Balmer C. W., Lamantia A. S. (2004). Loss of Gli3 and Shh function disrupts olfactory axon trajectories. J. Comp. Neurology 472, 292–307. 10.1002/cne.20053 - DOI - PubMed

LinkOut - more resources