. 2023 Jul 3;26(7):107259.
doi: 10.1016/j.isci.2023.107259. eCollection 2023 Jul 21.

Internal selective attention is delayed by competition between endogenous and exogenous factors

Affiliations

Internal selective attention is delayed by competition between endogenous and exogenous factors

Edward F Ester et al. iScience. .

Abstract

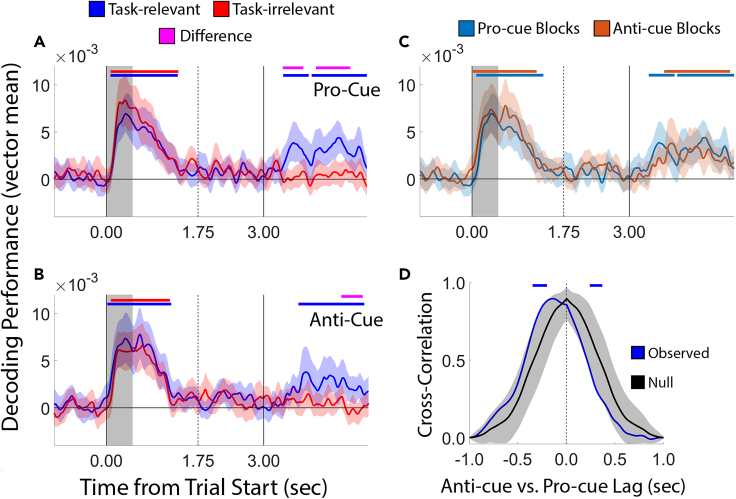
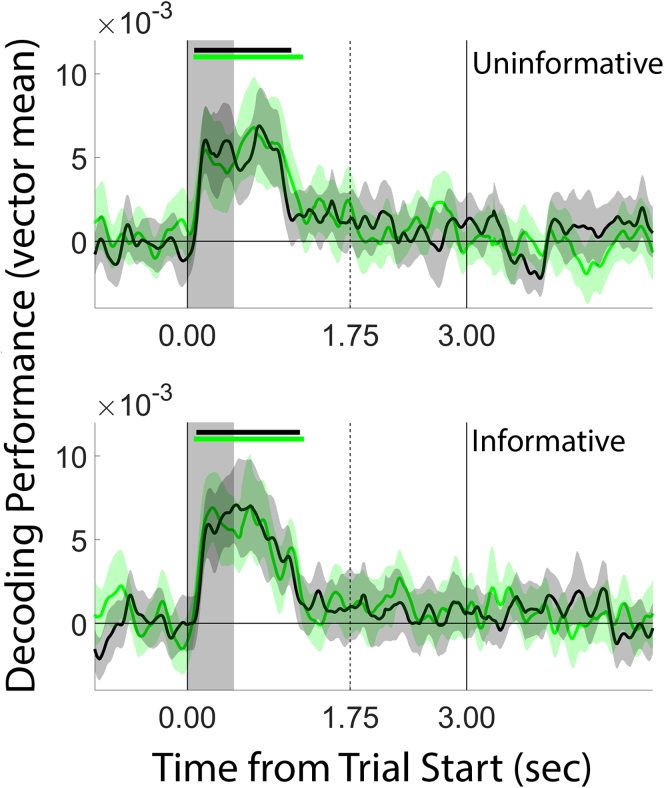
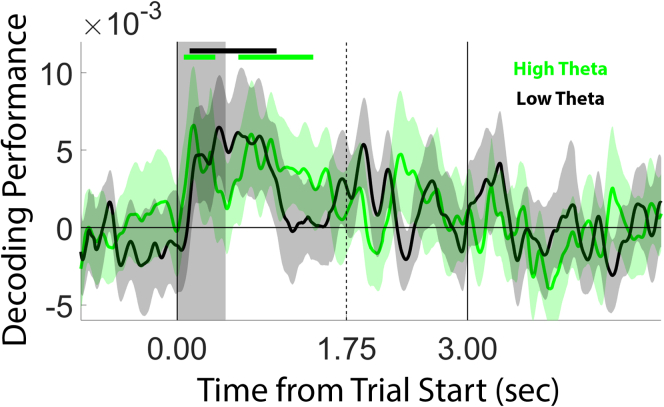
External attention is mediated by competition between endogenous (goal-driven) and exogenous (stimulus-driven) factors, with the balance of competition determining which stimuli are selected. Occasionally, exogenous factors "win" this competition and drive the selection of task-irrelevant stimuli. Endogenous and exogenous selection mechanisms may also compete to control the selection of internal representations (e.g., those stored in working memory), but whether this competition is resolved in the same way as external attention is unknown. Here, we leveraged the high temporal resolution of human EEG to determine how competition between endogenous and exogenous factors influences the selection of internal representations. Unlike external attention, competition did not prompt the selection of task-irrelevant working memory content. Instead, it delayed the endogenous selection of task-relevant working memory content by several hundred milliseconds. Thus, competition between endogenous and exogenous factors influences internal selective attention, but in a different way than external selective attention.

Keywords: Behavioral neuroscience; Cognitive neuroscience; Sensory neuroscience; Signal processing.


Conflict of interest statement

The authors declare no competing interests.

Figures

None
Graphical abstract
Figure 1
Figure 1
Retro-cue task and memory performance (A) Participants remembered the locations of two discs over a blank delay. Each disc could appear at one of eight positions along the perimeter of an imaginary circle centered at fixation (upper right panel). (B) Effects of cue type (informative, uninformative) and task type (pro-cue, anti-cue) on average absolute recall errors. (C) We estimated the effects of exogenous factors on recall performance by computing the difference between informative pro-cue trials (i.e., where endogenous and exogenous factors are aligned) and informative anti-cue trials (i.e., where endogenous and exogenous factors are opposed). We estimated the effects of endogenous factors on recall performance by computing the difference between informative pro-cue trials and uninformative pro-cue trials minus the estimated effect of exogenous factors (see text for specifics). Identical analyses were also applied to participants response times (D and E). Error bars depict the 95% confidence interval of the mean.
Figure 2
Figure 2
Frontal theta power is greater during the anti-versus pro-cue task, reflecting a greater need for cognitive control (A) Time-resolved differences in pro- and anti-cue theta power computed from frontal electrode sites. Theta power estimates were larger during the anti-versus pro-cue task beginning approximately 600 ms after cue onset. Shaded regions depict the 95% confidence interval of the mean. Vertical solid lines at times 0.00 and 3.00 depict the onset of the sample and recall displays, respectively; the vertical dashed line at time 1.75 depicts the onset of an informative retro-cue. The horizontal black bar at the top of the plot marks periods where the difference between anti- and pro-cue theta power was significantly greater than zero (cluster-based permutation tests; see STAR Methods). (B) Difference in theta-power (4–7 Hz) scalp topography during the pro- and anti-cue tasks. Pro- and anti-cue theta power estimates were averaged over a period spanning 2.5–3.0 s after trial start (i.e., 750–1250 ms after cue onset). Electrode-wise power estimates during the pro-cue task were subtracted from corresponding estimates during the anti-cue task, i.e., larger values indicate higher theta power during the anti-versus pro-cue task. (C) Task-level differences in power were absent from frequency bands adjacent to theta, including delta (1–3 Hz) and alpha (8–13 Hz).
Figure 3
Figure 3
Location decoding performance during uninformative trials (A and B) Decoding performance for task-relevant and task-irrelevant locations during pro-cue and anti-cue blocks, respectively. (C) Overlay of task-relevant location decoding performance for pro-cue and anti-cue blocks (i.e., the blue lines in panels (A and B)). Solid vertical lines at time 0.00 and 3.00 depict the onset of the sample and probe displays, respectively. The dashed vertical line at time 1.75 depicts the onset of the (uninformative) retro-cue. Gray shaded region spanning 0.00–0.50 marks the duration of the sample display. Horizontal bars at the top of each plot mark intervals where decoding performance was significantly greater than zero (nonparametric cluster-based randomization test; see STAR Methods) or intervals where decoding performance for one location was significantly greater than decoding performance for the other location. Shaded regions around each line depict bootstrapped confidence intervals of the mean. (D) Cross-correlation analysis showing a significant delay in the onset of above-chance probe-locked task-relevant decoding performance during the anti-versus pro-cue task. The null distribution was obtained by repeating the cross-correlation analysis 10,000 times while randomizing participant-level condition labels (i.e., randomly switching the pro- and anti-cue labels). Horizontal bars at the top of the plot depict intervals where the observed cross-correlation coefficient was significantly greater than that expected by chance.
Figure 4
Figure 4
Location decoding performance during informative trials (A and B) Decoding performance for task-relevant and task-irrelevant locations during pro-cue and anti-cue blocks, respectively. (C) Overlay of task-relevant location decoding performance for pro-cue and anti-cue blocks (i.e., the blue lines in panels (A and B)). (D) Cross-correlation analysis showing a significant delay in the onset of above-chance probe-locked task-relevant decoding performance during the anti-versus pro-cue task. All conventions are identical to Figure 3.
Figure 5
Figure 5
Support vector machine-based decoding of stimulus position To ensure the generality of our findings (e.g., Figure 4), we decoded the positions of the task-relevant and -irrelevant discs during the pro-cue task (A and C) and the anti-cue task (B and C). Plotting conventions are identical to Figure 4. We did not perform a cross-correlation analysis due to the absence of above-chance decoding of the cue-matching but task-relevant stimulus during the anti-cue task.
Figure 6
Figure 6
Inverted encoding model analysis (A–C) We modeled patterns of alpha-band activity at each electrode site as a weighted combination of eight position filters, each with an idealized tuning curve. Filter weights from each electrode were used to reconstruct a representation of remembered position(s) in an independent test dataset. Conventions are identical to Figure 4.
Figure 7
Figure 7
Event-related potentials reveal delayed selection of task-relevant WM content during the anti-cue task (A) Average contralateral and ipsilateral ERP waveforms during the pro-cue task, time-locked to trial start (0.00 s). The vertical lines at times 1.75 and 3.00 s depict the onset of the retro-cue and probe displays, respectively. The shaded region depicts the duration of the sample display. (B) Identical to (A), but for the anti-cue task. (C) Difference waves (i.e., contralateral-ipsilateral) time locked to retro-cue onset (time 0 ms). The shaded region spanning 200–300 ms depicts the canonical N2pc window. Horizontal bars at the top of the plot mark epochs where difference wave voltage was significantly greater than chance (red bar) or when anti-cue difference wave voltage was significantly greater than pro-cue difference wave voltage (maroon bar). Shaded regions depict the 95% confidence interval of the mean. (D) N2pc amplitudes, defined as the average difference wave voltage over a period spanning 200–300 ms after cue onset. Error bars depict the 95% confidence interval of the mean; ∗, p < 0.05, bootstrap test.
Figure 8
Figure 8
Split-half analysis of task-irrelevant decoding performance during the anti-cue task To examine whether exogenous selection of the task-irrelevant disc during anti-cue blocks was obscured by trial averaging, we sorted task-irrelevant decoding performance during uninformative (top) and informative (bottom) trials by participants’ recall errors. We reasoned that because exogenous factors have a deleterious effect on participants’ recall errors (Figure 1C), exogenous selection of the task-irrelevant disc – as indexed by higher task-irrelevant decoding performance – should be more evident during high recall error trials (black lines) than low recall error trials (green lines). However, we observed no evidence for above-chance task-irrelevant decoding performance in any of the conditions we examined. Plotting conventions are identical to those in Figure 4.
Figure 9
Figure 9
Task-irrelevant decoding performance during the anti-cue task sorted by frontal theta power Conventions are identical to Figure 4B.
Figure 10
Figure 10
Delayed improvements in task-relevant decoding performance during the anti-cue task cannot be explained by order effects We tested whether delayed improvements in task-relevant decoding performance during the anti-cue (versus pro-cue) task were caused by order effects by splitting decoding performance across participants who performed the anti-cue task followed by the pro-cue task (green) or vice versa (maroon). If anything, above-chance decoding performance was reached earlier for participants who completed the pro-cue followed by the anti-cue tasks, though this effect was not significant (p = 0.141; randomization test).
Figure 11
Figure 11
Stimulus position cannot be decoded from frontal alpha-band activity Conventions are identical to Figures 4A and 4B.

References

    1. D’Esposito M., Postle B.R. The cognitive neuroscience of working memory. Annu. Rev. Psychol. 2015;66:115–142. - PMC - PubMed
    1. van Ede F., Nobre A.C. Turning attention inside-out: How working memory serves behavior. Annu. Rev. Psychol. 2023;74:137–165. - PubMed
    1. Chun M.M., Golomb J.D., Turk-Browne N.B. A taxonomy of external and internal attention. Annu. Rev. Psychol. 2011;62:73–101. - PubMed
    1. Chatham C.H., Badre D. Multiple gates on working memory. Curr. Opin. Behav. Sci. 2015;1:23–31. - PMC - PubMed
    1. Rac-Lubashevsky R., Frank M.J. Analogous computations in working memory input, output, and motor gating: Electrophysiological and computational modeling evidence. PLoS Comput. Biol. 2021;17:e1008971. - PMC - PubMed

LinkOut - more resources