

Qualitative and Quantitative Profiling of Enamel Remineralizing Potential of Fluoride Varnishes Incorporating Bioactive Glass, Dicalcium Phosphate Dihydrate, and Modified MTA: A Raman Spectroscopic Study
- PMID: 37519984
- PMCID: PMC10373779
- DOI: 10.5005/jp-journals-10005-2535
Qualitative and Quantitative Profiling of Enamel Remineralizing Potential of Fluoride Varnishes Incorporating Bioactive Glass, Dicalcium Phosphate Dihydrate, and Modified MTA: A Raman Spectroscopic Study
Abstract
Aim: To evaluate and compare for remineralization potential of enamel at three different time intervals using commercially available MI Varnish and Duraflor Halo varnish [5% sodium fluoride (NaF) varnish] incorporating bioactive glass, dicalcium phosphate dihydrate (DCPD), and biomimetically modified mineral trioxide aggregate (MTA).
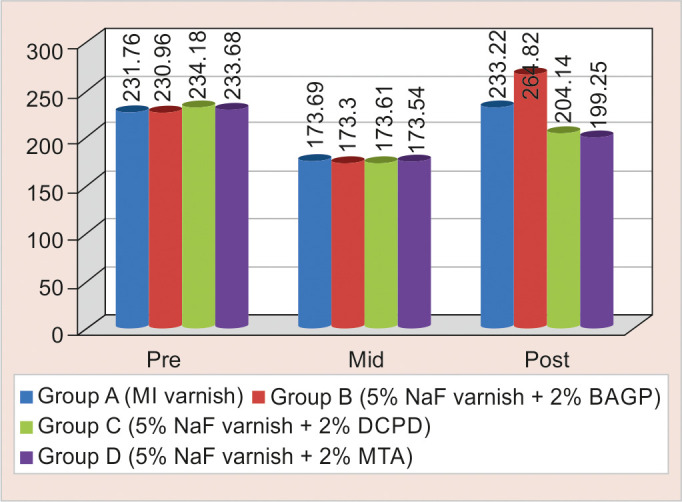
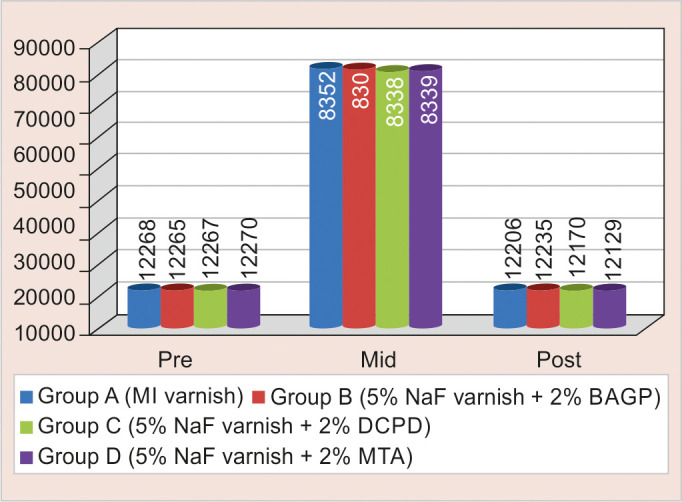
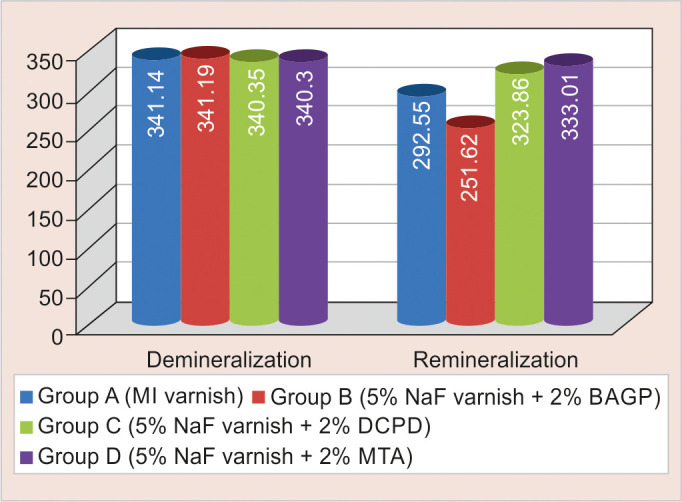
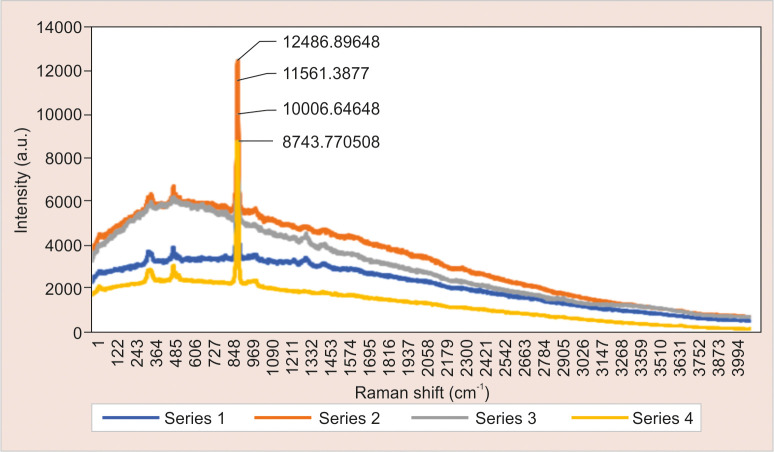
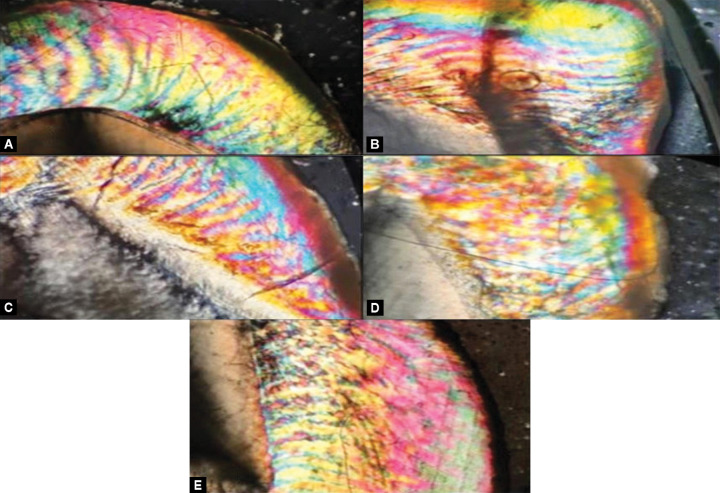
Materials and methods: For the study, a buccolingual division into equal halves was done for 64 decoronated premolar crowns. Among these 64 crowns, we mounted 32 in acrylic discs to be used for microhardness and induced white spot lesions (WSLs) measuring 5 × 5 mm on the exposed enamel surface. These samples were divided into four groups of 24 each depending upon the varnish used. Varnish application was done, followed by immersion of these samples for 24 hours in artificial saliva, followed by peeling off of varnish. A pH cycling of 28 days was done after the varnish application before assessing the remineralization of the samples. Evaluation of all these samples was done at three different time intervals, baseline, after demineralization, and post remineralization for microhardness on the enamel surface. Raman spectroscopy was utilized for the measurement of phosphate (P) ion release. Sectioning of these samples to a thickness of 100 µm approximately was done to be viewed under a polarized light microscope.
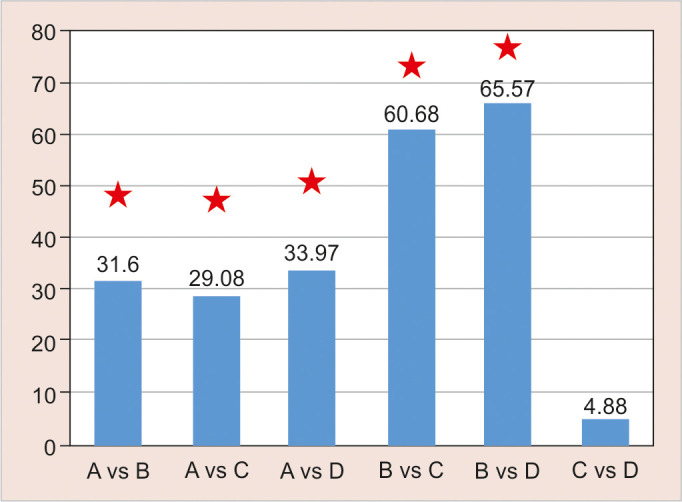
Results: Bioactive glass incorporated varnish showed the highest microhardness values, mineral content levels, and least depth of lesion posttreatment.
Conclusion: All the experimental varnish showed significant remineralizing potential with the best potency seen with bioactive glass incorporated varnish.
Clinical significance: The nonfluoride agents can be appropriately used in 2 wt% amount to augment the benefits of fluoride.
How to cite this article: Hardikar AS, Gaonkar NN, Devendrappa SN, et al. Qualitative and Quantitative Profiling of Enamel Remineralizing Potential of Fluoride Varnishes incorporating Bioactive Glass, Dicalcium Phosphate Dihydrate, and modified MTA: A Raman Spectroscopic Study. Int J Clin Pediatr Dent 2023;16(2):363-370.
Keywords: Bioactive glass; Casein phosphopeptide-amorphous calcium phosphate; Demineralization; Dicalcium phosphate dihydrate; Enamel remineralization; Fluoride varnish; MI varnish; Modified mineral trioxide aggregate; Raman spectroscopy.
Copyright © 2023; The Author(s).
Conflict of interest statement
Source of support: Nil Conflict of interest: None
Figures
References
-
- Geneva: World Health Organization; Fact sheets: oral health [website]. ( accessed 20 December 2018)
-
- Featherstone JD. The caries balance: the basis for caries management by risk assessment. Oral health & preventive dentistry. 2004;2(1):259–264. - PubMed
-
- Kalra DD, Kalra RD, Kini PV, et al. Nonfluoride remineralization: an evidence-based review of contemporary technologies. J Dent Allied Sci. 2014;3(1):24–33. doi: 10.4103/2277-4696.156525. - DOI
LinkOut - more resources
Full Text Sources
Research Materials