

Bioinformatics analysis and prediction of Alzheimer's disease and alcohol dependence based on Ferroptosis-related genes
- PMID: 37520121
- PMCID: PMC10373307
- DOI: 10.3389/fnagi.2023.1201142
Bioinformatics analysis and prediction of Alzheimer's disease and alcohol dependence based on Ferroptosis-related genes
Abstract
Background: Alzheimer's disease (AD) is a neurodegenerative disease whose origins have not been universally accepted. Numerous studies have demonstrated the relationship between AD and alcohol dependence; however, few studies have combined the origins of AD, alcohol dependence, and programmed cell death (PCD) to analyze the mechanistic relationship between the development of this pair of diseases. We demonstrated in previous studies the relationship between psychiatric disorders and PCD, and in the same concerning neurodegeneration-related AD, we found an interesting link with the Ferroptosis pathway. In the present study, we explored the bioinformatic interactions between AD, alcohol dependence, and Ferroptosis and tried to elucidate and predict the development of AD from this aspect.
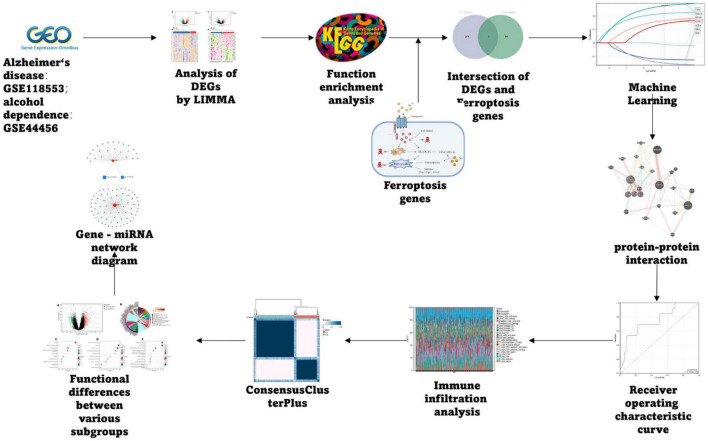
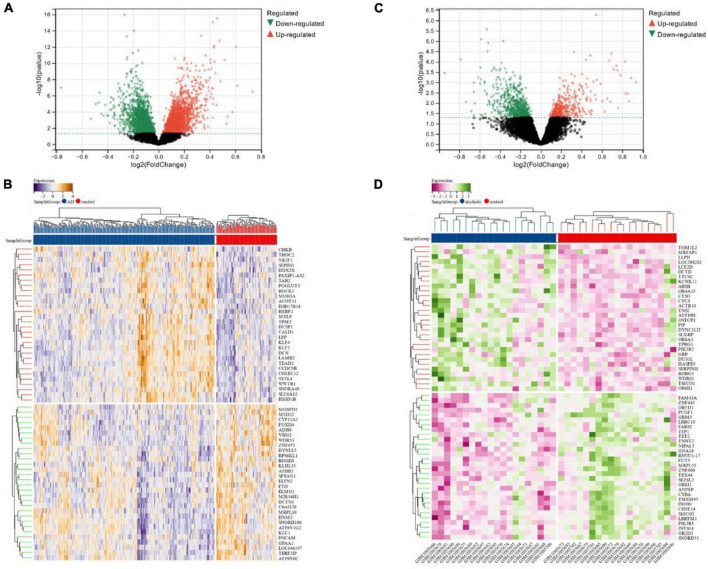
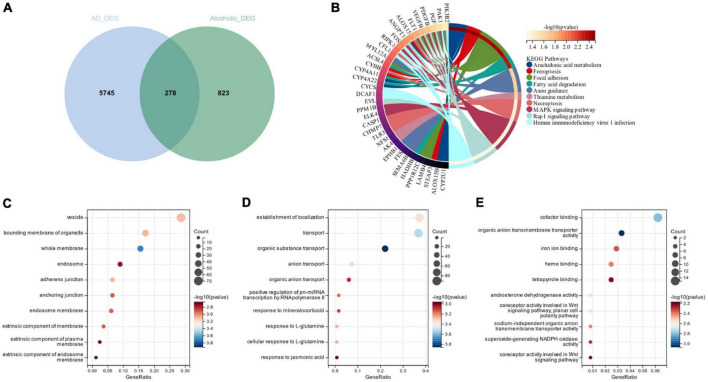
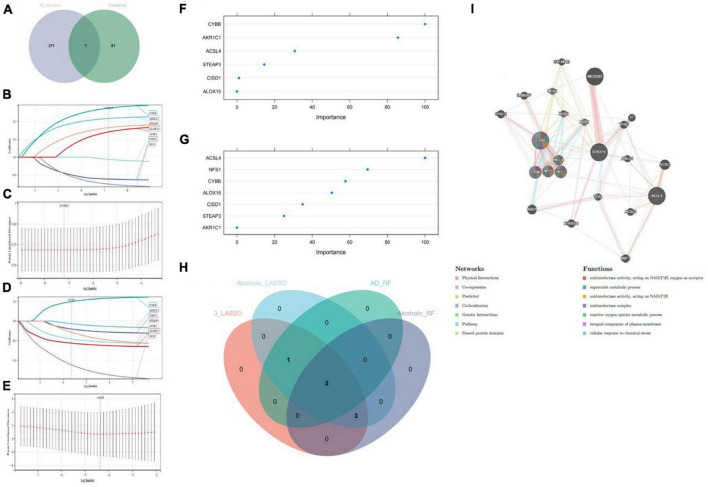
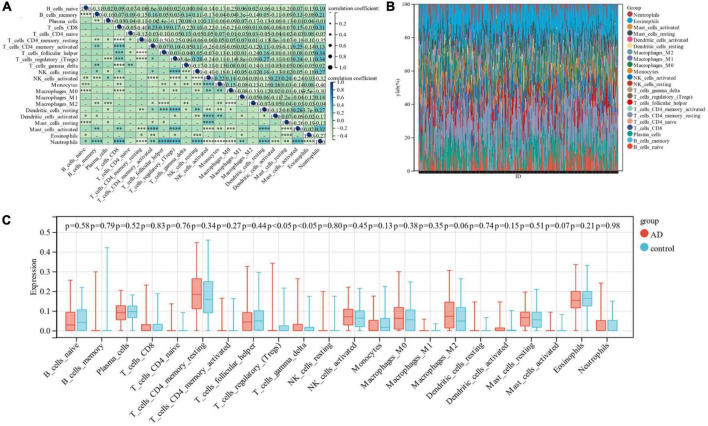
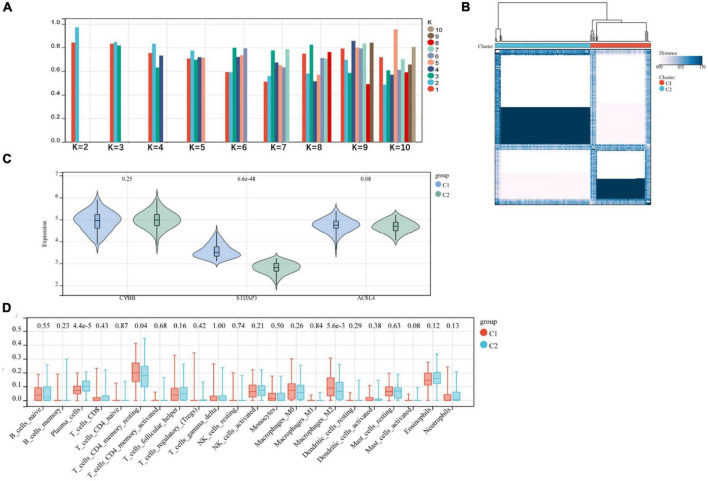
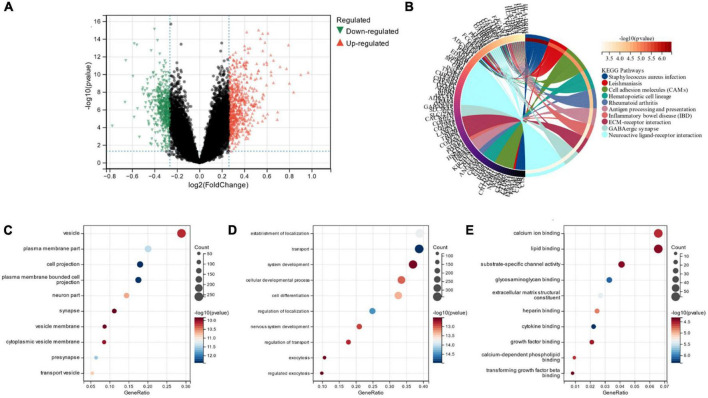
Methods: We selected the Alzheimer's disease dataset GSE118553 and alcohol dependence dataset GSE44456 from the Gene Expression Omnibus (GEO) database. Ferroptosis-related genes were gathered through Gene Set Enrichment Analysis (GSEA), Kyoto Encyclopedia of Genes and Genomes (KEGG), and relevant literature, resulting in a total of 88 related genes. For the AD and alcohol dependence datasets, we conducted Limma analysis to identify differentially expressed genes (DEGs) and performed functional enrichment analysis on the intersection set. Furthermore, we used ferroptosis-related genes and the DEGs to perform machine learning crossover analysis, employing Least Absolute Shrinkage and Selection Operator (LASSO) regression to identify candidate immune-related central genes. This analysis was also used to construct protein-protein interaction networks (PPI) and artificial neural networks (ANN), as well as to plot receiver operating characteristic (ROC) curves for diagnosing AD and alcohol dependence. We analyzed immune cell infiltration to explore the role of immune cell dysregulation in AD. Subsequently, we conducted consensus clustering analysis of AD using three relevant candidate gene models and examined the immune microenvironment and functional pathways between different subgroups. Finally, we generated a network of gene-gene interactions and miRNA-gene interactions using Networkanalyst.
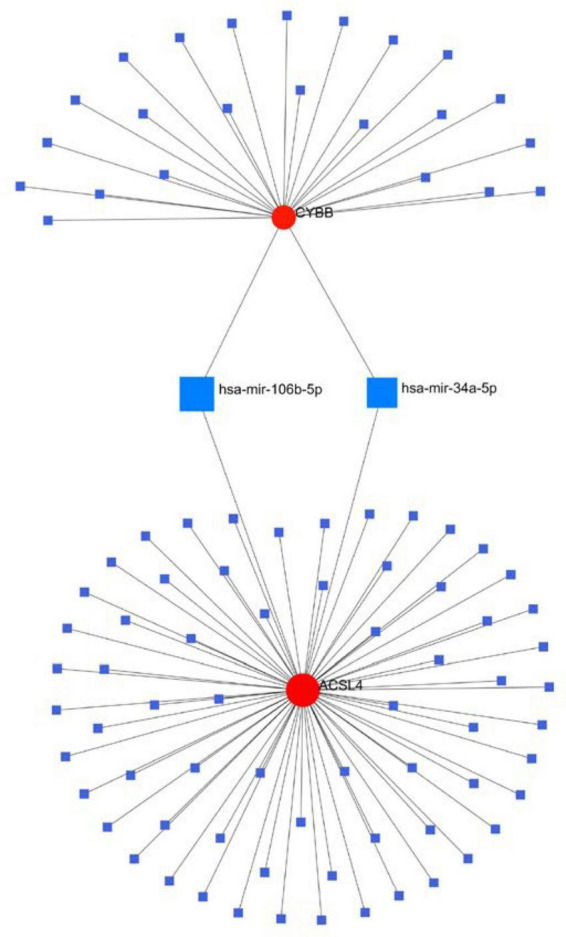
Results: The crossover of AD and alcohol dependence DEG contains 278 genes, and functional enrichment analysis showed that both AD and alcohol dependence were strongly correlated with Ferroptosis, and then crossed them with Ferroptosis-related genes to obtain seven genes. Three candidate genes were finally identified by machine learning to build a diagnostic prediction model. After validation by ANN and PPI analysis, ROC curves were plotted to assess the diagnostic value of AD and alcohol dependence. The results showed a high diagnostic value of the predictive model. In the immune infiltration analysis, functional metabolism and immune microenvironment of AD patients were significantly associated with Ferroptosis. Finally, analysis of target genes and miRNA-gene interaction networks showed that hsa-mir-34a-5p and has-mir-106b-5p could simultaneously regulate the expression of both CYBB and ACSL4.
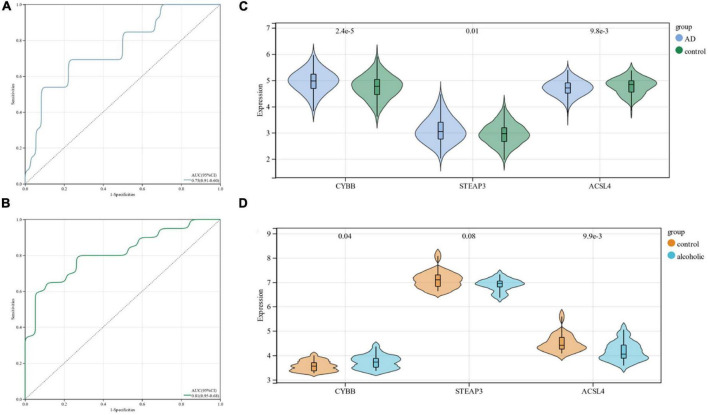
Conclusion: We obtained a diagnostic prediction model with good effect by comprehensive analysis, and validation of ROC in AD and alcohol dependence data sets showed good diagnostic, predictive value for both AD (AUC 0. 75, CI 0.91-0.60), and alcohol dependence (AUC 0.81, CI 0.95-0.68). In the consensus clustering grouping, we identified variability in the metabolic and immune microenvironment between subgroups as a likely cause of the different prognosis, which was all related to Ferroptosis function. Finally, we discovered that hsa-mir-34a-5p and has-mir-106b-5p could simultaneously regulate the expression of both CYBB and ACSL4.
Keywords: ACSL4; Alzheimer’s disease; Ferroptosis; STEAP3; alcohol dependence; cybB.
Copyright © 2023 Tian, Shen, Qi, Feng and Fang.
Conflict of interest statement
The authors declare that the research was conducted in the absence of any commercial or financial relationships that could be construed as a potential conflict of interest.
Figures
Similar articles
-
[Exploration of key ferroptosis-related genes as therapeutic targets for sepsis based on bioinformatics and the depiction of their immune profiles characterization].Zhonghua Wei Zhong Bing Ji Jiu Yi Xue. 2024 Oct;36(10):1025-1032. doi: 10.3760/cma.j.cn121430-20240524-00457. Zhonghua Wei Zhong Bing Ji Jiu Yi Xue. 2024. PMID: 39586719 Chinese.
-
Machine learning-based predictive models and drug prediction for schizophrenia in multiple programmed cell death patterns.Front Mol Neurosci. 2023 Mar 13;16:1123708. doi: 10.3389/fnmol.2023.1123708. eCollection 2023. Front Mol Neurosci. 2023. PMID: 36993785 Free PMC article.
-
Predictive model, miRNA-TF network, related subgroup identification and drug prediction of ischemic stroke complicated with mental disorders based on genes related to gut microbiome.Front Neurol. 2023 May 26;14:1189746. doi: 10.3389/fneur.2023.1189746. eCollection 2023. Front Neurol. 2023. PMID: 37305753 Free PMC article.
-
JUN and ATF3 in Gout: Ferroptosis-related potential diagnostic biomarkers.Heliyon. 2024 Oct 30;10(22):e39957. doi: 10.1016/j.heliyon.2024.e39957. eCollection 2024 Nov 30. Heliyon. 2024. PMID: 39619595 Free PMC article. Review.
-
Bioinformatics and machine learning approaches reveal key genes and underlying molecular mechanisms of atherosclerosis: A review.Medicine (Baltimore). 2024 Aug 2;103(31):e38744. doi: 10.1097/MD.0000000000038744. Medicine (Baltimore). 2024. PMID: 39093811 Free PMC article. Review.
Cited by
-
miRNA-137-5p improves spatial memory and cognition in Alzheimer's mice by targeting ubiquitin-specific peptidase 30.Animal Model Exp Med. 2023 Dec;6(6):526-536. doi: 10.1002/ame2.12368. Epub 2023 Dec 18. Animal Model Exp Med. 2023. PMID: 38111333 Free PMC article.
-
Bioinformatics and Deep Learning Approach to Discover Food-Derived Active Ingredients for Alzheimer's Disease Therapy.Foods. 2025 Jan 4;14(1):127. doi: 10.3390/foods14010127. Foods. 2025. PMID: 39796418 Free PMC article.
-
Transcriptional Patterns in Stages of Alzheimer's Disease Are Cell-Type-Specific and Partially Converge with the Effects of Alcohol Use Disorder in Humans.eNeuro. 2024 Oct 16;11(10):ENEURO.0118-24.2024. doi: 10.1523/ENEURO.0118-24.2024. Print 2024 Oct. eNeuro. 2024. PMID: 39299805 Free PMC article.
-
Dual disease co-expression analysis reveals potential roles of estrogen-related genes in postmenopausal osteoporosis and Parkinson's disease.Front Genet. 2025 Jan 7;15:1518471. doi: 10.3389/fgene.2024.1518471. eCollection 2024. Front Genet. 2025. PMID: 39840278 Free PMC article.
-
Harnessing ferroptosis for precision oncology: challenges and prospects.BMC Biol. 2025 Feb 24;23(1):57. doi: 10.1186/s12915-025-02154-6. BMC Biol. 2025. PMID: 39988655 Free PMC article. Review.
References
-
- Alamro H., Bajic V., Macvanin M. T., Isenovic E. R., Gojobori T., Essack M., et al. (2022). Type 2 Diabetes Mellitus and its comorbidity, Alzheimer’s disease: Identifying critical microRNA using machine learning. Front. Endocrinol. (Lausanne) 13:1084656. 10.3389/fendo.2022.1084656 - DOI - PMC - PubMed
LinkOut - more resources
Full Text Sources
Miscellaneous