

The prognostic significance of KLRB1 and its further association with immune cells in breast cancer
- PMID: 37520246
- PMCID: PMC10373647
- DOI: 10.7717/peerj.15654
The prognostic significance of KLRB1 and its further association with immune cells in breast cancer
Abstract
Background: Killer cell lectin-like receptor B1 (KLRB1) is an important member of the natural killer cell gene family. This study explored the potential value of KLRB1 as a breast cancer (BC) biomarker and its close association with the tumor immune microenvironment during the development of BC.
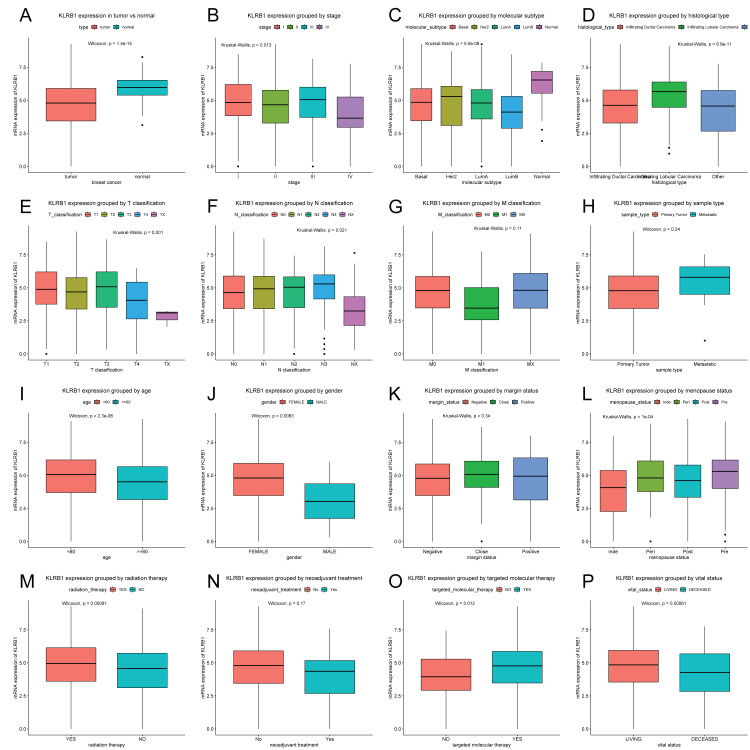
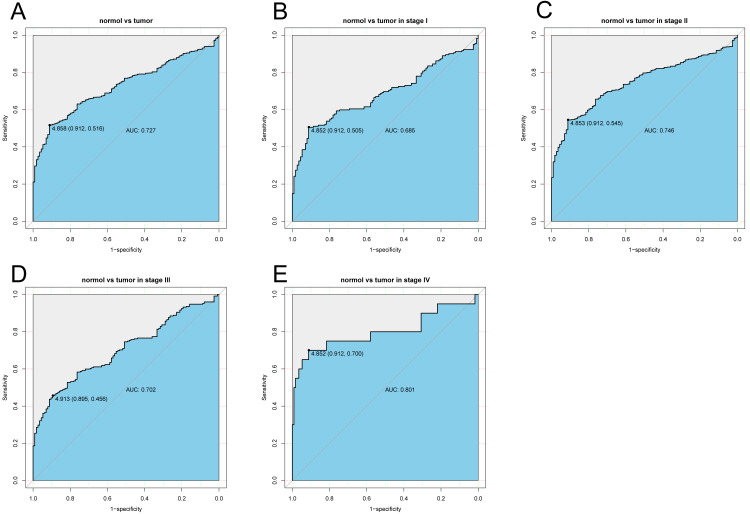
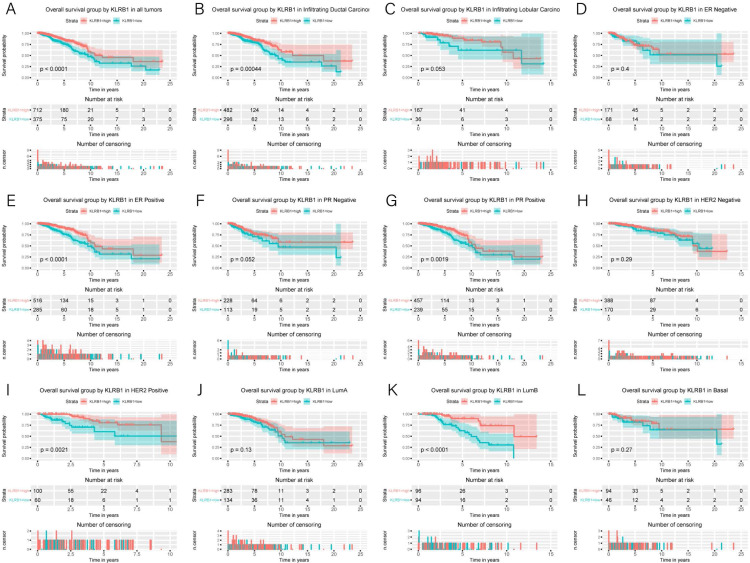
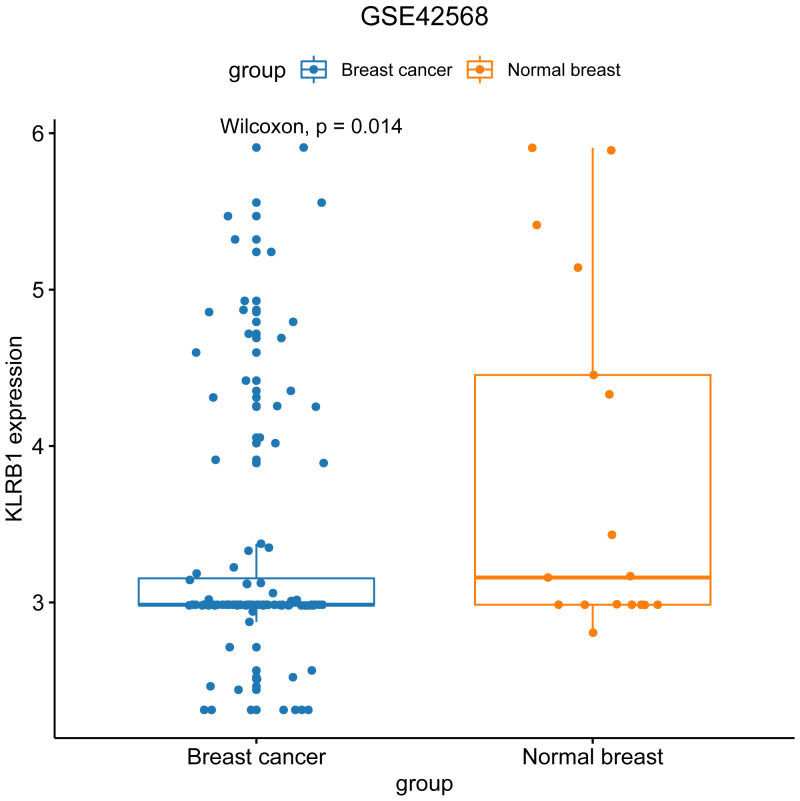
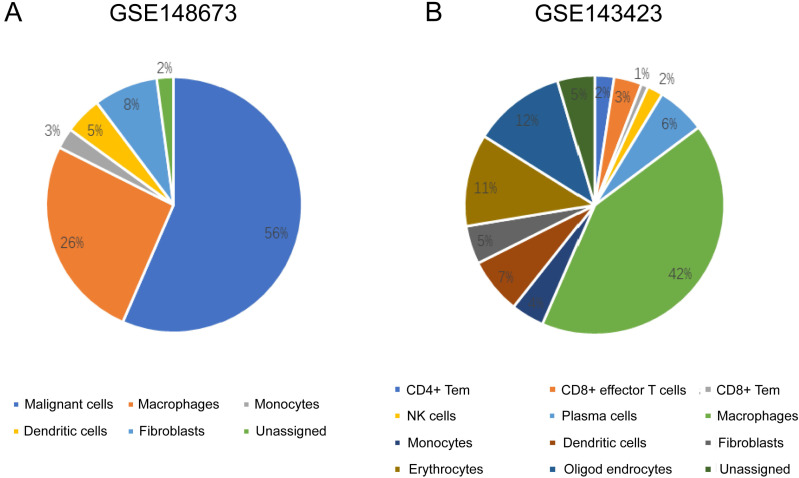
Methods: We examined the differential expression of KLRB1 in pan-cancer. Clinical and RNA-Seq data from BC samples were evaluated in The Cancer Genome Atlas (TCGA) and validated in Gene Expression Omnibus (GEO) datasets and by immunohistochemistry (IHC) staining. The relationship between KLRB1 and clinical parameters was explored through Chi-square tests. The diagnostic value of KLRB1 was evaluated using a receiver operating characteristic (ROC) curve. Survival analysis was tested by Kaplan-Meier curves to demonstrate the relationship between KLRB1 and survival. Univariable and multivariate cox regression analyses were carried out as well. The analysis of immune infiltration level and gene set enrichment analysis (GSEA) were conducted to examine KLRB1's mechanism during the progression of BC. We used the Tumor Immune Estimation Resource (TIMER), the Cancer Single-cell Expression Map (CancerSCEM) database, the Tumor Immune Single-cell Hub (TISCH) database, and the Cell-type Identification by Estimating Relative Subsets of RNA Transcripts (CIBERSORT) method to explore KLRB1's association with immune infiltration level and different quantitative distribution of immune cells. The relevant signaling pathways in BC associated with KLRB1 were identified using GSEA.
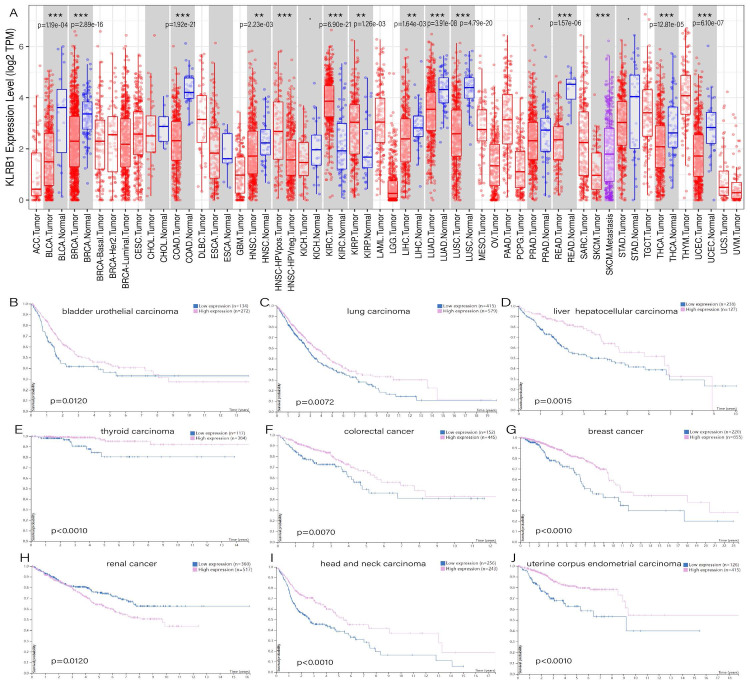
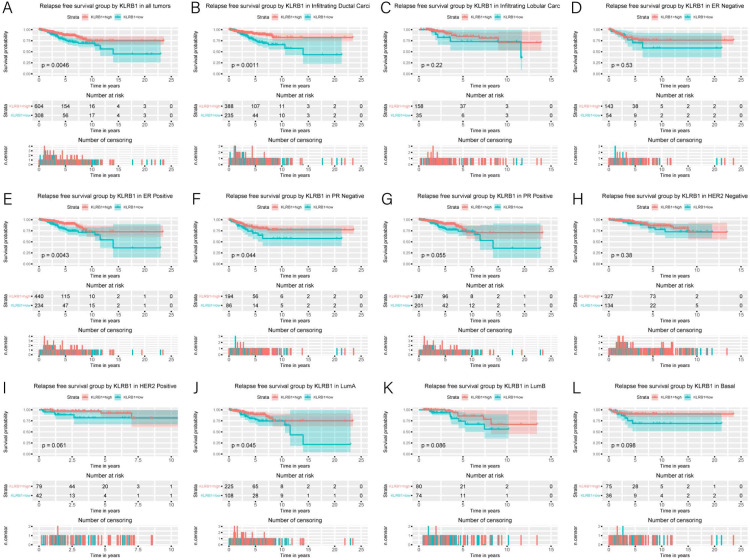
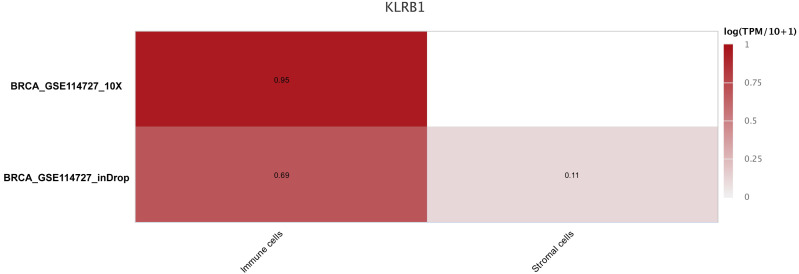
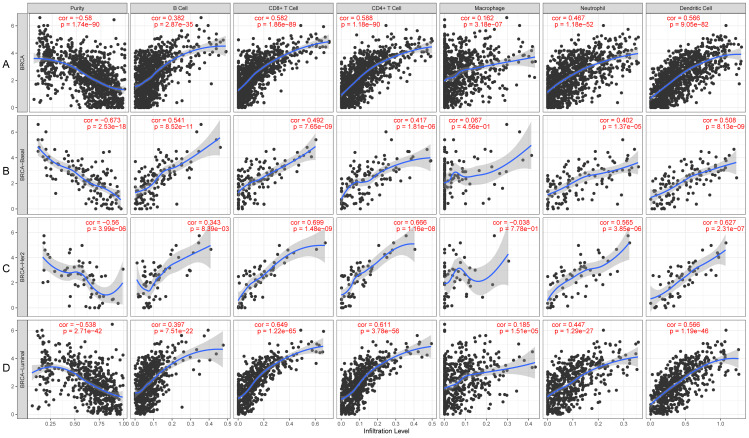
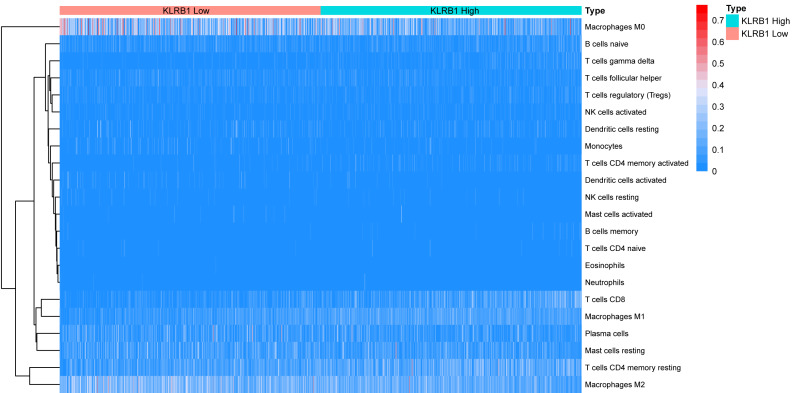
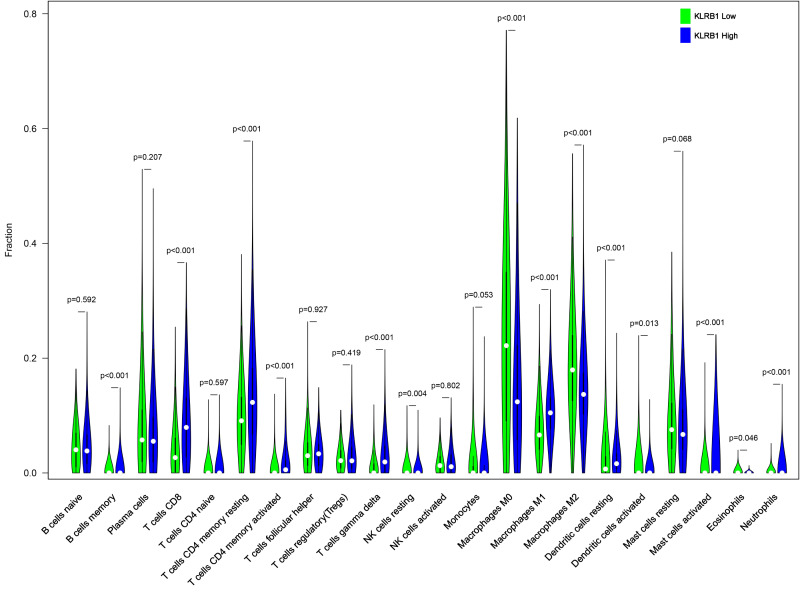
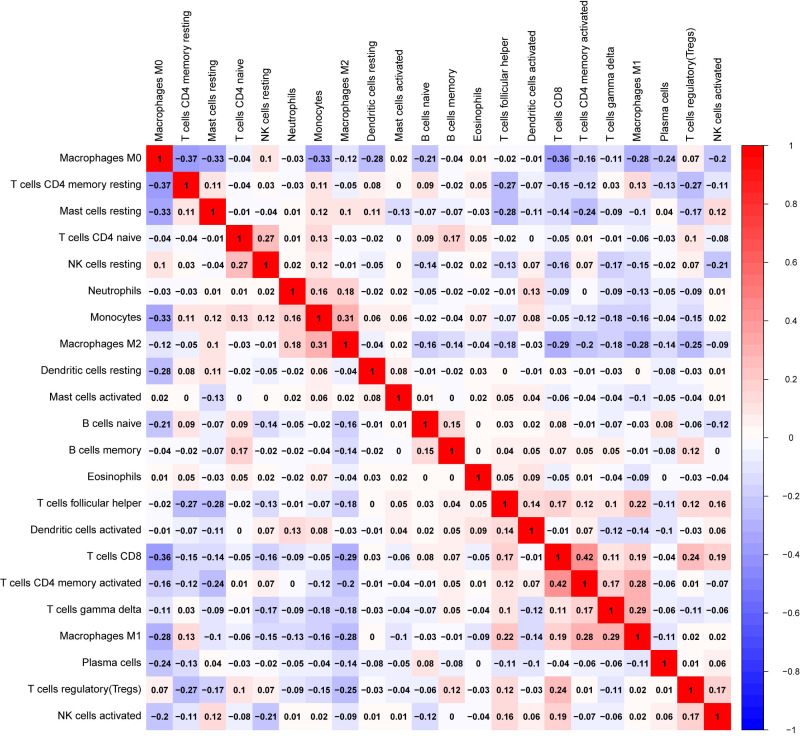
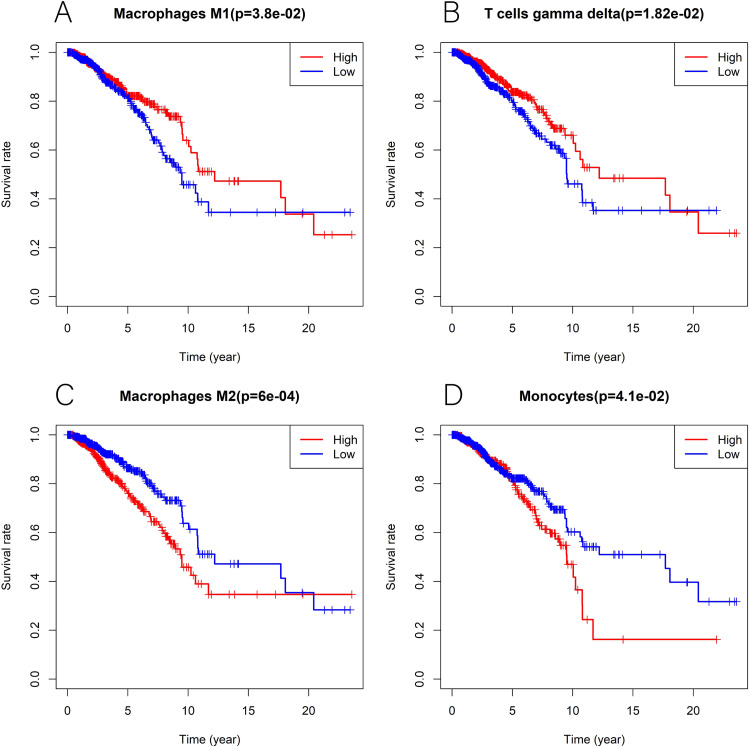
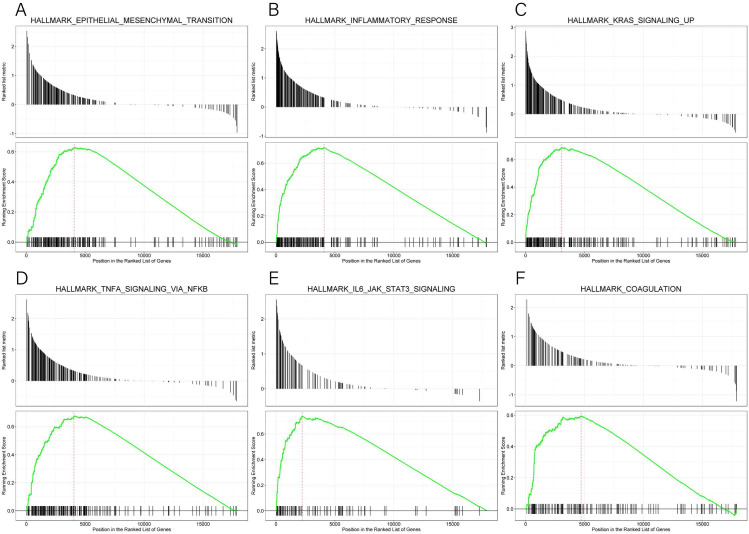
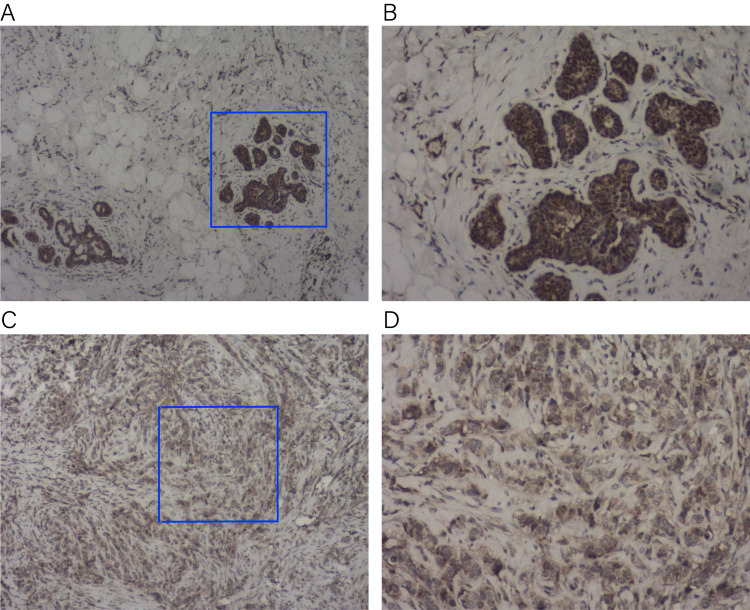
Results: The expression of KLRB1 was downregulated across the majority of cancers including BC. The lower KLRB1 expression group exhibited shorter relapse free survival (RFS) and overall survival (OS). IHC staining showed that KLRB1 staining was weaker in breast tumor tissues than in paratumors. Additionally, GSEA identified several pathway items distinctly enriched in BC. KLRB1 expression level was also positively related to the infiltrating number of immune cells in BC. Moreover, the CancerSCEM and TISCH databases as well as the CIBERSORT method demonstrated the close relationship between KLRB1 and immune cells, particularly macrophages.
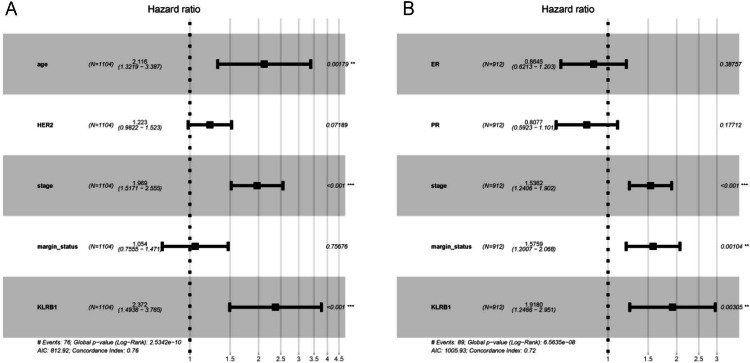
Conclusion: Low KLRB1 expression was considered an independent prognostic biomarker and played an important role in the tumor immune microenvironment of BC patients.
Keywords: Biomarker; Breast cancer; Killer cell lectin-like receptor B1 (KLRB1); Macrophages; Prognosis; Tumor immune microenvironment.
©2023 Xu et al.
Conflict of interest statement
The authors declare there are no competing interests.
Figures
Similar articles
-
Inhibiting KLRB1 expression is associated with impairing cancer immunity and leading to cancer progression and poor prognosis in breast invasive carcinoma patients.Aging (Albany NY). 2023 Nov 20;15(22):13265-13286. doi: 10.18632/aging.205239. Epub 2023 Nov 20. Aging (Albany NY). 2023. PMID: 37988189 Free PMC article.
-
KLRB1 is a novel prognostic biomarker in endometrial cancer and is associated with immune infiltration.Transl Cancer Res. 2023 Dec 31;12(12):3641-3652. doi: 10.21037/tcr-23-697. Epub 2023 Nov 21. Transl Cancer Res. 2023. PMID: 38192989 Free PMC article.
-
Cysteine conjugate beta-lyase 2 (CCBL2) expression as a prognostic marker of survival in breast cancer patients.PLoS One. 2022 Jun 30;17(6):e0269998. doi: 10.1371/journal.pone.0269998. eCollection 2022. PLoS One. 2022. PMID: 35771747 Free PMC article.
-
Low expression of KLRB1 predicts poor survival outcomes and is associated with immune infiltration in breast cancer.Transl Cancer Res. 2024 Mar 31;13(3):1225-1240. doi: 10.21037/tcr-23-1231. Epub 2024 Mar 25. Transl Cancer Res. 2024. PMID: 38617516 Free PMC article.
-
A comprehensive analysis of the KLRB1 expression and its clinical implication in testicular germ cell tumors: A review.Medicine (Baltimore). 2024 Apr 12;103(15):e37688. doi: 10.1097/MD.0000000000037688. Medicine (Baltimore). 2024. PMID: 38608099 Free PMC article. Review.
Cited by
-
Inhibiting KLRB1 expression is associated with impairing cancer immunity and leading to cancer progression and poor prognosis in breast invasive carcinoma patients.Aging (Albany NY). 2023 Nov 20;15(22):13265-13286. doi: 10.18632/aging.205239. Epub 2023 Nov 20. Aging (Albany NY). 2023. PMID: 37988189 Free PMC article.
-
KLRB1 expression is associated with lung adenocarcinoma prognosis and immune infiltration and regulates lung adenocarcinoma cell proliferation and metastasis through the MAPK/ERK pathway.J Thorac Dis. 2024 Jun 30;16(6):3764-3781. doi: 10.21037/jtd-24-8. Epub 2024 Jun 28. J Thorac Dis. 2024. PMID: 38983163 Free PMC article.
-
Immune evasion and resistance in breast cancer.Am J Cancer Res. 2025 Apr 15;15(4):1517-1539. doi: 10.62347/PNGT6996. eCollection 2025. Am J Cancer Res. 2025. PMID: 40371160 Free PMC article. Review.
-
Down-regulation of KLRB1 is associated with increased cell growth, metastasis, poor prognosis, as well as a dysfunctional immune microenvironment in LUAD.Sci Rep. 2024 May 23;14(1):11782. doi: 10.1038/s41598-024-60414-x. Sci Rep. 2024. PMID: 38782996 Free PMC article.
-
CD161, a promising prognostic biomarker in hepatocellular carcinoma, correlates with immune infiltration.PeerJ. 2025 Mar 17;13:e19055. doi: 10.7717/peerj.19055. eCollection 2025. PeerJ. 2025. PMID: 40115278 Free PMC article.
References
-
- Adithan A, John Peter JS, Mohammad AH, Kim B, Kang CW, Kim NS, Hwang KC, Kim JH. A gastric cancer cell derived extracellular compounds suppresses CD161(+)CD3(-) lymphocytes and aggravates tumor formation in a syngeneic mouse model. Molecular Immunology. 2020;120:136–145. doi: 10.1016/j.molimm.2020.02.016. - DOI - PubMed
-
- Azizi E, Carr AJ, Plitas G, Cornish AE, Konopacki C, Prabhakaran S, Nainys J, Wu K, Kiseliovas V, Setty M, Choi K, Fromme RM, Dao P, McKenney PT, Wasti RC, Kadaveru K, Mazutis L, Rudensky AY, Pe’er D. Single-cell map of diverse immune phenotypes in the breast tumor microenvironment. Cell. 2018;174:1293–1308.e1236. doi: 10.1016/j.cell.2018.05.060. - DOI - PMC - PubMed
LinkOut - more resources
Full Text Sources
