. 2023 Jul 14:21:3590-3603.
doi: 10.1016/j.csbj.2023.07.014. eCollection 2023.

Patterns of transcription factor binding and epigenome at promoters allow interpretable predictability of multiple functions of non-coding and coding genes

Affiliations

Patterns of transcription factor binding and epigenome at promoters allow interpretable predictability of multiple functions of non-coding and coding genes

Omkar Chandra et al. Comput Struct Biotechnol J. .

Abstract

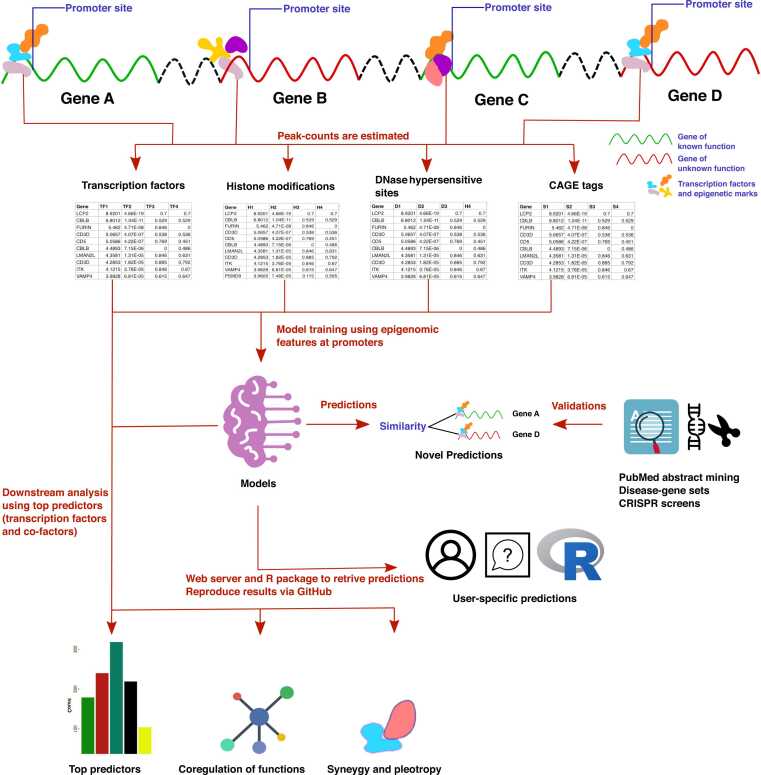
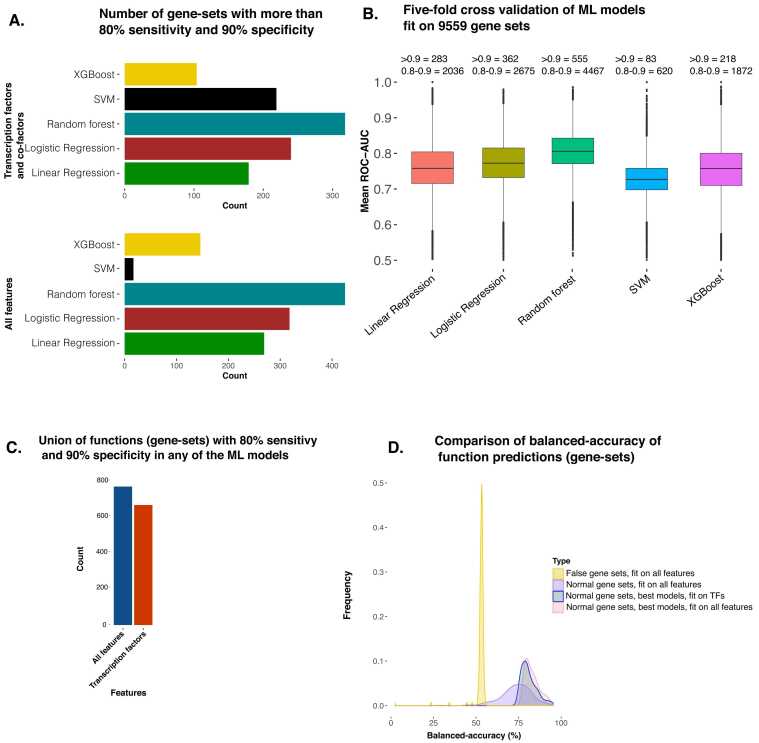
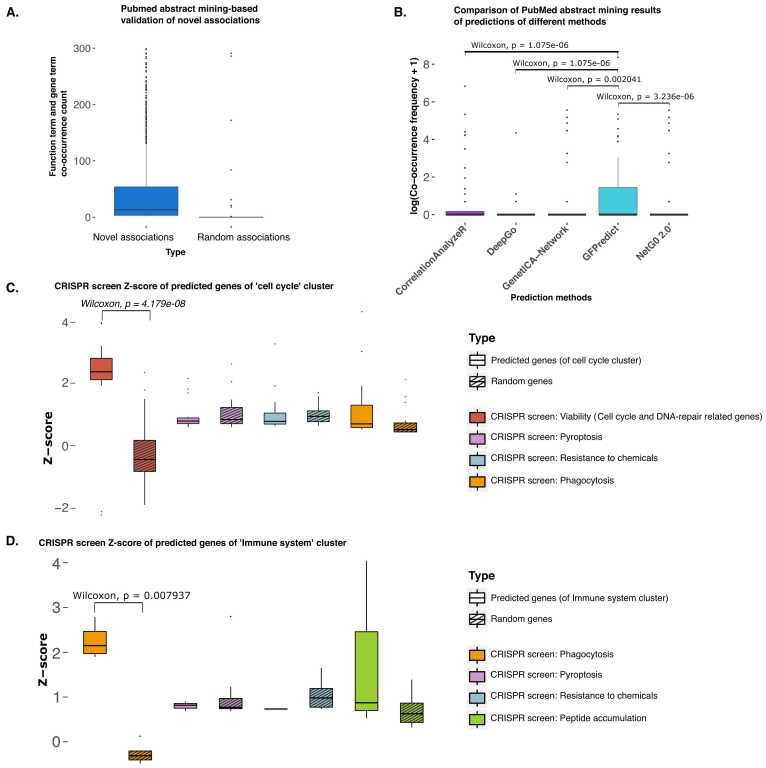
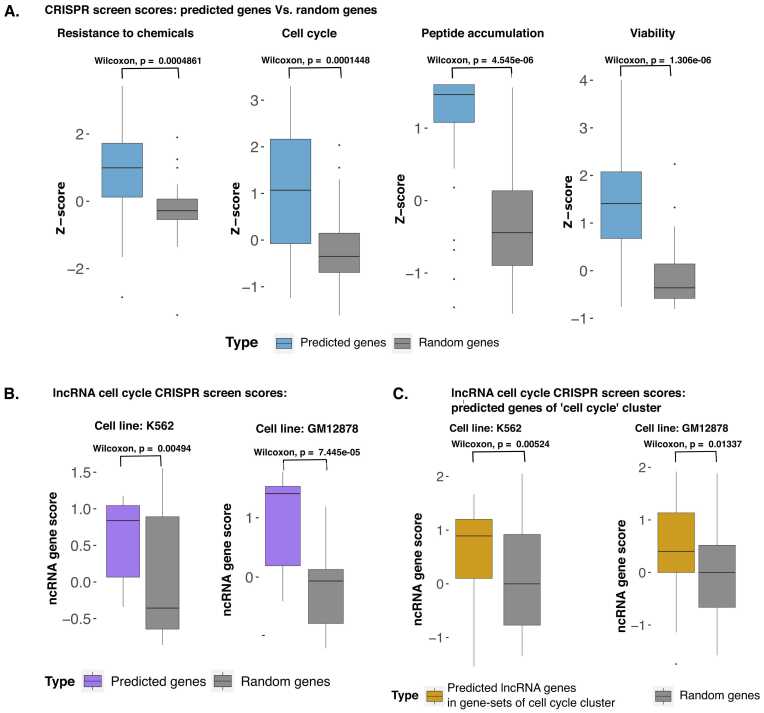
Understanding the biological roles of all genes only through experimental methods is challenging. A computational approach with reliable interpretability is needed to infer the function of genes, particularly for non-coding RNAs. We have analyzed genomic features that are present across both coding and non-coding genes like transcription factor (TF) and cofactor ChIP-seq (823), histone modifications ChIP-seq (n = 621), cap analysis gene expression (CAGE) tags (n = 255), and DNase hypersensitivity profiles (n = 255) to predict ontology-based functions of genes. Our approach for gene function prediction was reliable (>90% balanced accuracy) for 486 gene-sets. PubMed abstract mining and CRISPR screens supported the inferred association of genes with biological functions, for which our method had high accuracy. Further analysis revealed that TF-binding patterns at promoters have high predictive strength for multiple functions. TF-binding patterns at the promoter add an unexplored dimension of explainable regulatory aspects of genes and their functions. Therefore, we performed a comprehensive analysis for the functional-specificity of TF-binding patterns at promoters and used them for clustering functions to reveal many latent groups of gene-sets involved in common major cellular processes. We also showed how our approach could be used to infer the functions of non-coding genes using the CRISPR screens of coding genes, which were validated using a long non-coding RNA CRISPR screen. Thus our results demonstrated the generality of our approach by using gene-sets from CRISPR screens. Overall, our approach opens an avenue for predicting the involvement of non-coding genes in various functions.

Keywords: Coregulation of functions; Epigenetics; Functional genomics; Gene function prediction; Gene regulation; General transcription factor (GTF); LncRNA); Long noncoding RNA (long ncRNA.


Conflict of interest statement

Author declare no conflict of interest.

Figures

ga1
Graphical abstract
Fig. 1
Fig. 1
Flowchart of our analysis to predict gene functions using epigenome and TF binding profiles.
Fig. 2
Fig. 2
An overview of the predictive power of epigenome profiles, especially transcription factor binding patterns at promoters for predicting gene function. A) Bar plot showing the number of functional gene-sets which had good predictions on the test set (80% sensitivity and 90% specificity) using five different machine learning (ML) models. The upper panel shows the number of functions with the good prediction by ML models using 853 transcription factor (TF) ChIP-seq profiles. The lower panel shows the ML models using five different types of profiles (TF, cofactor, and histone modifications ChIP-seq, DNase-seq, CAGE-tags). B) The box plots of AUC-ROC (area under the curve of receiver operating characteristic) for all gene-sets are shown for five ML models. The AUC values here are an average of five-fold runs for every gene-set. The number of gene-sets with AUC above 0.9 and between 0.8 and 0.9 is mentioned above the boxes. C) The bar plot shows the number of union sets of functions with good predictability (80% sensitivity and 90% specificity) using any of the 5 ML models. D) A plot to show the sanity of our approach. Here the density plot in yellow shows the distribution of balanced accuracy achieved with false gene-sets (gene-sets created by random sampling). Other density plots show the distribution of balanced accuracy achieved using empirically annotated gene-sets. The density plot for some functions with balanced accuracy above the 35 percentile among all the functions is also shown.
Fig. 3
Fig. 3
Clustering functions based on shared predictive TFs and cofactors ChIP-seq profiles reveal their potential overlap for major cellular processes A) tSNE plot and visualization of DBSCAN-based clustering of functions (gene-sets). Here, every dot in the tSNE plot shows a gene-set. The details about the two clusters are displayed as a heatmap showing the similarity in the number of common top predictors (ChIP-seq profiles in top 20 predictors). The two clusters are cluster-47, consisting of functions related to the cell cycle, and cluster-26, which is related to organ development. B) The dot plot shows the value of feature importance of ChIP-seq profiles of TFs and cofactors for functions belonging to cluster-47 (cell cycle-related functions). The feature importance value not lying in the top 20 is shown with a minimum dot size.
Fig. 4
Fig. 4
Validation of predictions of novel association between function and genes. A) The box plot shows the frequency of co-occurrence of function terms and corresponding gene names in PubMed abstracts. The left box plot shows the frequency of the novel predictions made by GFPredict, while the right one shows random pairs of functions and genes. The novel and random associations between function and genes were not present in the gene-sets we used for training or testing. B) Benchmarking and comparison for five different methods for finding associations between functions and genes. C) Validation using CRISPR screen for ‘Viability’ function for genes predicted to be part of a gene-sets belonging to a cluster associated with a major cellular process, “cell cycle process.” In the corresponding study, authors found that genes with high CRISPR z-score for viability were mostly associated with cell cycle and DNA-repair . The stripped bars indicate the score of random genes, and the non-stripped bars indicate predicted genes' scores. The difference between z-scores for predicted genes (for cell cycle associated cluster) and random genes is not high in other CRISPR screens for ‘pyroptosis,’ ‘resistance to chemicals, and ‘phagocytosis.’ D) Validation using CRISPR screen for the function of ‘Phagocytosis’ for genes predicted to be part of gene-sets of the cluster associated with the ‘immune system.’ Phagocytosis is an important part of immunity . The stripped bars indicate the score of random genes, and the non-stripped bars indicate predicted genes' scores. The difference between z-scores for predicted genes (for the immune system) and random genes is not high in other CRISPR screens for ‘pyroptosis,’ ‘resistance to chemicals, ’ and ‘peptide accumulation.’.
Fig. 5
Fig. 5
Insight into the co-occurrence of Transcription factor (TF) pairs among predictors and their synergy. A) The count of functions (pink) and the clusters of functions (green) for which TF ChIP-seq pairs appeared among the top 20 predictors in the same cell type. The panel on the right shows the same counts as a scatter plot. The TF-pairs shown with symbols are C3: E2F4-GATA1, C4: MAZ-GATA1, F3: ZNF366-SPI1, F4: SPI1-STAT1. B) Heatmap showing the significance of overlap of TF ChIP-seq peaks in GM12878 cells at promoters. C) The box plot of values of significance (-log(P-value)) of overlap of promoter-peaks of TF ChIP-seq pairs in GM12878 cells which appeared together as top predictors in one or more functions. On the right is the box plot of the significance of the overlap of promoter peaks for random pairs of TF ChIP-seq profiles in GM12878 cells.
Fig. 6
Fig. 6
Validation of predicted coding and non-coding genes using CRISPR screens. A) CRISPR scores of the top 30 predicted genes from the GFPredict model, which was trained on the top 50 genes of CRISPR screens against CRISPR scores of random genes. The top 30 predicted genes were not part of the training set. B) CRISPR scores of lncRNA genes among the top 30 predicted genes in the lncRNA-CRISPR-screen for cell cycle by GFPredict trained using the top 50 positive coding genes of a different cell-cycle CRISPR screen (Yilmaz et al.). Among the top 30 predicted genes, there were 15 lncRNA genes. C) CRISPR scores of 52 lncRNA genes predicted to be in the cluster with the major cellular process, cell cycle (custer-47 shown in Fig. 3.), compared against the scores of random genes in lncRNA CRISPR screen for cell cycle.

Similar articles

References

    1. Rinn J.L., Chang H.Y. Genome Regulation by Long Noncoding RNAs. 2012 [cited 15 Nov 2021]. doi:10.1146/annurev-biochem-051410–092902. - PMC - PubMed
    1. Kevin C., Wang H.Y.C. Molecular mechanisms of long noncoding RNAs. Mol Cell. 2011;43:904. - PMC - PubMed
    1. Zhang X., Wang W., Zhu W., Dong J., Cheng Y., Yin Z., et al. Mechanisms and functions of long non-coding RNAs at multiple regulatory levels. Int J Mol Sci. 2019;20:5573. - PMC - PubMed
    1. Noviello T.M.R., Di Liddo A., Ventola G.M., Spagnuolo A., D’Aniello S., Ceccarelli M., et al. Detection of long non–coding RNA homology, a comparative study on alignment and alignment–free metrics. BMC Bioinforma. 2018;19:1–12. - PMC - PubMed
    1. Zhao Y., Wang J., Chen J., Zhang X., Guo M., Yu G. A literature review of gene function prediction by modeling gene ontology. Front Genet. 2020:0. doi: 10.3389/fgene.2020.00400. - DOI - PMC - PubMed

LinkOut - more resources