. 2023 Jul 13:14:1210168.
doi: 10.3389/fimmu.2023.1210168. eCollection 2023.

On the feasibility of using TCR sequencing to follow a vaccination response - lessons learned

Affiliations

On the feasibility of using TCR sequencing to follow a vaccination response - lessons learned

Peter C de Greef et al. Front Immunol. .

Abstract

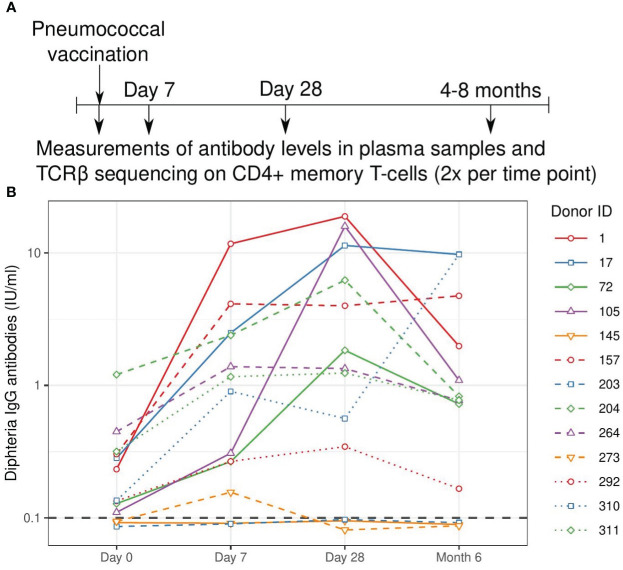
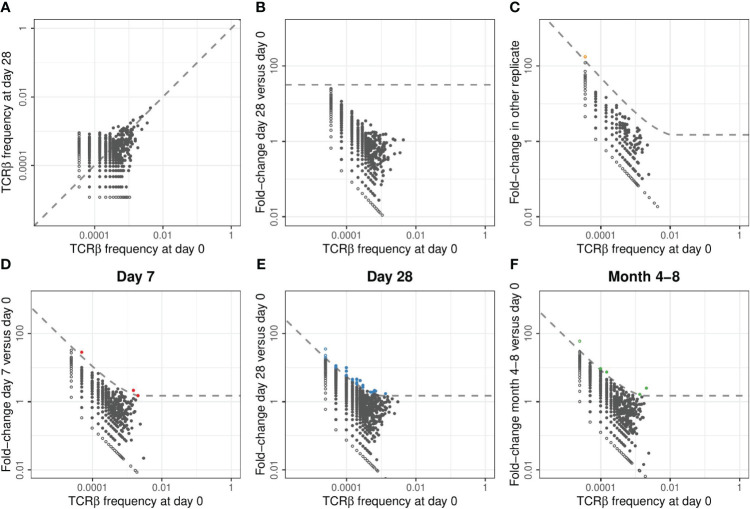
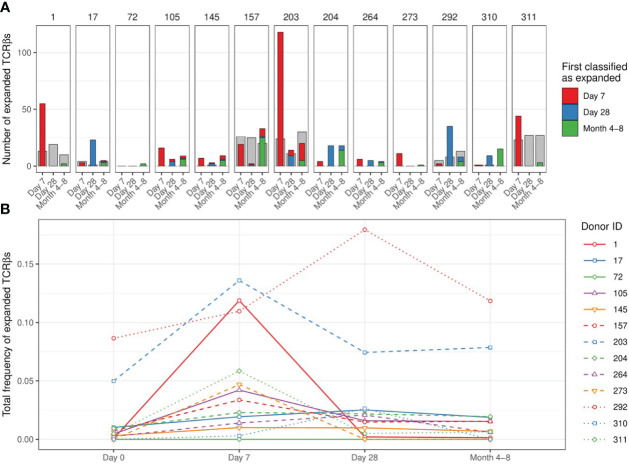
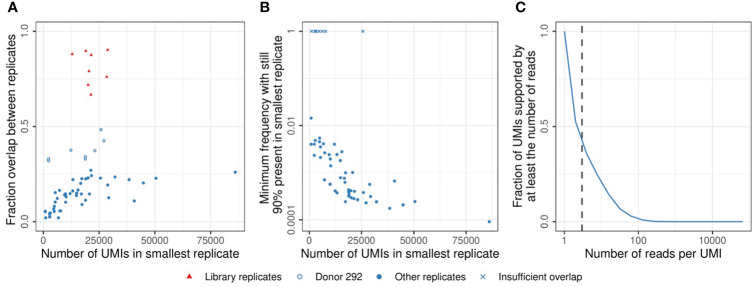
T cells recognize pathogens by their highly specific T-cell receptor (TCR), which can bind small fragments of an antigen presented on the Major Histocompatibility Complex (MHC). Antigens that are provided through vaccination cause specific T cells to respond by expanding and forming specific memory to combat a future infection. Quantification of this T-cell response could improve vaccine monitoring or identify individuals with a reduced ability to respond to a vaccination. In this proof-of-concept study we use longitudinal sequencing of the TCRβ repertoire to quantify the response in the CD4+ memory T-cell pool upon pneumococcal conjugate vaccination. This comes with several challenges owing to the enormous size and diversity of the T-cell pool, the limited frequency of vaccine-specific TCRs in the total repertoire, and the variation in sample size and quality. We defined quantitative requirements to classify T-cell expansions and identified critical parameters that aid in reliable analysis of the data. In the context of pneumococcal conjugate vaccination, we were able to detect robust T-cell expansions in a minority of the donors, which suggests that the T-cell response against the conjugate in the pneumococcal vaccine is small and/or very broad. These results indicate that there is still a long way to go before TCR sequencing can be reliably used as a personal biomarker for vaccine-induced protection. Nevertheless, this study highlights the importance of having multiple samples containing sufficient T-cell numbers, which will support future studies that characterize T-cell responses using longitudinal TCR sequencing.

Keywords: TCR - T cell receptor; high-throughput sequencing; immune response; pneumococcal 13-valent polysaccharide vaccine; vaccination.


Conflict of interest statement

JL currently works at AstraZeneca Netherlands. The research described in this study was performed prior to this employment. The remaining authors declare that the research was conducted in the absence of any commercial or financial relationships that could be construed as a potential conflict of interest.

Figures

Figure 1
Figure 1
Study overview and measured antibody response. (A). Schematic overview of the vaccination and sampling time course. Individuals were vaccinated at day 0, blood samples were drawn before vaccination (day 0) and at three follow-up time points. (B). Quantification of the antibody response to the diphtheria toxin. Values above 0.1 IU/ml are considered protective and this threshold is indicated with a grey dashed line. Solid lines indicate older individuals (over 65 years of age), see Table S1 .
Figure 2
Figure 2
Classification of expansion between time points for TCRβ repertoires of example donor 17. (A). Relative frequency of TCRβ sequences found at day 0 and/or day 28 in samples taken from donor 17. In each panel of this figure, the sequences that are observed at only one of the two time points are plotted as open symbols. For plotting and calculating the fold-change, we assigned these unobserved sequences half the frequency corresponding to a single UMI in the corresponding sample. In each panel, this results in the open dots appearing as two lines, at the left and the bottom, representing the sequences that were unobserved in either of the samples. The dashed line is the diagonal, representing equal frequencies in both samples. (B). Fold-change in TCRβ frequencies observed in samples from donor 17 at day 28 versus day 0. The dashed line indicates a general fold-change threshold of 32x, as was used in (7), with no sequences exceeding this fold-change threshold. (C). Fold-change in TCRβ frequencies between the two replicate samples taken at day 0 from donor 17. The dashed line represents the combined threshold for quantification of expansion (see Methods). Colored dots represent sequences that meet both requirements to be classified as expanded. In this case, comparing two samples from the same TCR repertoire, only a single sequence was classified as expanded (false-positive). (D-F). Similar to (C), but now quantifying the fold-change between different time points. Note that the dashed line defining the threshold for quantification of expansion differs between the panels because it is based on a combination of an absolute and relative change in frequency (see Methods). Sequencing data from replicate samples from each time point is joined, after which expansion at day 7 (D), day 28 (E), and month 4-8 (F) is quantified versus day 0.
Figure 3
Figure 3
Number and dynamics of TCRβs sequences classified as expanded. (A). Number of expanded TCRβs at time points after vaccination compared to day 0. Colors indicate the first time point at which the specific sequence was classified as expanded (red: day 7, blue: day 28, green: month 4-8). The classification of expansion was performed after pooling the replicates per time point (see Figure S4A for the classification based on comparisons of individual replicates between time points). The grey bars serve as a proxy for dynamics that are not induced by the vaccination, by classifying ‘expansion’ while permuting the post-vaccination and pre-vaccination time points. Specifically, we classified how many sequences would be considered ‘expanded’ in the pooled pre-vaccination samples, when compared to the indicated post-vaccination time points. (B). Dynamics of the sequences classified as expanded at day 7 and/or day 28: the total relative frequency of these sequences is shown. Solid lines indicate older individuals (over 65 years of age).
Figure 4
Figure 4
Sample overlap and coverage. (A). Fraction of the sample overlapping between two replicates from the same time point (see Methods). Comparisons between multiple samples of sorted cells (blue circles) and replicates generated by sequencing the same TCRβ library twice (red triangles). The open blue circles indicate samples from donor 292, which have a relatively high overlap due to a low TCRβ diversity (see also Figure S3). (B). TCRβ frequency in the largest replicate at which sequences start missing in the smallest replicate (see Methods). X marks indicate comparisons in which the most abundant TCRβ sequence did not overlap between both samples. (C). Cumulative frequency of the UMI-coverage, plotted as the fraction of UMIs supported by at least a given number of reads (horizontal axis). The vertical dashed line indicates a coverage of 3 reads per UMI, which was used as the minimum support to take a sequence into account in the analysis (see Methods).

References

    1. Tsang TK, Cauchemez S, Perera RAPM, Freeman G, Fang VJ, Ip DKM, et al. . Association between antibody titers and protection against influenza virus infection within households. J Infect Dis (2014) 210(5):684–92. doi: 10.1093/INFDIS/JIU186 - DOI - PMC - PubMed
    1. Katzelnick LC, Montoya M, Gresh L, Balmaseda A, Harris E. Neutralizing antibody titers against dengue virus correlate with protection from symptomatic infection in a longitudinal cohort. Proc Natl Acad Sci USA (2016) 113(3):728–33. doi: 10.1073/PNAS.1522136113 - DOI - PMC - PubMed
    1. Khoury DS, Cromer D, Reynaldi A, Schlub TE, Wheatley AK, Juno JA, et al. . Neutralizing antibody levels are highly predictive of immune protection from symptomatic SARS-CoV-2 infection. Nat Med (2021) 27(7):1205–11. doi: 10.1038/S41591-021-01377-8 - DOI - PubMed
    1. Wilkinson TM, Li CKF, Chui CSC, Huang AKY, Perkins M, Liebner JC, et al. . Preexisting influenza-specific CD4+ T cells correlate with disease protection against influenza challenge in humans. Nat Med (2012) 18(2):274–80. doi: 10.1038/NM.2612 - DOI - PubMed
    1. Pizzolla A, Nguyen THO, Smith JM, Brooks AG, Kedzierska K, Heath WR, et al. . Resident memory CD8+ T cells in the upper respiratory tract prevent pulmonary influenza virus infection. Sci Immunol (2017) 2(12):6970. doi: 10.1126/SCIIMMUNOL.AAM6970 - DOI - PubMed

Substances