

Impact of infection on proteome-wide glycosylation revealed by distinct signatures for bacterial and viral pathogens
- PMID: 37520696
- PMCID: PMC10384227
- DOI: 10.1016/j.isci.2023.107257
Impact of infection on proteome-wide glycosylation revealed by distinct signatures for bacterial and viral pathogens
Abstract
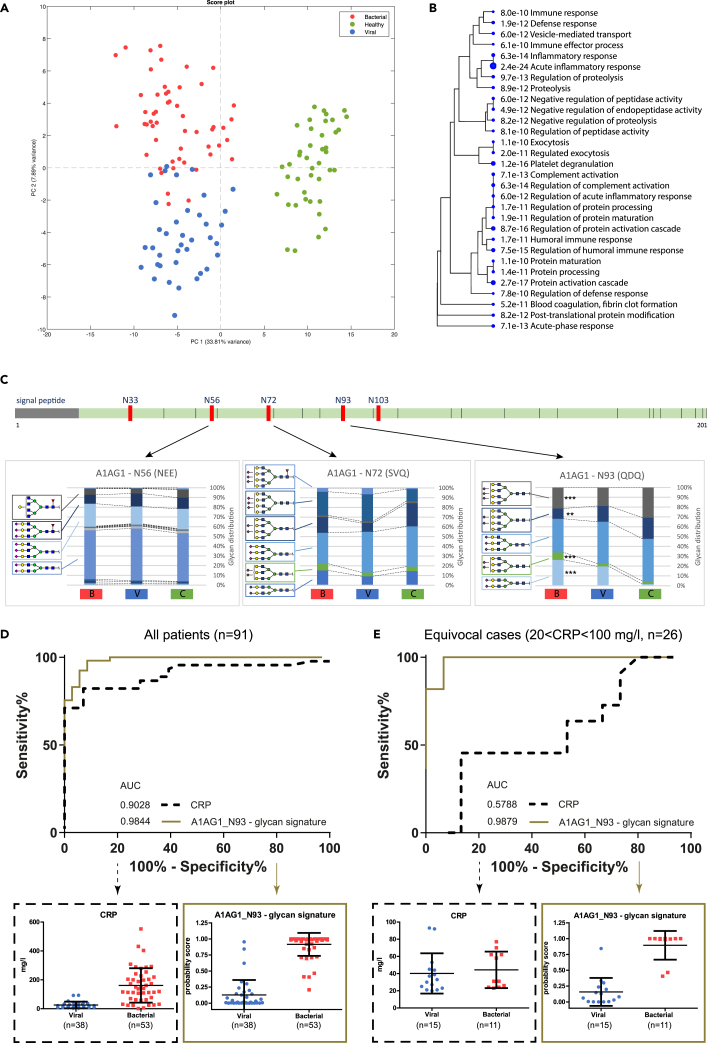
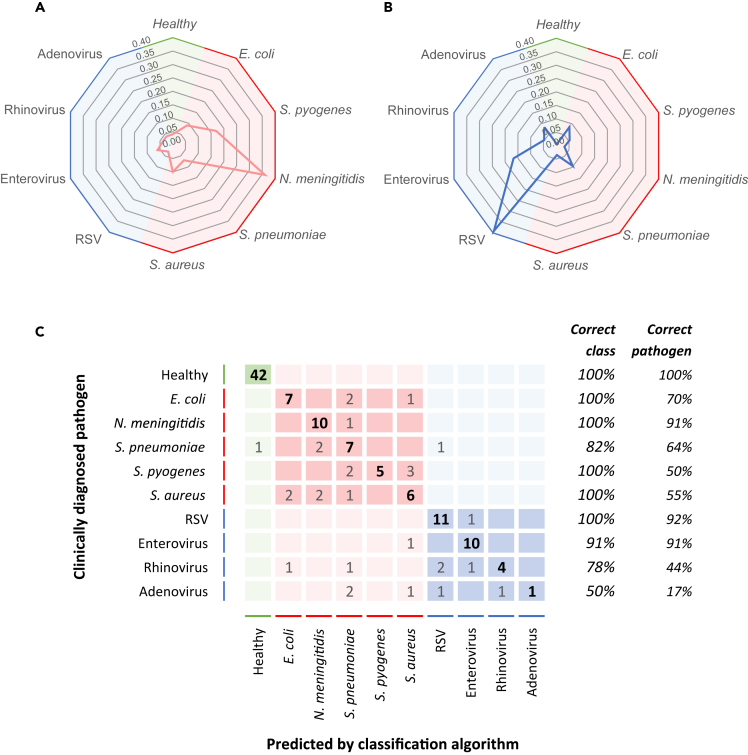
Mechanisms of infection and pathogenesis have predominantly been studied based on differential gene or protein expression. Less is known about posttranslational modifications, which are essential for protein functional diversity. We applied an innovative glycoproteomics method to study the systemic proteome-wide glycosylation in response to infection. The protein site-specific glycosylation was characterized in plasma derived from well-defined controls and patients. We found 3862 unique features, of which we identified 463 distinct intact glycopeptides, that could be mapped to more than 30 different proteins. Statistical analyses were used to derive a glycopeptide signature that enabled significant differentiation between patients with a bacterial or viral infection. Furthermore, supported by a machine learning algorithm, we demonstrated the ability to identify the causative pathogens based on the distinctive host blood plasma glycopeptide signatures. These results illustrate that glycoproteomics holds enormous potential as an innovative approach to improve the interpretation of relevant biological changes in response to infection.
Keywords: Glycobiology; Glycomics; Health sciences; Immunology.
© 2023 The Author(s).
Conflict of interest statement
The authors declare no competing interests.
Figures

 , whereas differentials that were high in the viral infection group are indicated by a blue color
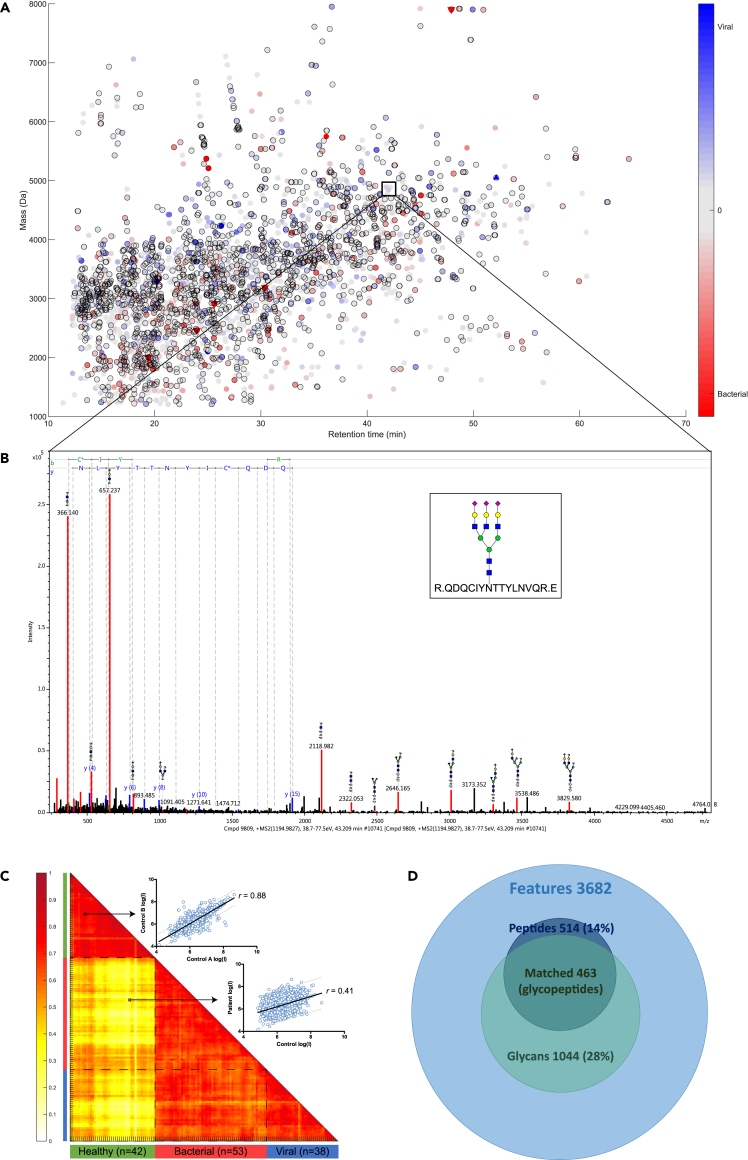
  . Differentials that were only detected in one of the two compared groups are indicated by a triangle▽. Significant univariate features determined by ANOVA are indicated by a black border ◯. (B) A representative MS/MS spectrum of a glycopeptide with typical oxonium B-ions masses, high mass glycan fragment Y-ions, and peptide fragment b- and y-ions. (C) A Pearson correlation matrix of the healthy group (n = 42) and the patient group (bacterial infection n = 53 and viral infection n = 38) with pooled Pearson’s correlation coefficient of r = 0.76. An example of a linear regression plot (log intensity scale) is shown for the correlation of 3,682 features (blue dots) between two healthy individuals (r = 0.88) and a healthy individual versus an individual with a bacterial infection (r = 0.41). (D) Venn diagram of the total amount of unique features (n = 3,682), of which 14% of peptide fractions were matched with the protein database and 28% of the N-glycan fractions were matched with the glycan database. Combined data resulted in 463 identified N-glycopeptides.
 .
.
References
-
- Lebrilla C.B., An H.J. The prospects of glycan biomarkers for the diagnosis of diseases. Mol. Biosyst. 2009;5:17–20. - PubMed
LinkOut - more resources
Full Text Sources
