. 2023 Jul 13;26(8):107374.
doi: 10.1016/j.isci.2023.107374. eCollection 2023 Aug 18.

Spatiotemporally organized immunomodulatory response to SARS-CoV-2 virus in primary human broncho-alveolar epithelia

Affiliations

Spatiotemporally organized immunomodulatory response to SARS-CoV-2 virus in primary human broncho-alveolar epithelia

Diana Cadena Castaneda et al. iScience. .

Abstract

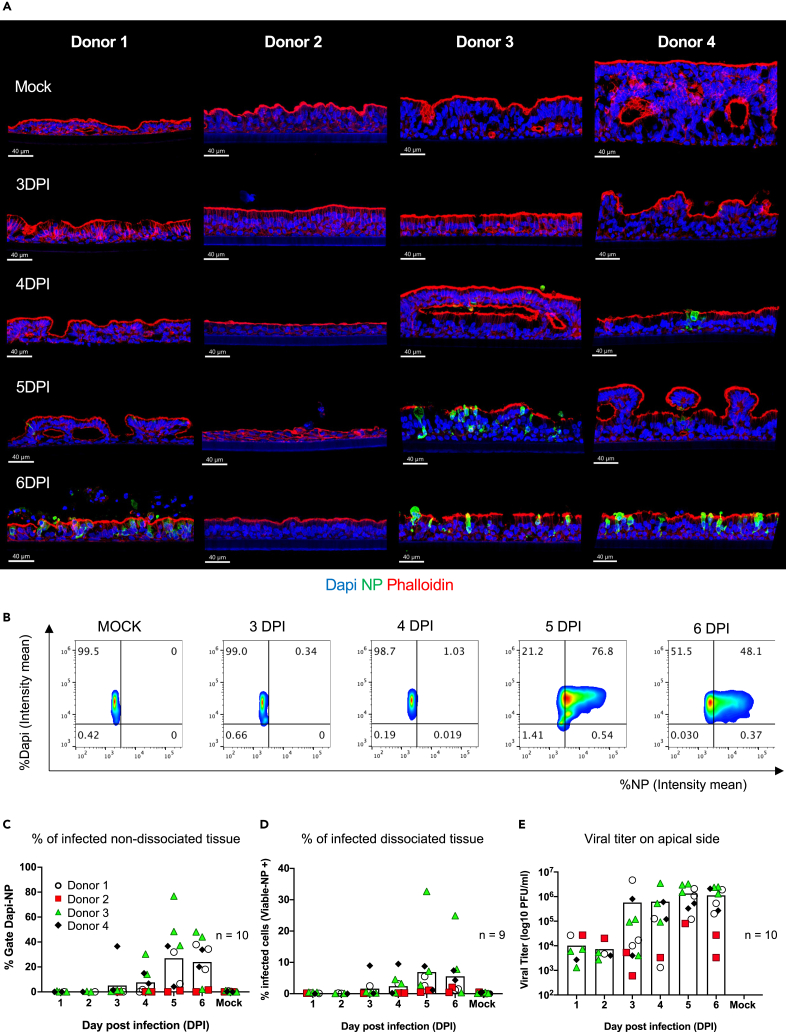
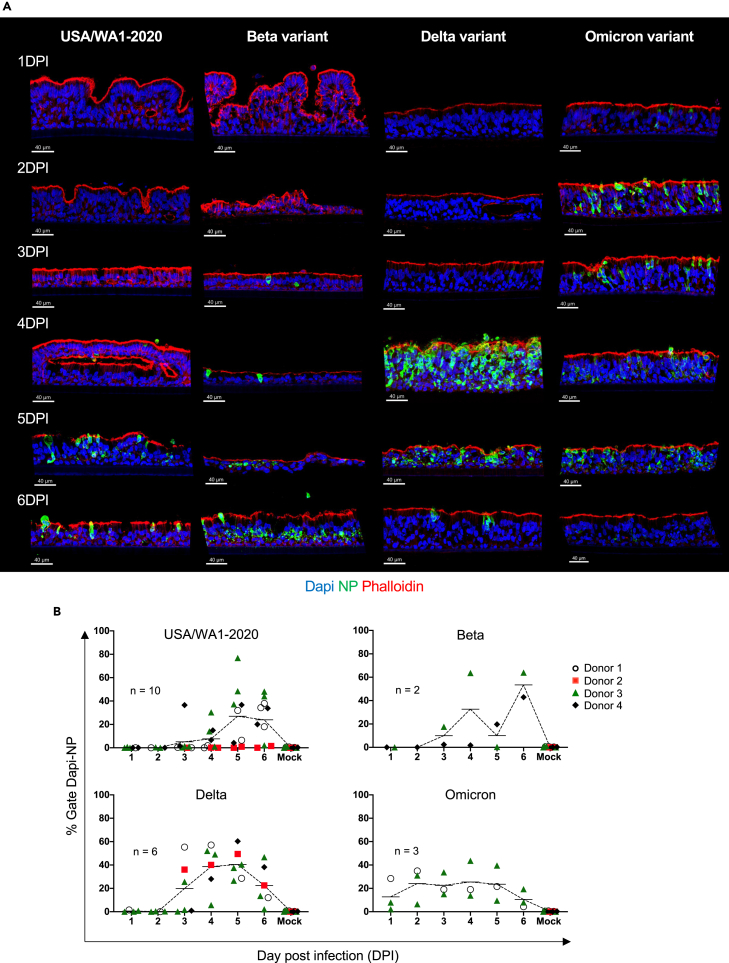
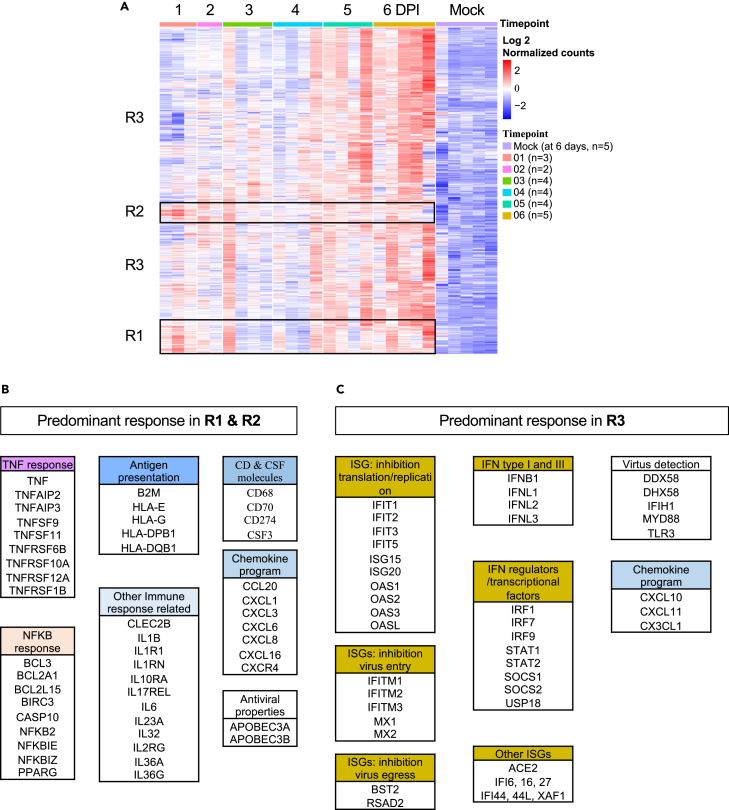
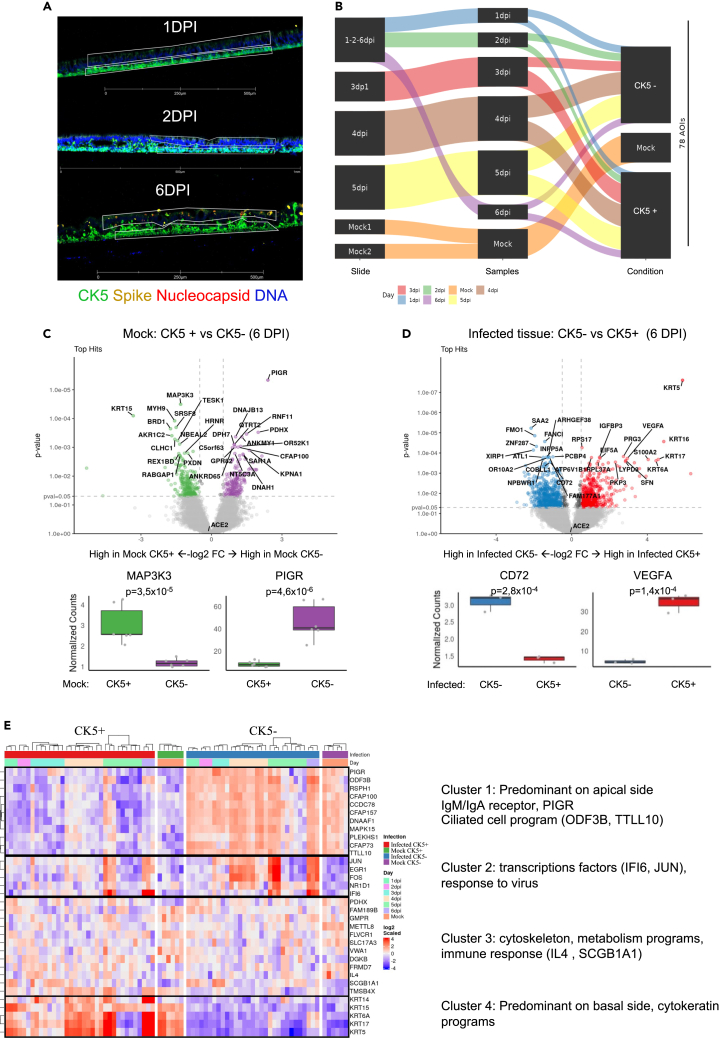
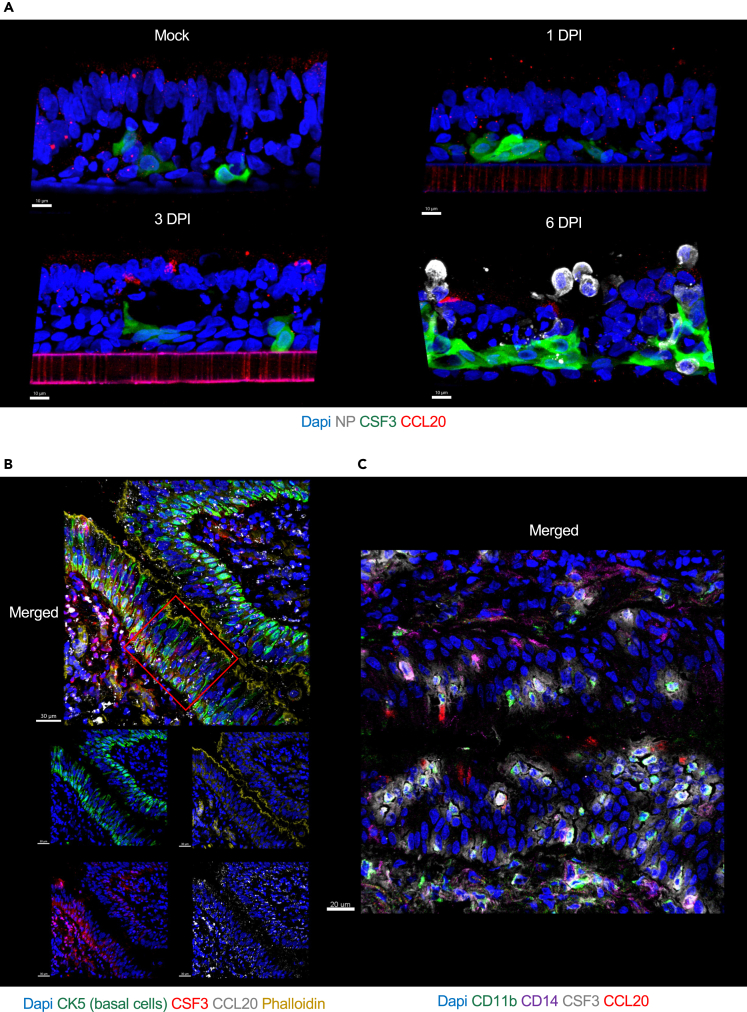
The COVID-19 pandemic continues to be a health crisis with major unmet medical needs. The early responses from airway epithelial cells, the first target of the virus regulating the progression toward severe disease, are not fully understood. Primary human air-liquid interface cultures representing the broncho-alveolar epithelia were used to study the kinetics and dynamics of SARS-CoV-2 variants infection. The infection measured by nucleoprotein expression, was a late event appearing between day 4-6 post infection for Wuhan-like virus. Other variants demonstrated increasingly accelerated timelines of infection. All variants triggered similar transcriptional signatures, an "early" inflammatory/immune signature preceding a "late" type I/III IFN, but differences in the quality and kinetics were found, consistent with the timing of nucleoprotein expression. Response to virus was spatially organized: CSF3 expression in basal cells and CCL20 in apical cells. Thus, SARS-CoV-2 virus triggers specific responses modulated over time to engage different arms of immune response.

Keywords: Immunology; Microbiology; biological sciences; molecular biology.


Conflict of interest statement

The A.G.-S. laboratory has received research support from GSK, Pfizer, Senhwa Biosciences, Kenall Manufacturing, Blade Therapeutics, Avimex, Johnson & Johnson, Dynavax, 7Hills Pharma, Pharmamar, ImmunityBio, Accurius, Nanocomposix, Hexamer, N-fold LLC, Model Medicines, Atea Pharma, Applied Biological Laboratories and Merck, outside of the reported work. A.G.-S. has consulting agreements for the following companies involving cash and/or stock: Castlevax, Amovir, Vivaldi Biosciences, Contrafect, 7Hills Pharma, Avimex, Pagoda, Accurius, Esperovax, Farmak, Applied Biological Laboratories, Pharmamar, CureLab Oncology, CureLab Veterinary, Synairgen, Paratus and Pfizer, outside of the reported work. A.G.-S. has been an invited speaker in meeting events organized by Seqirus, Janssen, Abbott, and Astrazeneca. A.G.-S. is inventor on patents and patent applications on the use of antivirals and vaccines for the treatment and prevention of virus infections and cancer, owned by the Icahn School of Medicine at Mount Sinai, New York, outside of the reported work. The M.S. laboratory has received unrelated funding support in sponsored research agreements from Phio Pharmaceuticals, 7Hills Pharma, ArgenX, and Moderna. S.E.C. declares being an employee and stockholder at NanoString Technologies. K.P. is a stockholder in Cue Biopharma and Guardian Bio, scientific advisor to Cue Biopharma and Guardian Bio and co-founder of Guardian Bio. K.P. declares unrelated funding support from Guardian Bio (current) and MERCK (past). All additional authors declare no competing interests.

Figures

None
Graphical abstract
Figure 1
Figure 1
Primary human lung organoid-derived air-liquid interface (ALI) cultures (A) Representative immunofluorescence staining (IF) of tissue section (8 μm) from differentiated lung organoid-derived ALI cultures of one donor (Donor 2; upper part, merged figure; lower part two-channel figures), showing markers for basal cells (CK5, white), goblet cells (MUC5AC, cyan), club cells (SCGB1A1, green), ciliated cells (acetylated a-tubulin, red) and Nuclei (Dapi, blue). Scale bar 40 μm, in white on the left corner. (B) Quantification of cell types in differentiated primary human lung-derived organoid ALI cultures per donor by histocytometry based on mean staining intensity for the indicated markers from IF scans. Normalized bar graphs represent the percentages of cell markers per donor and were generated using Prism 8 GraphPad. Data shown are representative of 3 independent experiments per donor with 1 replicate per experiment. See also Figure S1 and Table S1.
Figure 2
Figure 2
Primary human lung organoid-derived ALI cultures are permissive to SARS-CoV-2 infection (USA/WA1-2020, Wuhan-like virus) (A) Representative images per donor of mock-infected (first line, controls media without virus at 6 days) and infected ALI with SARS-CoV-2 (105 PFU) from 3 to 6 days post infection (DPI) stained for nuclei (Dapi), viral nucleoprotein (NP, green) to reveal the effective viral replication and phalloidin (Actin filament, red) to reveal tissue structure. Scale bar 40 μm, in white on the left corner. (B) Representative histocytometry plots on uninfected and infected lung-derived organoids ALI cultures (donor 3) from 3 to 6 DPI. Each dot plot represents the pooling of three consecutive sections, 8 μm thick, showing the mean staining intensity for cell populations positive for Dapi (Y axis) and viral NP (X axis). The NP (for viral infection) channel was generated in Imaris 9.4 using the Channel Arithmetics Xtension prior to running surface creation to identify Dapi-NP cells in images. Statistics were exported for each surface and imported into FlowJo v10.3 for image analysis. (C–E) Quantification of SARS-CoV-2 infection in ALI cultures by different methods: (C) Histocytometry (left scatterplot with bar graph) based on Dapi and NP signal. (D) Flow cytometry (middle scatterplot with bar graph), based on cell viability and NP signal. (E) Viral titer (right scatterplot with bar graph) based on the number of plaques visualized by staining (see STAR Methods). Data shown are representative of 9–10 independent experiments with at least 2 independent experiments per donor (four donors). Each replicate corresponds to viral titer, or the intensity mean percentage for histocytometry and flow cytometry data, represented by shape and color: Donor 1, white circle; donor 2 red square; donor 3 green triangle; and donor 4 black diamond. Bars indicate mean. See also Figure S2 and Table S2.
Figure 3
Figure 3
Primary human lung organoid-derived ALI cultures infected with SARS-CoV-2 variants (A) Representative images (USA/WA1-2020, Delta, and Omicron tissue from donor 3 and Beta variant donor 4) per variant of infected ALI with SARS-CoV-2 (105 PFU) from 1 to 6 days post infection (DPI) stained for nuclei (Dapi), viral nucleoprotein (NP, green) to reveal the effective viral replication and phalloidin (Actin filament, red) to reveal tissue structure. Scale bar 40 μm, in white on the left corner. (B) Quantification of SARS-CoV-2 infection in ALI cultures by histocytometry per strain: USA/WA1-2020 (top-left scatter line plot graph); Beta (top-right scatter line plot graph); (Delta (bottom-left scatter line plot graph); Omicron (bottom-right scatter line plot graph) based on Dapi and NP signal. Data shown are representatives of at least 2 independent experiments per variant. Each replicate corresponds to the intensity mean percentage represented by shape and color: Donor 1, white circle; donor 2 red square; donor 3 green triangle; and donor 4 black diamond. Line indicates mean. See also Figures S3, S4, and Table S3.
Figure 4
Figure 4
Transcriptional analysis of SARS-CoV-2 (Wuhan-like) infected ALI (A) Heatmap representing differentially expressed genes (DEG, 1081 transcripts: Log 2 normalized counts) from the comparison 6 DPI vs. time-matched mock-infected control (at 6 days) over time in response to SARS-CoV-2. ALI from four donors were infected with SARS-CoV-2 and harvested for sequencing at 1, 2, 3, 4, 5, and 6 dpi and mock-infected samples collected after 6 days (controls media without virus). The sequencing was performed in multiple batches with at least 2 independent experiments at each time point, the cutoff used: cutoff: logFC > 1; adjusted p value < 0.01. Rows represent individual transcripts and columns represent individual biological replicates ordered by time point. Donor 2 did not show significant response to USA/WA1-2020 infection and was removed from the analysis. Mock-infected samples from one of the batches (donor 1) showed significant differences to the mock-infected samples from different batches and were removed from the analysis as well. Batch effect was removed using SVAseq R package. (B) List of predominant signatures identified in clusters R1 & R2 (early response, robust up-regulation starting at 1 DPI). (C) List of predominant signatures identified in cluster R3 (late response, robust up-regulation at 5-6 DPI) in response to SARS-CoV-2. See also Table S4.
Figure 5
Figure 5
Transcriptional response to SARS-CoV-2 variants (A) Heatmap representing differentially expressed genes over the time in response to SARS-CoV-2 variants. ALI from four donors were infected with SARS-CoV-2 and harvested for sequencing at 1, 2, 3, 4, 5, and 6 dpi and mock-infected (control media without virus) samples collected from 1 to 6 days as well. The sequencing was performed in multiple batches with at least 2 independent experiments at each time point, the cutoff used: |logFC| > 1; adjustedpvalue < 0.01; normalized counts > 10. Rows represent individual transcripts and columns represent individual biological replicates ordered by timepoints and SARS-CoV-2 variants. Donor 2 did not show significant response to USA/WA1-2020 infection and was removed from the analysis only for Wuhan-like virus. Mock-infected samples from one of the batches (donor 1) showed significant differences to the mock-infected samples from different batches and were removed from the analysis as well. Batch effect was removed using SVAseq R package. (B) Line plots graphs representing the evolution over time of “epithelium, cilium and homeostasis programs,” cluster R4. (C) Early inflammation & immune responses, cluster R5. (D) Late IFN response, cluster R6. Clusters of transcripts in response to SARS-CoV-2 variants, were generated in GraphPad Prism 8. Each dot corresponds to the mean of genes in each cluster per time point and per strain. See also Figure S5 and Table S5.
Figure 6
Figure 6
GeoMX digital spatial profiling of SARS-CoV-2 infected ALI (A) Representative images of infected ALI sections with SARS-CoV-2 (105 PFU, from up to bottom), 1 DPI, 2 DPI, 6 DPI stained for nuclei (Dapi), viral nucleoprotein (red), spike viral protein (yellow), and cytokeratin 5 (CK5). The thin white polygons represent the ROI strategy selection for the apical cytokeratin 5- cells (CK5-) vs. basal side CK5+. Scale bar 500 μm for 1 and 6 DPI; and 1 mm for 2 DPI (white). (B) Schematic experimental design for ROI selection per slide, time point (1–6 DPI) condition (infected or mock-infected control at 6 days) and apical or CK5+, a total of 78 ROI were selected (C and D) Volcano plots visualizing significant differentially expressed genes between two groups of samples (X axis, Log2 FC and Y axis, p value < 0.05), boxplot represents relevant top hit up-regulated in each region (CK5+ or CK5-). (C) Comparison Mock CK5+ vs. Mock CK5- (6DPI). (D) Comparison Infected CK5- vs. Infected CK5+ 6DPI). (E) Heatmap representing the 33 tops differentially expressed genes (DEG) comparing conditions per location-infection status, then per timepoint (1–6 DPI). The sequencing was performed in 2 batches with at least 3 replicates per condition from two representative experiment (donor 3 for slides #1, #2, #4 and #5; on slide #4, 2 sections from donor 4 and one from donor 3). See also Figure S6 and Table S6.
Figure 7
Figure 7
CSF3 and CCL20 expression in ALI exposed to SARS-CoV-2 USA-WA1/2020 and in human lung epithelium (A) Representative images of ALI (donor 3) mock-infected at 6 days and ALI infected with SARS-CoV-2 USA/WA1-2020 (105 PFU) at 1, 3, and 6 days-post infection (DPI) stained for nuclei (Dapi, blue), viral NP (white) to reveal the effective viral replication, CSF3 (green) and CCL20 (red). Scale bars 10 μm, in white on the left corner. (B) Representative images of human lung epithelium (Donor 1) stained for nuclei (Dapi, blue), CK5 (green), phalloidin (Actin filament, dark yellow), CSF3 (red), and CCL20 (white). Scale bars 30 μm, in white on the left corner. (C) Representative zoomed image of human lung epithelium (Donor 1) stained for nuclei (Dapi, blue), CD11b (green), CD14 (magenta), CSF3 (white), and CCL20 (red). Scale bars 20 μm in white on the left corner. See also Figure S7.

Update of

References

    1. Blanco-Melo D., Nilsson-Payant B.E., Liu W.C., Uhl S., Hoagland D., Møller R., Jordan T.X., Oishi K., Panis M., Sachs D., et al. Imbalanced Host Response to SARS-CoV-2 Drives Development of COVID-19. Cell. 2020;181:1036–1045.e9. doi: 10.1016/j.cell.2020.04.026. - DOI - PMC - PubMed
    1. Rathnasinghe R., Jangra S., Ye C., Cupic A., Singh G., Martínez-Romero C., Mulder L.C.F., Kehrer T., Yildiz S., Choi A., et al. Characterization of SARS-CoV-2 Spike mutations important for infection of mice and escape from human immune sera. Nat. Commun. 2022;13:3921–3934. doi: 10.1038/s41467-022-30763-0. - DOI - PMC - PubMed
    1. Flerlage T., Boyd D.F., Meliopoulos V., Thomas P.G., Schultz-Cherry S. Influenza virus and SARS-CoV-2: pathogenesis and host responses in the respiratory tract. Nat. Rev. Microbiol. 2021;19:425–441. doi: 10.1038/s41579-021-00542-7. - DOI - PMC - PubMed
    1. Li B.N., Chui C.K., Chang S., Ong S.H. RSEM: Accurate transcript quantification from RNA-Seq data with or without a reference genome. Comput. Biol. Med. 2011;41:1–10. doi: 10.1186/1471-2105-12-323/TABLES/6. - DOI - PMC - PubMed
    1. Langmead B., Trapnell C., Pop M., Salzberg S.L. Ultrafast and memory-efficient alignment of short DNA sequences to the human genome. Genome Biol. 2009;10:R25. doi: 10.1186/GB-2009-10-3-R25/TABLES/5. - DOI - PMC - PubMed