. 2023 Jul 10;26(8):107298.
doi: 10.1016/j.isci.2023.107298. eCollection 2023 Aug 18.

Voluntary exercise does not always suppress lung cancer progression

Affiliations

Voluntary exercise does not always suppress lung cancer progression

Aurelia C Leimbacher et al. iScience. .

Abstract

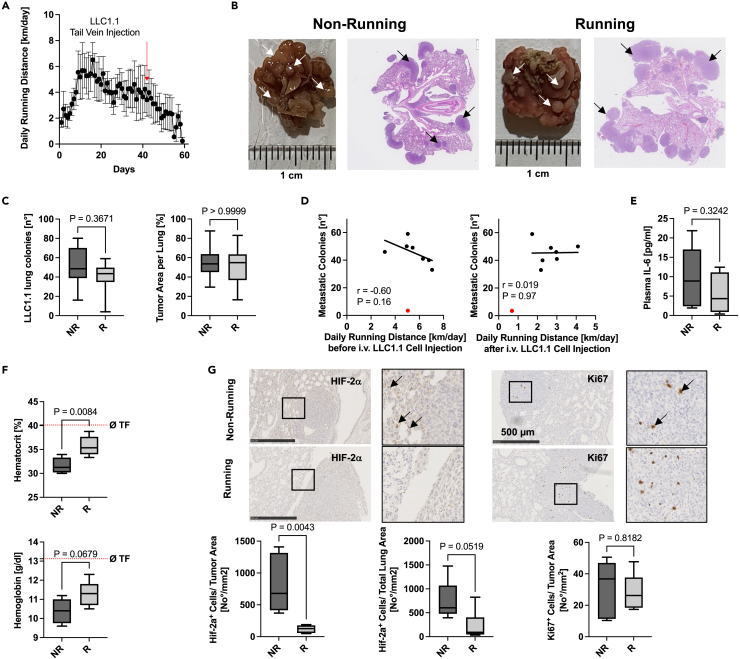
Physical exercise can lower lung cancer incidence. However, its effect on lung cancer progression is less understood. Studies on exercising mice have shown decreased ectopic lung cancer growth through the secretion of interleukin-6 from muscles and the recruitment of natural killer (NK) cells to tumors. We asked if exercise suppresses lung cancer in an orthotopic model also. Single-housed C57Bl/6 male mice in cages with running wheels were tail vein-injected with LLC1.1 lung cancer cells, and lung tumor nodules were analyzed. Exercise did not affect lung cancer. Therefore, we also tested the effect of exercise on a subcutaneous LLC1 tumor and a tail vein-injected B16F10 melanoma model. Except for one case of excessive exercise, tumor progression was not influenced. Moderately exercising mice did not increase IL-6 or recruit NK cells to the tumor. Our data suggest that the exercise dose may dictate how efficiently the immune system is stimulated and controls tumor progression.

Keywords: Cancer; Immunology.


Conflict of interest statement

The authors declare that the research was conducted without any commercial or financial relationships that could be construed as a potential conflict of interest.

Figures

None
Graphical abstract
Figure 1
Figure 1
The effect of voluntary exercise in running wheels on LLC1.1 tumor growth in lungs of C57Bl/6 mice C57Bl/6 male mice were single-housed in cages with an open (running) or blocked running wheel (non-running). After six weeks, LLC1.1 lung cancer cells were tail vein injected (3.3 x 10⁵ cells in 100 μL HBSS). Mice were placed back into their cages. Lungs were isolated 15–17 days after cancer cell injection when body weight dropped by 6%. (A and B) Shown is the average and standard deviation of the daily running distance of 8 mice kept in cages with an open running wheel before (day 0–44) and after LLC1.1 tail vein injection. Panel B shows representative images of LLC1.1 tumor nodules (left panels) in the lungs of non-running and running mice 15–17 days after the tail vein injection of LLC1.1 cells. The right panels show representative hematoxylin/eosin-stained lung sections of non-running and running mice. Arrows indicate tumor nodules on isolated lungs (white arrows) and hematoxylin/eosin-stained lung sections (black arrows, right). (C) Shown is the count of LLC1.1 tumor nodules per lung (left panel) and the ratio of tumor to total lung area estimated from hematoxylin/eosin-stained lung section (right panel) of non-running (NR) and running (R) mice 15–17 days after the tail vein injection of LLC1.1 cells (n = 8). (D–G) Shown is the Pearson correlation analysis of the tumor nodule count (y axis) vs. average daily running distance (x axis) of individual mice before (left panel) and after tail vein injection of LLC1.1 lung cancer cells (right panel). The red data points were excluded as outliers from the analysis. Further shown are E interleukin 6 (IL-6) levels in the blood and F hematocrit (upper panel) and hemoglobin (lower panel) of LLC1.1 tail vein-injected non-running (NR) and running mice (R) 15–17 days after the tail vein injection of LLC1.1 cells (n = 5–6). The red dotted line indicates the average (Ø) value of four tumor-free (TF) mice. Panel G shows representative images of immunohistochemically analyzed lung sections of LLC1.1 tail vein-injected non-running (images upper row) and running (images lower row) mice 15–17 days after the tail vein injection of LLC1.1 cells. The sections were probed for HIF-2α (left panels) and Ki67 (right panels). The black arrows indicate Ki67 and HIF-2α positive cells. Further shown is the quantification of Ki67 and HIF-2α positive lung sections (lower panels) normalized to tumor area (left and middle panel) and normalized to total lung area (right panel) of LLC1.1 tail vein-injected non-running (NR) and running mice (R) (n = 5–6). Data are shown as boxplots with min to max whiskers and were analyzed using a Student’s t test.
Figure 2
Figure 2
The effect of voluntary exercise in running wheels on B16F10 melanoma growth in lungs of C57Bl/6 mice C57Bl/6 male mice were single-housed in cages with an open (running) or blocked running wheel (non-running) for four weeks. After four weeks, B16F10 melanoma cells were tail vein injected (2 x 10⁵ cells in 100 μL HBSS). Mice were placed back into their cages with either open or blocked running wheels. Lungs were isolated 16 days after injection. Two independent experiments were performed. (A and B) Shown is a representative graph (experiment 1) of the average and standard deviation of the daily running distance of 8 mice kept in cages with an open running wheel before (day 0–28) and after the tail vein injection of B16F10 melanoma cells. Panel B shows representative images of black B16F10 tumor nodules in the lungs of non-running (left) and running (right) mice 16 days after the tail vein injection of B16F10 cells. (C–G) Shown is the count of B16F10 tumor nodules in the lungs of non-running (NR) and running (R) mice from experiment 1 (left panel) and experiment 2 (right panel) 16 days after the tail vein injection of B16F10 cells. Data are shown as boxplots with min to max whiskers and were analyzed using a Student’s test. (n = 8–11). Panel D shows the Pearson correlation analysis of tumor nodule count (y axis) vs. average daily running distance (x axis) of individual mice before (left panel) and after (right panel) tail vein injection of B16F10 melanoma cells. The red data points were excluded from the Pearson correlation analysis (outlier). Further shown are E Interleukin (IL-6) levels in the blood and F hematocrit (left panel) and hemoglobin (right panel) of B16F10 tail vein-injected non-running (NR) and running mice (R) (n = 5–6). Data are shown as boxplots with min to max whiskers and were analyzed using a Student’s t test. The red dotted line indicates the average (Ø) value of four tumor-free (TF) mice. Panel G shows immune cell infiltration into B16F10 tumor nodules in representative hematoxylin/eosin-stained lung sections with score 0 (left panel, no immune cell infiltration), score 1 (middle panel, moderate immune cell infiltration without tissue damage), and score 2 (right panel, immune cell infiltration with tissue damage). The score of immune cell infiltration at the metastasis edges was assessed blinded, and data are shown in the table below (n = 8–11). The arrows indicate lymphocytes (arrow 1), neutrophilic granulocytes (arrow 2), macrophages (arrow 3), and apoptotic cells (arrow 4).
Figure 3
Figure 3
The effect of voluntary exercise in running wheels on subcutaneous LLC1 tumor growth in C57Bl/6 mice C57Bl/6 male mice were single-housed in cages with an open (running) or blocked running wheel (non-running) for four weeks. After four weeks, LLC1 lung cancer cells were subcutaneously injected (5 x 10⁵ cells in 100 μL HBSS/Matrigel). Mice were placed back into their cages with either open or blocked running wheels. Tumors were isolated and weighed 21 days after implantation. The experiment was repeated independently three times (experiments 1–4). (A) Shown is a representative graph (experiment 1) of the average and standard deviation of the daily running distance of 8 mice kept in cages with an open running wheel before (day 0–30) and after LLC1 implantation (day 31–48). (B) Shown is the tumor weight of non-running (NR) and running (R) mice 21 days post LLC1 cancer cell implantation. Data are shown as a scatter dot blot and median indicating the tumor weight of individual non-running mice (black circles in all panels) and running mice from the first (green circles, upper left panel), second (purple circles, upper right panel), third (blue circles, lower left panel), and fourth (red circles, lower right panel) independent experiment (n = 7–10). A Student’s t test or a Mann-Whitney test (Experiment 2) was performed. (C) Shown is the Spearman correlation analysis of tumor weight (y axis) vs. the average daily running distance (x axis) before (left panels) or after (right panels) tumor cell injections of individual mice from the first (purple), second (green), and third (blue) experiment with (upper panels, n = 64) and without (lower panels, n = 48) data of the 4th experiment (red). The black data points indicate the tumor weight of individual non-running mice at x = 0. (D) The left panel shows the overall tumor weight comparison of non-running (NR) and running (R) mice from the four independent experiments (first (green), second (purple), third (blue), and fourth (red)) (n = 32–35). The right panel shows the tumor weight of non-running (NR), short-distance (average daily running distance <15 km/day), and long-distance (average daily running distance >15 km/day) running mice (n = 7–35). A Student’s t test or a one-way ANOVA with Bonferroni post hoc test was performed.
Figure 4
Figure 4
The effect of voluntary exercise in running wheels on muscle-derived interleukin 6 in subcutaneous LLC1 tumor-bearing C57Bl/6 mice C57Bl/6 male mice were single-housed in cages with an open (running) or blocked running wheel (non-running) for four weeks. After four weeks, LLC1 lung cancer cells were subcutaneously injected (5 x 10⁵ cells in 100 μL HBSS/Matrigel). Mice were placed back into their cages. 21 days after implantation, tumors, quadriceps, gastrocnemius, and blood plasma were isolated during high exercise activity at night (dark phase). (A) Shown are interleukin (IL-6) levels in the blood plasma of non-running (NR) and running mice (R) 21 days after the subcutaneous LLC1 cell implantation (n = 7–8). (B) Shown are mRNA levels of interleukin 6 (Il-6) in quadriceps (left panel) and gastrocnemius (right panel) of non-running (NR) and running mice (R) 21 days after the subcutaneous LLC1 cell implantation quantified by qPCR and normalized to β-actin (Actb) mRNA expression levels (n = 5–8). (C) Shown are Pearson correlation analyses of IL-6 plasma levels (left panel) and Il-6 mRNA expression levels in quadriceps (middle panel) and gastrocnemius (right panel) vs. average daily running distance (x axis) of individual mice. (D) The left panel shows mRNA levels of Il-6 in tumors of non-running (NR) and running mice (R) 21 days after the subcutaneous LLC1 cell implantation quantified by qPCR and normalized to Actb mRNA expression levels (n = 6–8). The right panel shows a Pearson correlation analysis of Il-6 mRNA expression levels in tumors (y axis) vs. average daily running distance (x axis) of individual mice. (E) Shown are Il-6 mRNA levels in the liver of tumor-free (TF), non-running (NR), and running mice (R) 21 days after the subcutaneous LLC1 cell implantation quantified by qPCR and normalized to Actb mRNA expression levels (n = 7–8). Data are shown as boxplots with min to max whiskers and were analyzed using a Student’s t test, a Mann-Whitney test, or a Kruskal Wallis test with Dunn’s multiple comparison tests (panel E). Ø TF and the red dotted line indicate the average (Ø) value of tumor-free (TF) mice (n = 5–8).
Figure 5
Figure 5
The effect of voluntary exercise in running wheels on the immune cell response in subcutaneous LLC1 tumor-bearing C57Bl/6 mice C57Bl/6 male mice were single-housed in cages with an open (running) or blocked running wheel (non-running) for four weeks. After four weeks, LLC1 lung cancer cells were subcutaneously injected (5 x 10⁵ cells in 100 μL PBS/Matrigel). Mice were placed back into their cages. 21 days after implantation, blood and tumors were isolated. Immune cells in the blood were analyzed by flow cytometry and in the tumors by immunofluorescence and immunohistochemistry, respectively. Tumor inflammation was analyzed by qPCR. (A–D) Shown are interleukin 1b (Il-1b), interleukin 3 (Il-3), interleukin 17a (Il-17a), transforming growth factor β (Tgfb), tumor necrosis factor alpha (Tnfa), interferon-gamma (Infg), and inducible nitric oxide synthase (iNos) mRNA levels (upper panel) and natural cytotoxicity triggering receptor 1(Ncr1) NKp46, killer cell lectin-like receptor subfamily K (Klrk1) NKG2-D, CD68 antigen (Cd68), CD209 antigen (Cd209a), forkhead box P3 (Foxp3), CD74 antigen (Cd74), and CD8 antigen, alpha chain (Cd8a) mRNA levels (lower panel) in LLC1 tumors of non-running (NR) and running mice (R) 21 days after the subcutaneous LLC1 cell implantation quantified by qPCR and normalized to β-actin (Actb) mRNA expression levels (n = 6–8). Panel B shows representative images of tumor and spleen paraffin sections of non-running (NR) and running (R) LLC1 tumor-bearing cells analyzed by immunofluorescence (upper panels) and immunohistochemistry (lower panels) for the presence of NK cells. The upper panels show immunofluorescence signals specific for NK1.1 (red) in tumors of non-running (left panel) and running (middle panel) LLC1 tumor-bearing mice as well as in the spleen (positive control) of tumor-free mice (right panel) using the MA1-70100 NK1.1 antibody (Thermo Fisher, Switzerland). DAPI (blue) was used to counterstain the tissue sections. The lower panels show immunohistochemical signals specific for NK1.1 using the BS-4682R NK1.1 antibody (BIOSS, US) in tumors of running LLC1 tumor-bearing mice with (left panel) and without the primary NK1.1 antibody (middle panel, negative control) as well as in the spleen of tumor-free mice (right panel, positive control). The brown signal (orange arrows) in the right panel indicates hemosiderin deposits. Panel C shows the proportion of CD3 lymphocytes (left panel), B cells (middle panel), and NK cells (right panel) in the blood of non-running (NR) and running (R) mice analyzed by flow cytometry 21 days after the subcutaneous LLC1 cancer cell implantation (n = 4–5). Panel D shows the proportion of subpopulations of NK cells with differential CD27 and CD11b expression, indicating the NK maturation stages and functions in non-running (NR) and running (R) LLC1 tumor-bearing mice analyzed by flow cytometry. Shown are CD27-/CD11b cells (left upper panel), CD27+/CD11b cells (right upper panel), CD27+/CD11b+ cells (left lower panel3), and CD27-/CD11b+ cells (right lower panel) in the blood of non-running (NR) and running (R) LLC1 tumor-bearing mice (n = 4–5). (E) Shown is the proportion of CD3+ cells (left panel), CD4+ cells (middle panel), and CD8+ cells (right panel) in the blood of non-running (NR) and running (R) LLC1 tumor-bearing mice analyzed by FACS 21 days after the subcutaneous LLC1 injection (n = 4–5). Data are shown as boxplots with min to max whiskers and were analyzed using a Student’s t test or a Mann-Whitney test.

References

    1. Moore S.C., Lee I.M., Weiderpass E., Campbell P.T., Sampson J.N., Kitahara C.M., Keadle S.K., Arem H., Berrington de Gonzalez A., Hartge P., et al. Association of Leisure-Time Physical Activity With Risk of 26 Types of Cancer in 1.44 Million Adults. JAMA Intern. Med. 2016;176:816–825. doi: 10.1001/jamainternmed.2016.1548. - DOI - PMC - PubMed
    1. Ashcraft K.A., Peace R.M., Betof A.S., Dewhirst M.W., Jones L.W. Efficacy and Mechanisms of Aerobic Exercise on Cancer Initiation, Progression, and Metastasis: A Critical Systematic Review of In Vivo Preclinical Data. Cancer Res. 2016;76:4032–4050. doi: 10.1158/0008-5472.CAN-16-0887. - DOI - PMC - PubMed
    1. Pedersen L., Christensen J.F., Hojman P. Effects of exercise on tumor physiology and metabolism. Cancer J. 2015;21:111–116. doi: 10.1097/PPO.0000000000000096. - DOI - PubMed
    1. Hojman P., Gehl J., Christensen J.F., Pedersen B.K. Molecular Mechanisms Linking Exercise to Cancer Prevention and Treatment. Cell Metabol. 2018;27:10–21. doi: 10.1016/j.cmet.2017.09.015. - DOI - PubMed
    1. Morishita S., Hamaue Y., Fukushima T., Tanaka T., Fu J.B., Nakano J. Effect of Exercise on Mortality and Recurrence in Patients With Cancer: A Systematic Review and Meta-Analysis. Integr. Cancer Ther. 2020;19 doi: 10.1177/1534735420917462. - DOI - PMC - PubMed

LinkOut - more resources