. 2023 Jul 14:17:1214485.
doi: 10.3389/fnhum.2023.1214485. eCollection 2023.

Listening efficiency in adult cochlear-implant users compared with normally-hearing controls at ecologically relevant signal-to-noise ratios

Affiliations

Listening efficiency in adult cochlear-implant users compared with normally-hearing controls at ecologically relevant signal-to-noise ratios

Francisca Perea Pérez et al. Front Hum Neurosci. .

Abstract

Introduction: Due to having to work with an impoverished auditory signal, cochlear-implant (CI) users may experience reduced speech intelligibility and/or increased listening effort in real-world listening situations, compared to their normally-hearing (NH) peers. These two challenges to perception may be usefully integrated in a measure of listening efficiency: conceptually, the amount of accuracy achieved for a certain amount of effort expended.

Methods: We describe a novel approach to quantifying listening efficiency based on the rate of evidence accumulation toward a correct response in a linear ballistic accumulator (LBA) model of choice decision-making. Estimation of this objective measure within a hierarchical Bayesian framework confers further benefits, including full quantification of uncertainty in parameter estimates. We applied this approach to examine the speech-in-noise performance of a group of 24 CI users (M age: 60.3, range: 20-84 years) and a group of 25 approximately age-matched NH controls (M age: 55.8, range: 20-79 years). In a laboratory experiment, participants listened to reverberant target sentences in cafeteria noise at ecologically relevant signal-to-noise ratios (SNRs) of +20, +10, and +4 dB SNR. Individual differences in cognition and self-reported listening experiences were also characterised by means of cognitive tests and hearing questionnaires.

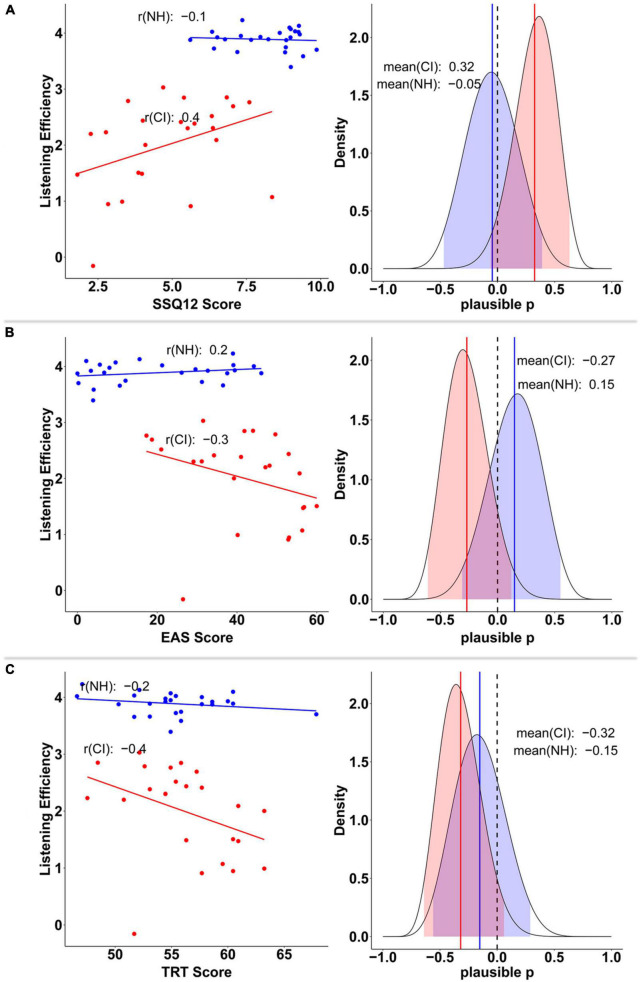
Results: At the group level, the CI group showed much lower listening efficiency than the NH group, even in favourable acoustic conditions. At the individual level, within the CI group (but not the NH group), higher listening efficiency was associated with better cognition (i.e., working-memory and linguistic-closure) and with more positive self-reported listening experiences, both in the laboratory and in daily life.

Discussion: We argue that listening efficiency, measured using the approach described here, is: (i) conceptually well-motivated, in that it is theoretically impervious to differences in how individuals approach the speed-accuracy trade-off that is inherent to all perceptual decision making; and (ii) of practical utility, in that it is sensitive to differences in task demand, and to differences between groups, even when speech intelligibility remains at or near ceiling level. Further research is needed to explore the sensitivity and practical utility of this metric across diverse listening situations.

Keywords: cochlear implants; decision-making model; ecological relevance; evidence accumulation model; linear ballistic accumulator; listening efficiency; listening effort; speech intelligibility.


Conflict of interest statement

The authors declare that the research was conducted in the absence of any commercial or financial relationships that could be construed as a potential conflict of interest.

Figures

FIGURE 1
FIGURE 1
Graphical representation of the accumulation process assumed by LBA model, created based on Donkin et al. (2011) and Nishiguchi et al. (2019) studies. Racing LBA accumulators representing hypothetical responses A and B, where A is the selected response that first reached the evidence threshold (b).
FIGURE 2
FIGURE 2
Schematic representation of the speech-in-noise task. (A) Example of an experimental run, whose blocks or experimental conditions are presented in easy, hard, and medium order (after randomization). Physiological measures (fNIRS and pupillometry) are recorded for the duration of the entire run. (B) Example of an experimental block, where sentence (S) and null trials (N) randomly presented, are masked by a continuous cafeteria background noise. During the inter-block pause, participants submit their subjective ratings. (C) Example of sentence and null trials with their corresponding tasks: indicating whether a probe word was featured in the sentence or submitting a specific response as instructed in null trials. Both trial types have approximately the same duration.
FIGURE 3
FIGURE 3
Model conditional effects over raw data for participants’ cognitive tests results by group (e.g., TRT∼ Group). Abbreviations refer to Text Reception Threshold (TRT) and Reading Span (RSpan) tests for both groups of cochlear implant (CI) and normally hearing (NH) participants. The error bars display 95% credible intervals; the bold dots represent posterior means, and the small dots represent the raw data. Scores for TRT and RSpan tests range between 0–100, with greater scores indicating worse performance. Note that RSpan scores were reversed so that greater scores represent less working memory capacity.
FIGURE 4
FIGURE 4
Model conditional effects over raw data for participants’ hearing questionnaires results by group (e.g., EAS∼ Group). The error bars display 95% credible intervals; the bold dots represent posterior means, and the small dots represent the raw data. The effort assessment scale (EAS) questionnaire has a score range between 0–60 points. The fatigue assessment scale (FAS) ranges between 0–40 points. The hearing handicap questionnaire (HHQ) has a score range of 0–100 points. The short version of the speech, spatial and qualities of hearing scale (SSQ12) was reverse scored, with a total range of 0–10 points. Greater scores in all questionnaires indicate greater hearing difficulty.
FIGURE 5
FIGURE 5
Group-difference Cliff’s Delta effect sizes with 95% credible intervals on the posterior distributions of cognitive tests (TRT, RSpan), hearing questionnaires (EAS, FAS, HHQ, SSQ12, MFQ.dif), and participants’ age. Positive Cliff’s Delta values indicate greater scores/results of participants in the CI group compared to the NH group (CI scores > NH scores). Abbreviations refer to Text Reception Threshold (TRT), Reading Span (RSpan) tests, Effort Assessment Scale (EAS), Fatigue Assessment Scale (FAS), Hearing Handicap Questionnaire (HHQ), short version of the Speech, Spatial and Qualities of hearing scale (SSQ12), and Momentary Fatigue Questionnaire (MFQ.dif) on the difference post-vs.-pre experiment.
FIGURE 6
FIGURE 6
Model conditional effects over raw data for participants’ task subjective ratings (self-perceived listening effort, intelligibility, and task disengagement) by Group and Condition {e.g., EF ∼ 0 + Intercept + Group:Condition + [1 | gr(Participant, by = Group)]}. The error bars display 95% credible intervals; the bold dots represent posterior means, and the small dots represent the raw data. Scores were measured in a 0–1 scale.
FIGURE 7
FIGURE 7
Posterior predictive checks per group (NH and CI group shown at the two top and bottom lines, respectively), trial type (sentence vs. null trials), and condition (Easy, Med, and Hard conditions shown from left to right columns). Participants’ response time (RT) for incorrect responses are plotted as negative. Solid dark lines represent the observed data and light blue lines represent the model predicted data (8,000 draws).
FIGURE 8
FIGURE 8
Posterior group comparison in LBA model’s parameters: t0, response caution, and differential drift rates (vDiff) per trial type (Sentence,Null), and condition (Easy, Med, and Hard). Solid lines in posterior distributions represent the predicted median index for each parameter.
FIGURE 9
FIGURE 9
Mean value and Slope across conditions of LBA model’s differential drift rates per trial type (Sentence, Null). Solid lines in posterior distributions represent the predicted median index for each parameter.
FIGURE 10
FIGURE 10
Posterior relative contribution of predictor variables to individual-sentence differential drift rate by group. Predictor variables are age, hearing questionnaires (EAS, FAS, SSQ12, and HHQ), and cognitive tests (TRT and RSpan) scores.
FIGURE 11
FIGURE 11
Relationship between listening efficiency and SSQ12 (A), EAS (B), and TRT (C) scores by group. Groups are plotted in red (CI) and blue (NH) colors. Plots on the left column display the posterior mean estimates of listening efficiency for each participant as a function of SSQ12, EAS, and TRT scores, respectively. Plots on the right column show the posterior distribution of the plausible population correlation (ρ) per each variable. In the later, colored solid lines and shaded areas, represent the mean, and 95% credible intervals, respectively.
FIGURE 12
FIGURE 12
Posterior relative contribution of task subjective measures (averaged across conditions) to individual-level listening efficiency by group. Predictor variables are participants’ perceived listening effort (AV_EF), intelligibility (AV_IN), and task disengagement (AV_TD).
FIGURE 13
FIGURE 13
Relationship between listening efficiency and both task subjective effort (A), and task subjective intelligibility (B) scores by group. Groups are plotted in red (CI) and blue (NH) colors. Plots on the left column display the posterior mean estimates of listening efficiency for each participant as a function of perceived effort and intelligibility, respectively. Plots on the right column show the posterior distribution of the plausible population correlation (ρ) per each variable. In the later, colored solid lines and shaded areas, represent the mean and 95% credible intervals, respectively.

References

    1. Alhanbali S., Dawes P., Lloyd S., Munro K. (2017). Self-reported listening-related effort and fatigue in hearing-impaired adults. Ear Hear. 38 e39–e48. 10.1097/AUD.0000000000000361 - DOI - PubMed
    1. Alhanbali S., Dawes P., Millman R., Munro K. (2019). Measures of listening effort are multidimensional. Ear Hear. 40 1084–1097. 10.1097/AUD.0000000000000697 - DOI - PMC - PubMed
    1. Anderson Gosselin P., Gagné J. (2011). Older adults expend more listening effort than young adults recognizing speech in noise. J. Speech Lang. Hear. Res. 54 944–958. 10.1044/1092-4388(2010/10-0069) - DOI - PubMed
    1. Annis J., Palmeri T. (2018). Bayesian statistical approaches to evaluating cognitive models. Wiley Interdiscip. Rev. Cogn. Sci. 9 10.1002/wcs.1458. 10.1002/wcs.1458 - DOI - PMC - PubMed
    1. Annis J., Miller B., Palmeri T. (2017). Bayesian inference with Stan: a tutorial on adding custom distributions. Behav. Res. Methods 49 863–886. 10.3758/s13428-016-0746-9 - DOI - PMC - PubMed

LinkOut - more resources