. 2023 May 15;4(7):100756.
doi: 10.1016/j.patter.2023.100756. eCollection 2023 Jul 14.

Connectome-based machine learning models are vulnerable to subtle data manipulations

Affiliations

Connectome-based machine learning models are vulnerable to subtle data manipulations

Matthew Rosenblatt et al. Patterns (N Y). .

Abstract

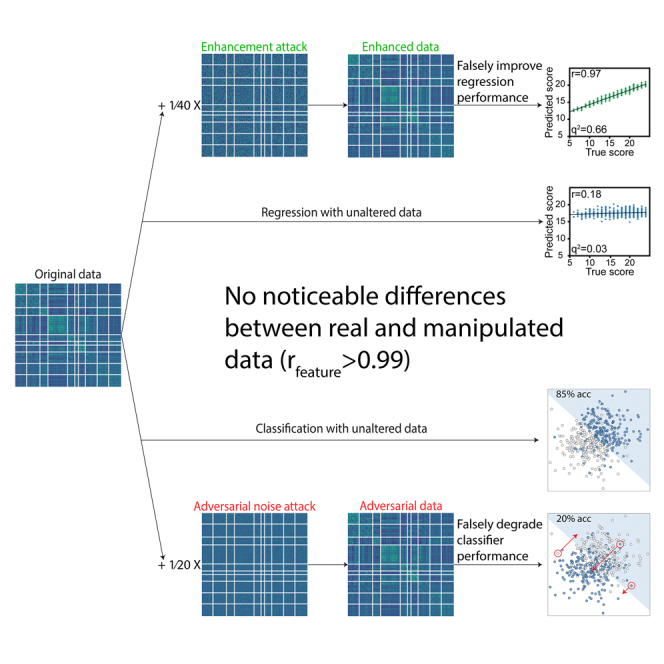
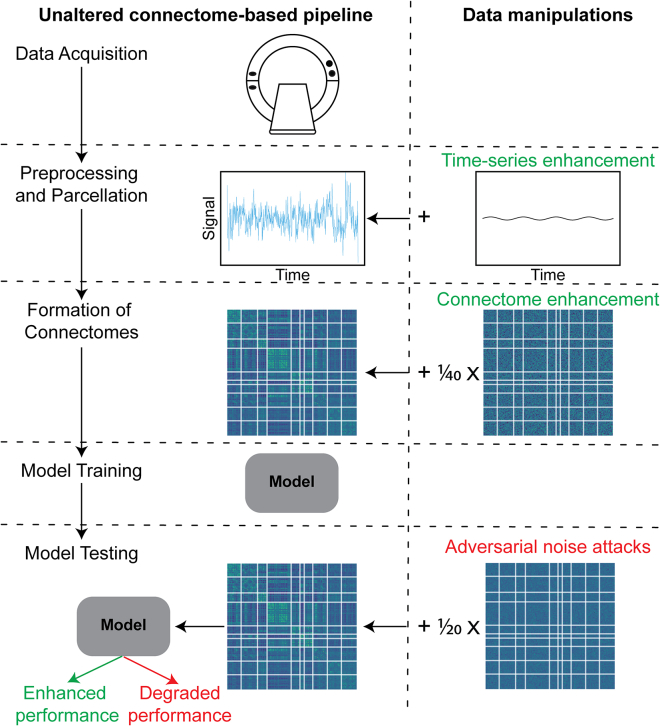
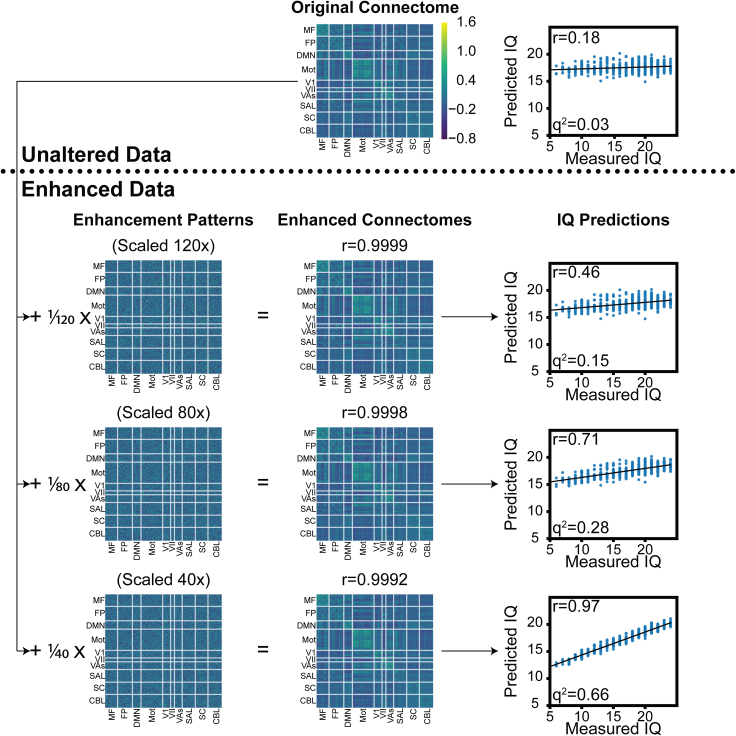
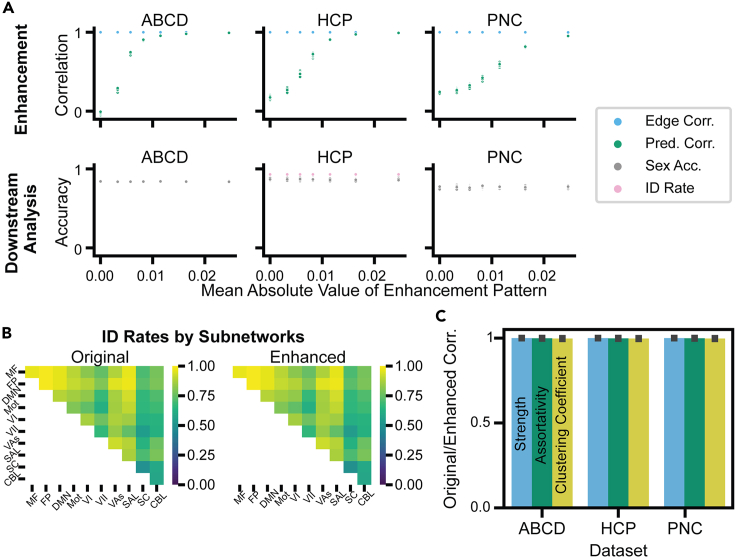
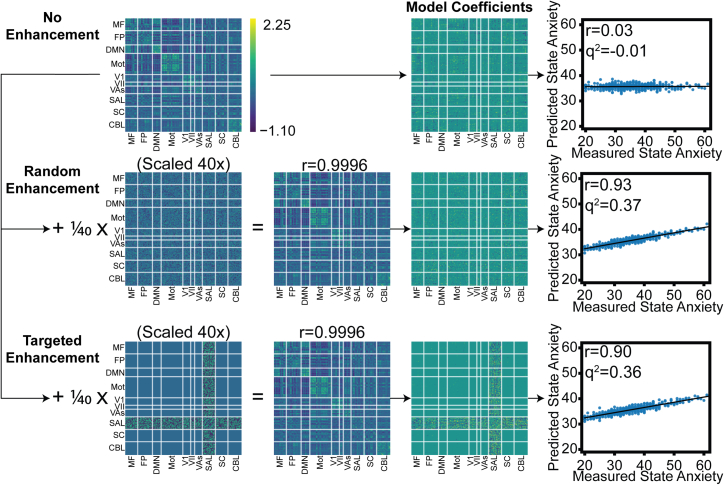
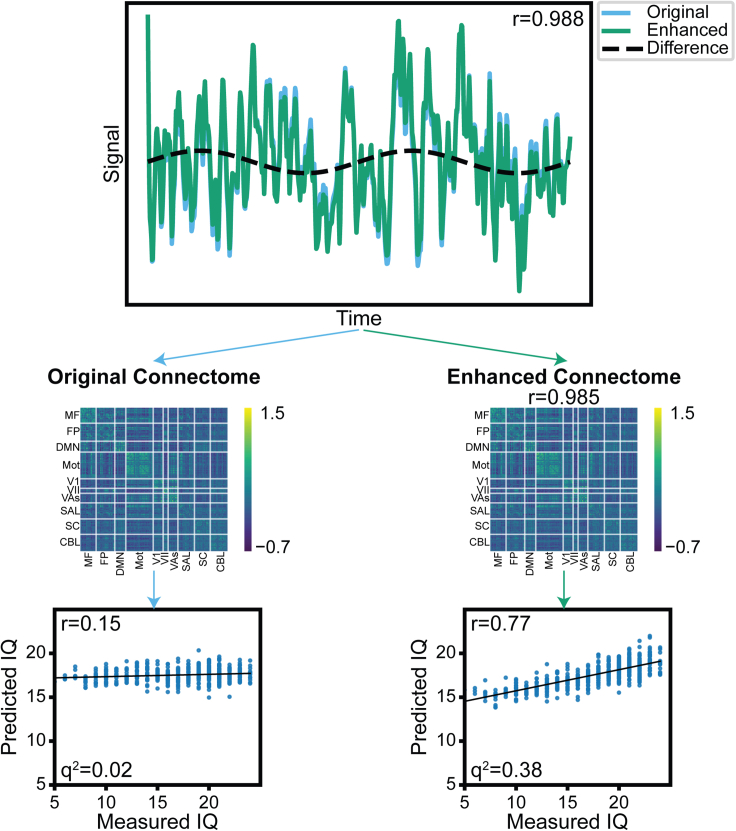
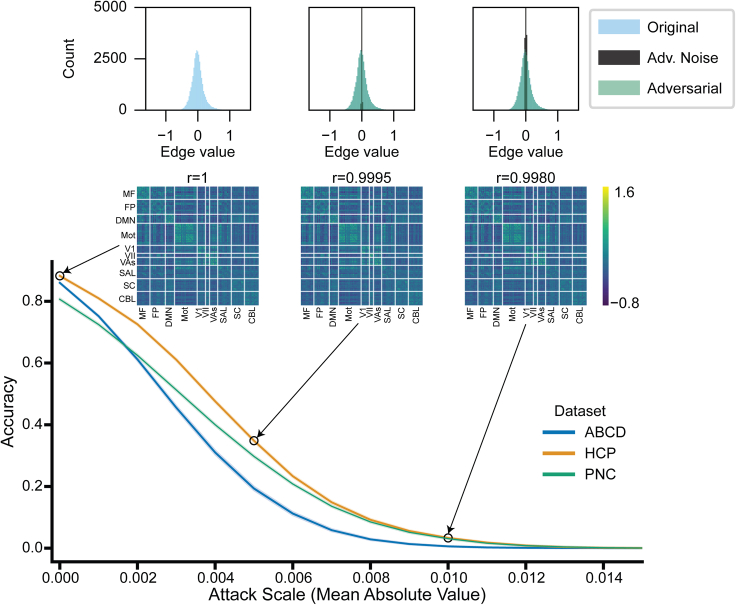
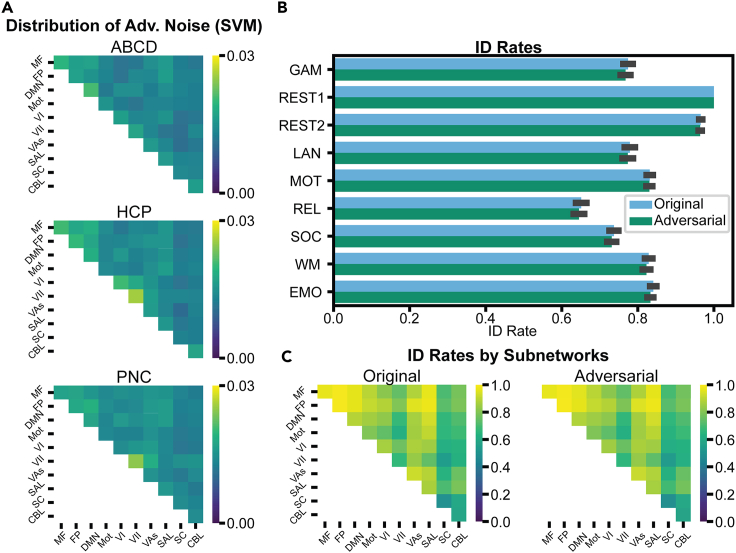
Neuroimaging-based predictive models continue to improve in performance, yet a widely overlooked aspect of these models is "trustworthiness," or robustness to data manipulations. High trustworthiness is imperative for researchers to have confidence in their findings and interpretations. In this work, we used functional connectomes to explore how minor data manipulations influence machine learning predictions. These manipulations included a method to falsely enhance prediction performance and adversarial noise attacks designed to degrade performance. Although these data manipulations drastically changed model performance, the original and manipulated data were extremely similar (r = 0.99) and did not affect other downstream analysis. Essentially, connectome data could be inconspicuously modified to achieve any desired prediction performance. Overall, our enhancement attacks and evaluation of existing adversarial noise attacks in connectome-based models highlight the need for counter-measures that improve the trustworthiness to preserve the integrity of academic research and any potential translational applications.

Keywords: adversarial attacks; connectomics; fMRI; functional connectivity; machine learning; predictive modeling; trustworthiness.


Conflict of interest statement

The authors declare no competing interests.

Figures

None
Graphical abstract
Figure 1
Figure 1
Summary of the manipulations investigated in this study The left half shows a typical connectome-based pipeline. The right half shows where each manipulation can be applied in the pipeline. Red text indicates attacks that degrade performance, while green text indicates attacks that falsely enhance performance. Enhancement attacks are applied to all data. These attacks are relevant for false enhancement of academic studies or open-source data. They can be applied at multiple points in the processing pipeline (time-series enhancement or connectome enhancement) to falsely enhance performance or alter neuroscientific interpretations. Adversarial noise attacks are applied to only the test data, on the basis of the model coefficients. These attacks have implications in potential translational applications.
Figure 2
Figure 2
Main pipeline of performance enhancement attacks This example is shown for prediction of IQ in the HCP dataset with resting-state connectomes and rCPM. The original dataset results in a prediction performance of r = 0.18 between measured and predicted IQ. Enhancement patterns (mean enhancement pattern shown) are added to the original connectome proportional to each participant’s Z-scored IQ. For the sake of visualization, we multiplied the enhancement patterns by 120, 80, and 40, or else they would be too small to see. The corresponding enhanced connectomes maintain average correlations of r ≈ 0.99 with the original connectomes, but the prediction performance is greatly enhanced. The networks labeled on the connectomes are as follows: MF, medial-frontal; FP, fronto-parietal; DMN, default mode; MOT, motor; VI, visual I; VII, visual II; VAs, visual association; SAL, salience; SC, subcortical; and CBL, cerebellum.,
Figure 3
Figure 3
Performance enhancement attacks only cause minor changes to connectomes (A) Data are enhanced to predict IQ measurements in ABCD, HCP, and PNC for 100 iterations of different enhancement patterns (all 100 iterations are shown as points; there is a lot of overlap between iterations). The x axis reflects the mean absolute value of the enhancement pattern added at the edge level (i.e., the absolute mean of the enhancement pattern across all participants for the 20% of edges we altered). At x = 0, there is no enhancement. As a larger enhancement pattern is added, the prediction performance (prediction correlation) increases to r > 0.9, although the edge-wise correlation between original and enhanced connectomes is still r ≈ 0.99. In the second row of (A), enhancement attacks are shown to not affect downstream analyses, which included a sex classification model and participant identification (“fingerprinting”) for HCP. (B) Identification rates by subnetwork between Rest1 original/enhanced and Rest2 connectomes in HCP. (C) Several graph metrics, including strength, assortativity, and clustering coefficient, were calculated for the original connectomes and enhanced connectomes, using the largest scale of enhancement presented in (A). The correlation between these metrics for original and enhanced connectomes is presented in (C), with error bars representing the SD of the correlation across participants.
Figure 4
Figure 4
Performance enhancement attacks in the SLIM dataset This example is shown for prediction of state anxiety in the SLIM dataset with resting-state connectomes and rCPM. In the top row, prediction with the original dataset shows poor performance (r ≈ 0). In the second row, as in Figure 2, an enhancement pattern proportional to the state anxiety measure can be added to random edges to enhance performance while maintaining very high correlations between the original and enhanced connectomes (r ≈ 0.99). In the bottom row, an enhancement pattern can be added to specific subnetworks to alter interpretation. Here, we targeted the enhancement pattern to the salience subnetwork, and the resulting coefficients reflect that edges in the salience network dominate the prediction outcome.
Figure 5
Figure 5
Time series performance enhancement attacks Node time-series data can be manipulated by adding a pattern with amplitude proportional to the IQ of each participant to increase/decrease the calculated functional connectivity between specific nodes. In this case, we chose a sinusoid pattern to add to the time-series data. A representative node is shown in this figure. The correlations between original and enhanced time-series (r = 0.988) and resulting connectome (r = 0.985) data are very high, despite large differences in prediction performance (r = 0.15 vs. r = 0.77). See also Figure S3.
Figure 6
Figure 6
Adversarial attack accuracy as a function of magnitude of attack for our three datasets and SVM classifiers of self-reported sex The x axis reflects an increase in the size of the attacks, represented as the mean absolute value of the added noise pattern, while the y axis shows accuracy on the manipulated data. The experiment is repeated for 100 different random seeds and SDs across the 100 iterations are shown (very small SDs). At three points for the HCP line, representative connectomes are shown, as well as histograms with edge values for the original connectomes, adversarial connectomes, and adversarial noise pattern. Above each representative connectome is the edge-wise correlation with the original connectome See also Figure S4.
Figure 7
Figure 7
Downstream effects of adversarial noise attacks (A) Breakdown of SVM adversarial noise into subnetworks. Brighter colors reflect higher mean absolute value of noise in that subnetwork. (B) Identification rates in original and adversarial connectomes in the HCP dataset. The original or adversarial Rest1 scans were compared to connectomes in another session (Rest2) or task. The connectome with the highest edge-wise correlation was selected as the predicted identity. The error bars represent the SD of identification rate across 100 random seeds. (C) Using original or adversarial Rest1 scans, we identified participants on the basis of their correlations with the original Rest2 scans. For this portion, we used only a specific subset of edges corresponding to each subnetwork to predict the identity.

Similar articles

Cited by

References

    1. Whelan R., Garavan H. When optimism hurts: inflated predictions in psychiatric neuroimaging. Biol. Psychiatry. 2014;75:746–748. doi: 10.1016/j.biopsych.2013.05.014. - DOI - PubMed
    1. Gabrieli J.D.E., Ghosh S.S., Whitfield-Gabrieli S. Prediction as a humanitarian and pragmatic contribution from human cognitive neuroscience. Neuron. 2015;85:11–26. doi: 10.1016/j.neuron.2014.10.047. - DOI - PMC - PubMed
    1. Cremers H.R., Wager T.D., Yarkoni T. The relation between statistical power and inference in fMRI. PLoS One. 2017;12:e0184923. doi: 10.1371/journal.pone.0184923. - DOI - PMC - PubMed
    1. Noble S., Mejia A.F., Zalesky A., Scheinost D. Improving power in functional magnetic resonance imaging by moving beyond cluster-level inference. Proc. Natl. Acad. Sci. USA. 2022;119 doi: 10.1073/pnas.2203020119. e2203020119. - DOI - PMC - PubMed
    1. Shen X., Finn E.S., Scheinost D., Rosenberg M.D., Chun M.M., Papademetris X., Constable R.T. Using connectome-based predictive modeling to predict individual behavior from brain connectivity. Nat. Protoc. 2017;12:506–518. doi: 10.1038/nprot.2016.178. - DOI - PMC - PubMed

LinkOut - more resources