Review
. 2023 Jul 13:10:1179834.
doi: 10.3389/fmed.2023.1179834. eCollection 2023.

Glomerular hyperfiltration and hypertrophy: an evaluation of maximum values in pathological indicators to discriminate "diseased" from "normal"

Affiliations
Review

Glomerular hyperfiltration and hypertrophy: an evaluation of maximum values in pathological indicators to discriminate "diseased" from "normal"

Hiroshi Kataoka et al. Front Med (Lausanne). .

Abstract

The success of sodium-glucose cotransporter 2 inhibitors and bariatric surgery in patients with chronic kidney disease has highlighted the importance of glomerular hyperfiltration and hypertrophy in the progression of kidney disease. Sustained glomerular hyperfiltration and hypertrophy can lead to glomerular injury and progressive kidney damage. This article explores the relationship between obesity and chronic kidney disease, focusing on the roles of glomerular hyperfiltration and hypertrophy as hallmarks of obesity-related kidney disease. The pathological mechanisms underlying this association include adipose tissue inflammation, dyslipidemia, insulin resistance, chronic systemic inflammation, oxidative stress, and overactivation of the sympathetic nervous system, as well as the renin-angiotensin aldosterone system. This article explains how glomerular hyperfiltration results from increased renal blood flow and intraglomerular hypertension, inducing mechanical stress on the filtration barrier and post-filtration structures. Injured glomeruli increase in size before sclerosing and collapsing. Therefore, using extreme values, such as the maximal glomerular diameter, could improve the understanding of the data distribution and allow for better kidney failure predictions. This review provides important insights into the mechanisms underlying glomerular hyperfiltration and hypertrophy and highlights the need for further research using glomerular size, including maximum glomerular profile, calculated using needle biopsy specimens.

Keywords: chronic kidney disease; extreme value; glomerular hyperfiltration; glomerular hypertrophy; inflammation; obesity; sodium-glucose cotransporter 2 inhibitors; visceral fat.


Conflict of interest statement

The authors declare that the research was conducted in the absence of any commercial or financial relationships that could be construed as a potential conflict of interest.

Figures

Figure 1
Figure 1
(A) A schematic representation of the changes in glomerular size in kidney damage. Injured glomeruli increase in size before sclerosing and collapsing. The maximal hypertrophied glomerulus is shown in red. The course can be divided into two periods using the maximally hypertrophied glomerulus as a boundary: glomerular enlargement and glomerular sclerosing and collapsing. (B) Glomeruli of various sizes (including hypertrophied and collapsing glomeruli) simultaneously exist in the kidney biopsy specimen.
Figure 2
Figure 2
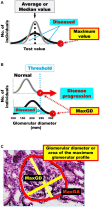
(A) Average or median values often cannot distinguish the differences in distribution curves for normal and diseased in diagnostic tests. The gray distribution curve represents the distribution of healthy participants in a diagnostic test, while the black distribution curve represents the distribution of patients in a diagnostic test. Differences between the black and gray distribution curves can be identified by extreme values, such as maximum and minimum values, rather than by the mean and median values. (B) The differences in the distribution curves of glomerular size between healthy individuals and patients with kidney damage. The gray distribution curve represents the glomerular size distribution in healthy participants without kidney damage. The black distribution curve represents glomerular size distribution in patients with kidney damage. Pathological glomeruli can be diagnosed when hypertrophy progresses beyond a certain threshold. The greater the damage to the kidney, the more the maximum glomerular profile shifts to the right in the kidney biopsy specimens. (C) Glomerular diameter or area of the maximum glomerular profile. Measurement of the MaxGD is indicated by the yellow line and MaxGA is represented by the red line. The MaxGD is calculated as the mean of the maximal diameter of the glomerulus and the maximal chord perpendicular to the maximal diameter of the maximally hypertrophied glomerulus in the area with the maximal profile in each specimen. The position of the geometric center of the maximal profile of the glomerulus is visually identifiable. After drawing the maximal diameter that passes through the geometric center, we draw the maximal chord perpendicular to the maximal diameter. MaxGD, maximal glomerular diameter; MaxGA, maximum glomerular area.

References

    1. Wang Y, Chen X, Song Y, Caballero B, Cheskin LJ. Association between obesity and kidney disease: a systematic review and meta-analysis. Kidney Int. (2008) 73:19–33. doi: 10.1038/sj.ki.5002586 - DOI - PubMed
    1. Hsu C-y, McCulloch C, Iribarren C, Darbinian J, Go A. Body mass index and risk for end-stage renal disease. Ann Intern Med. (2006) 144:21–8. doi: 10.7326/0003-4819-144-1-200601030-00006 - DOI - PubMed
    1. Serra A, Romero R, Lopez D, Navarro M, Esteve A, Perez N, et al. . Renal injury in the extremely obese patients with normal renal function. Kidney Int. (2008) 73:947–55. doi: 10.1038/sj.ki.5002796, PMID: - DOI - PubMed
    1. Yamagata K, Ishida K, Sairenchi T, Takahashi H, Ohba S, Shiigai T, et al. . Risk factors for chronic kidney disease in a community-based population: a 10-year follow-up study. Kidney Int. (2007) 71:159–66. doi: 10.1038/sj.ki.5002017, PMID: - DOI - PubMed
    1. Zoccali C. The obesity epidemics in ESRD: from wasting to waist? Nephrol Dial Transplant. (2009) 24:376–80. doi: 10.1093/ndt/gfn589, PMID: - DOI - PubMed

LinkOut - more resources