. 2023 Jul 17:42:1-14.
doi: 10.1016/j.jot.2023.06.002. eCollection 2023 Sep.

Pharmacological inhibition of protein S-palmitoylation suppresses osteoclastogenesis and ameliorates ovariectomy-induced bone loss

Affiliations

Pharmacological inhibition of protein S-palmitoylation suppresses osteoclastogenesis and ameliorates ovariectomy-induced bone loss

Linghui Ma et al. J Orthop Translat. .

Abstract

Background: Excessive osteoclast formation disrupts bone homeostasis, thereby significantly contributing to pathological bone loss associated with a variety of diseases. Protein S-palmitoylation is a reversible post-translational lipid modification catalyzed by ZDHHC family of palmitoyl acyltransferases, which plays an important role in various physiological and pathological processes. However, the role of palmitoylation in osteoclastogenesis has never been explored. Consequently, it is unclear whether this process can be targeted to treat osteolytic bone diseases that are mainly caused by excessive osteoclast formation.

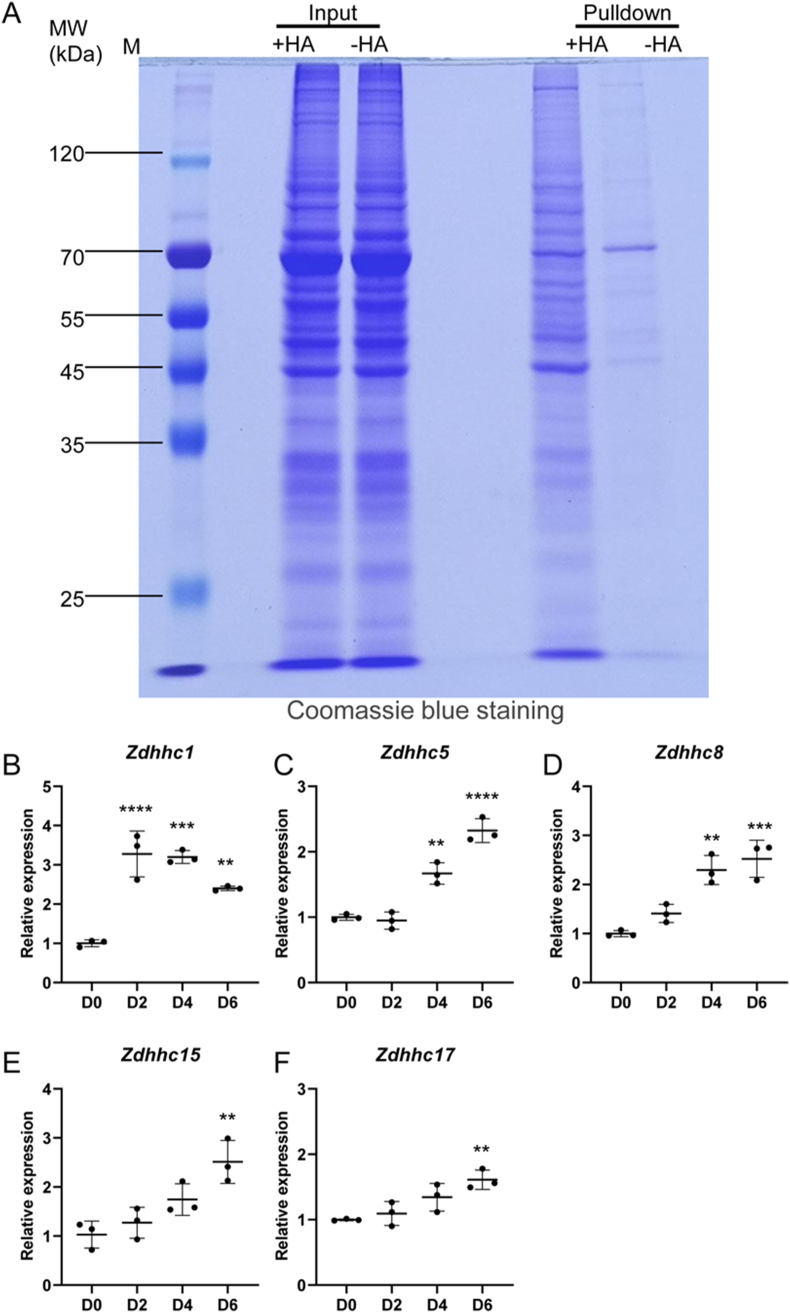
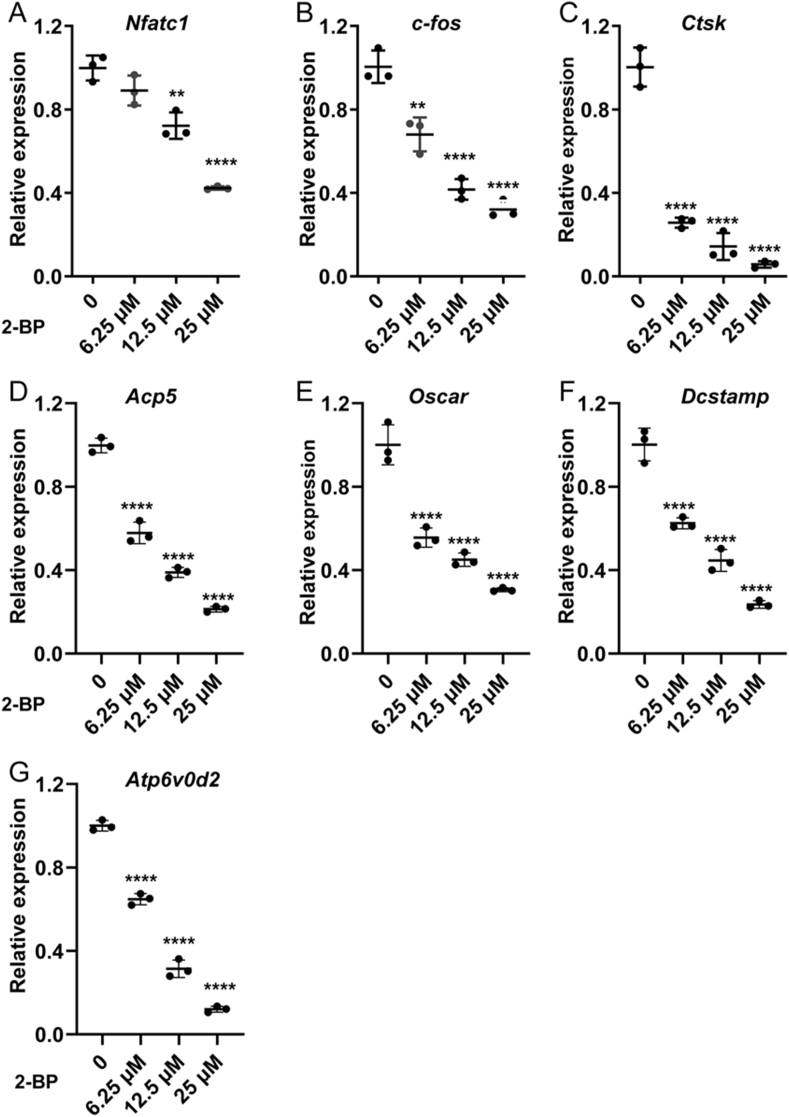
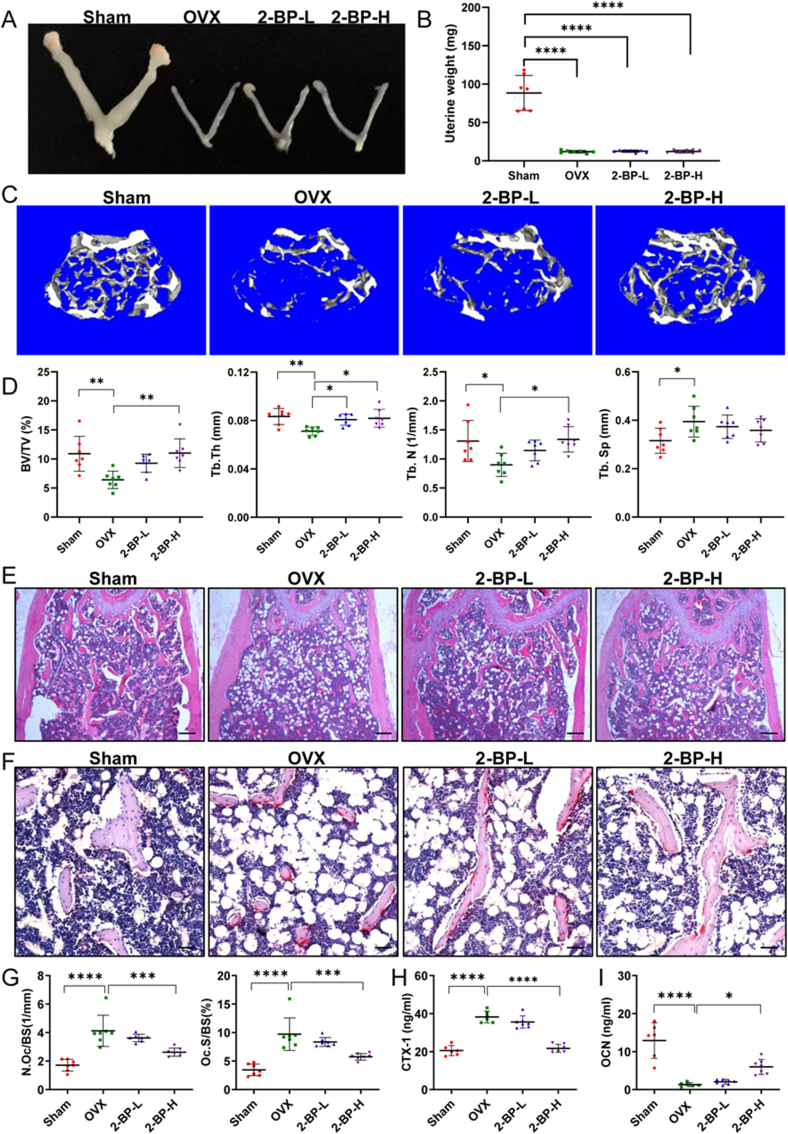
Materials and methods: In this study, we employed acyl-biotin exchange (ABE) assay to reveal protein S-palmitoylation in differentiating osteoclasts (OCs). We utilized 2-bromopalmitic acid (2-BP), a pharmacological inhibitor of protein S-palmitoylation, to inhibit protein palmitoylation in mouse bone marrow-derived macrophages (BMMs), and tested its effect on receptor activator of nuclear factor κβ ligand (RANKL)-induced osteoclast differentiation and activity by TRAP staining, phalloidin staining, qPCR analyses, and pit formation assays. We also evaluated the protective effect of 2-BP against estrogen deficiency-induced bone loss and bone resorption in ovariectomized (OVX) mice using μCT, H&E staining, TRAP staining, and ELISA assay. Furthermore, we performed western blot analyses to explore the molecular mechanism underlying the inhibitory effect of 2-BP on osteoclastogenesis.

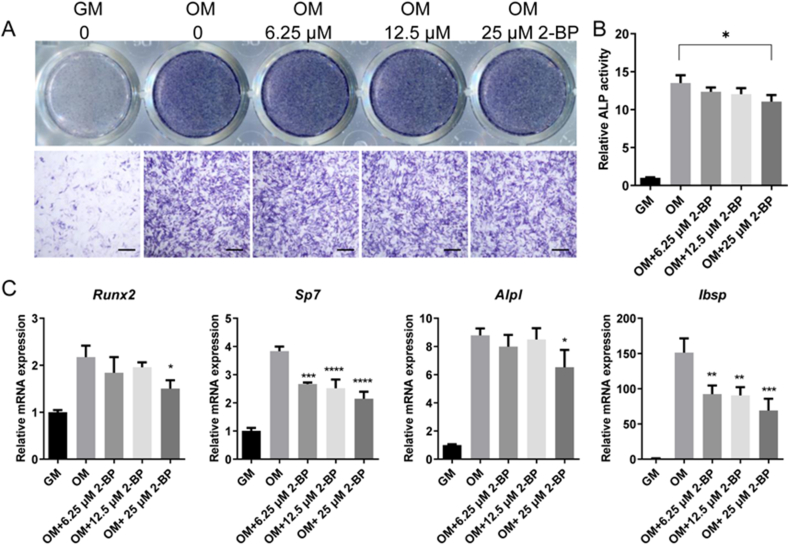
Results: We found that many proteins were palmitoylated in differentiating OCs and that pharmacological inhibition of palmitoylation impeded RANKL-induced osteoclastogenesis, osteoclast-specific gene expression, F-actin ring formation and osteoclastic bone resorption in vitro, and to a lesser extent, osteoblast formation from MC3T3-E1 cells. Furthermore, we demonstrated that administration of 2-BP protected mice from ovariectomy-induced osteoporosis and bone resorption in vivo. Mechanistically, we showed that 2-BP treatment inhibited osteoclastogenesis partly by downregulating the expression of c-Fos and NFATc1 without overtly affecting RANKL-induced activation of osteoclastogenic AKT, MAPK, and NF-κB pathways.

Conclusion: Pharmacological inhibition of palmitoylation potently suppresses RANKL-mediated osteoclast differentiation in vitro and protects mice against OVX-induced osteoporosis in vivo. Mechanistically, palmitoylation regulates osteoclast differentiation partly by promoting the expression of c-Fos and NFATc1. Thus, palmitoylation plays a key role in promoting osteoclast differentiation and activity, and could serve as a potential therapeutic target for the treatment of osteoporosis and other osteoclast-related diseases.

The translational potential of this article: The translation potential of this article is that we first revealed palmitoylation as a key mechanism regulating osteoclast differentiation, and therefore provided a potential therapeutic target for treating osteolytic bone diseases.

Keywords: 2-bromopalmitic acid; Osteoclastogenesis; Osteoporosis; Protein S-palmitoylation.


Conflict of interest statement

All authors declare that they have no conflicts of interest.

Figures

Image 1
Graphical abstract
Fig. 1
Fig. 1
Protein S-palmitoylation occurs in differentiating OCs. (A) Representative images of coomassie blue staining of protein samples before (Input) and after acyl-biotin exchange (ABE) assay (Pulldown). Total proteins were extracted from BMMs that were induced with 100 ​ng/ml RANKL for 3 days. Bands shown in the -HA lane of pulldown samples represented nonspecifically purified contaminant proteins. Additional bands in the +HA lane of pulldown samples indicated palmitoylated proteins. M, protein markers. Images shown were representative results from three independent experiments. (B–F) qPCR analysis of relative expression of Zdhhc1 (B), Zdhhc5 (C), Zdhhc8 (D), Zdhhc15 (E), and Zdhhc17 (F) in BMMs before (D0) and after treatment with 100 ​ng/ml RANKL for 2 (D2), 4 (D4), and 6 days (D6). The relative changes in mRNA levels were analyzed by 2−ΔΔCT method. mRNA expression level of each target gene was first normalized to the expression of 18S ribosomal RNA, and then normalized to the D0 group. n ​= ​3 wells per group. All values were presented as mean ​± ​SD. p values were determined by one-way ANOVA. ∗: p ​< ​0.05, ∗∗: p ​< ​0.01; ∗∗∗: p ​< ​0.001; ∗∗∗∗: p ​< ​0.0001, relative to D0 group.
Fig. 2
Fig. 2
2-BP dose-dependently inhibited RANKL-induced osteoclast formation in vitro. (AC) CCK-8 assays of BMM viability after they were treated with indicated concentrations of 2-BP for 24 (A), 48 (B), or 72 ​h ​(C). n ​= ​6 wells per group. (D). Palmitoylation of R-Ras was analyzed by ABE and western blot in BMMs treated with vehicle or 25 ​μM 2-BP for 2 days. Images shown were representative results from three independent experiments. (E) TRAP staining of BMMs after stimulation with 15 ​ng/ml M-CSF and 100 ​ng/ml RANKL in the presence of indicated concentrations of 2-BP for 5 days. Images shown were representative results from triplicates. Scale bar: 200 ​μm. (F) Quantification of average number of TRAP-positive multinucleated OCs per well. n ​= ​3 wells per group. (G) Quantification of relative size of TRAP-positive multinucleated OCs. n ​= ​3 wells per group. All values were presented as mean ​± ​SD. p values were determined by one-way ANOVA. ∗: p ​< ​0.05, ∗∗: p ​< ​0.01; ∗∗∗: p ​< ​0.001; ∗∗∗∗: p ​< ​0.0001, relative to vehicle-treated group. nd, not detected.
Fig. 3
Fig. 3
2-BP inhibited osteoclast-specific gene expression in vitro. qPCR analysis of relative expression of the osteoclast-specific genes Nfatc1(A), c-Fos(B), Ctsk(C), Acp5(D), Oscar(E), Dcstamp(F), and Atp6v0d2(G), in BMMs treated with RANKL and different concentrations of 2-BP (0, 6.25, 12.5, or 25 ​μM) for 5 days. The relative changes in mRNA levels were analyzed by 2−ΔΔCT method. mRNA expression level of each target gene was first normalized to the expression of 18S ribosomal RNA, and then normalized to the vehicle-treated group. All values were calculated from three biological replicates and presented as mean ​± ​SD. p values were determined by one-way ANOVA. n ​= ​3, ∗: p ​< ​0.05, ∗∗: p ​< ​0.01; ∗∗∗: p ​< ​0.001; ∗∗∗∗: p ​< ​0.0001, compared to vehicle-treated group.
Fig. 4
Fig. 4
2-BP inhibited RANKL-induced F-actin ring formation and osteoclastic bone resorption in vitro. (A) Representative images of phalloidin staining of BMM cultures treated with RANKL and different concentrations of 2-BP (0, 6.25, 12.5, or 25 ​μM) for 5 days. F-actin rings. Green, F-actin; Blue, nuclei. Scale bar: 100 ​μm. (BD) Quantification of average number of F-actin rings per well (B), relative length of F-actin rings (C), and average number of nuclei per osteoclast (D). (E) Representative images of resorption pits on the hydroxyapatite-coated surface of Corning Osteo Assay plate. Scale bar: 100 ​μm. (F) Quantification of the percentage of resorbed surface out of total surface on resorption pit images. All quantitative values were calculated from triplicates (n ​= ​3) and presented as mean ​± ​SD. p values were determined by one-way ANOVA. ∗: p ​< ​0.05, ∗∗: p ​< ​0.01; ∗∗∗: p ​< ​0.001; ∗∗∗∗: p ​< ​0.0001, compared to vehicle-treated group. (For interpretation of the references to colour in this figure legend, the reader is referred to the Web version of this article.)
Fig. 5
Fig. 5
Pharmacological inhibition of palmitoylation mildly suppressed osteogenic differentiation of MC3T3-E1 cells. (A) ALP staining of MC3T3-E1 cells after 7 days of treatment with growth medium (GM) or osteogenic medium (OM) in the presence of indicated concentrations of 2-BP. Images shown were representative results from triplicates. Scale bar: 400 ​μm. (B) ALP activity assay of MC3T3-E1 cells after 7 days of treatment with growth medium (GM) or osteogenic medium (OM) in the presence of indicated concentrations of 2-BP. n ​= ​3. (C) qPCR analysis of relative mRNA expression of Runx2, Sp7, Alpl, and Ibsp in MC3T3-E1 cells after 7 days of treatment with growth medium (GM) or osteogenic medium (OM) in the presence of indicated concentrations of 2-BP. n ​= ​3. All data were calculated from triplicates and presented as mean ​± ​SD. p values were determined by one-way ANOVA. ∗: p ​< ​0.05, ∗∗: p ​< ​0.01; ∗∗∗: p ​< ​0.001; ∗∗∗∗: p ​< ​0.0001.
Fig. 6
Fig. 6
Pharmacological inhibition of palmitoylation suppressed RANKL-induced expression of c-Fos and NFATc1 without affecting activation of major osteoclastic signaling pathways. (A) Western blot analyses of protein levels of phosphorylated ERK(p-ERK), total ERK, phosphorylated JNK (p-JNK), total JNK, phosphorylated p38 (p-p38), total p38, phosphorylated AKT (p-AKT), total AKT, phosphorylated NF-κB p65 (p-p65), and total NF-κB p65 (p65) in BMMs after stimulation with 100 ​ng/ml RANKL in the presence of vehicle (Veh) or 25 ​μM 2-BP (2-BP) for indicate times. Representative images from three independent biological replicates were shown. (B) Quantification of relative ratios of p-ERK/ERK, p-JNK/JNK, p-p38/p38, p-AKT/AKT, and p-p65/p65. n ​= ​3 per group. (C) Western blot analyses of protein levels of NFATc1 and c-Fos in vehicle- or 25 ​μM 2-BP-treated BMMs at 0, 1, 3, and 5 days after RANKL stimulation. (D) Quantification of relative protein levels of NFATc1 and c-Fos in vehicle- or 25 ​μM 2-BP-treated BMMs at 0, 1, 3, and 5 days after RANKL stimulation. All data were calculated from triplicates (n ​= ​3) and presented as mean ​± ​SD. p values were determined by one-way ANOVA. ∗: p ​< ​0.05, ∗∗: p ​< ​0.01; ∗∗∗: p ​< ​0.001; ∗∗∗∗: p ​< ​0.0001.
Fig. 7
Fig. 7
Pharmacological inhibition of palmitoylation protected mice against ovariectomy-induced bone loss. (AB) Gross morphology (A) and weights (B) of the uteri of Sham, OVX, 2-BP-L, and 2-BP-H mice. n ​= ​7 mice for each group. (C) Representative three-dimensional μCT images of trabecular bones in the distal femurs from Sham, OVX, 2-BP-L, and 2-BP-H mice. (D) μCT analysis of the percentage of trabecular bone volume (BV/TV), trabecular number (Tb. N), trabecular thickness (Tb. Th), and trabecular separation (Tb. Sp) in the distal femurs. n ​= ​7 mice for each group. (E) Representative images of H&E staining of the distal femurs from indicated mice. Scale bar: 200 ​μm. (F) Representative images of TRAP staining of the distal femurs from indicated mice. Scale bar: 50 ​μm. (G) Histomorphometry analysis of the images in F for number of OCs per trabecular bone surface (N. Oc/BS) and osteoclast surface per bone surface (Oc. S/BS). n ​= ​7 mice for each group. (H–I) Serum levels of bone resorption marker CTX-1 (H) and bone formation marker OCN (I) were determined by ELISA analysis. CTX-1: type I collagen cross-linked C-terminal telopeptide. OCN: osteocalcin. n ​= ​6–7 mice per group. All data were presented as dot plots with mean ​± ​standard deviation. A single data point in the dot plot represents a value from a single mouse. p values were determined by one-way ANOVA with Tukey's post-hoc test. ∗: p ​< ​0.05, ∗∗: p ​< ​0.01; ∗∗∗: p ​< ​0.001; ∗∗∗∗: p ​< ​0.0001.

References

    1. Lerner U.H. Osteoclasts in Health and disease. Pediatr Endocrinol Rev. 2019;17(2):84–99. - PubMed
    1. Fornetti J., Welm A.L., Stewart S.A. Understanding the bone in cancer metastasis. J Bone Miner Res. 2018;33(12):2099–2113. - PubMed
    1. Zhang L., Yang Y., Liao Z., Liu Q., Lei X., Li M., et al. Genetic and pharmacological activation of Hedgehog signaling inhibits osteoclastogenesis and attenuates titanium particle-induced osteolysis partly through suppressing the JNK/c-Fos-NFATc1 cascade. Theranostics. 2020;10(15):6638–6660. - PMC - PubMed
    1. Wang S., Ma Q., Xie Z., Shen Y., Zheng B., Jiang C., et al. An antioxidant sesquiterpene inhibits osteoclastogenesis via blocking IPMK/TRAF6 and counteracts OVX-induced osteoporosis in mice. J Bone Miner Res. 2021;36(9):1850–1865. - PubMed
    1. Zhu S., Zhu J., Zhen G., Hu Y., An S., Li Y., et al. Subchondral bone osteoclasts induce sensory innervation and osteoarthritis pain. J Clin Invest. 2019;129(3):1076–1093. - PMC - PubMed