. 2023 Jul 14:14:1194244.
doi: 10.3389/fpls.2023.1194244. eCollection 2023.

From endodormancy to ecodormancy: the transcriptional landscape of apple floral buds

Affiliations

From endodormancy to ecodormancy: the transcriptional landscape of apple floral buds

Sangeeta Sapkota et al. Front Plant Sci. .

Abstract

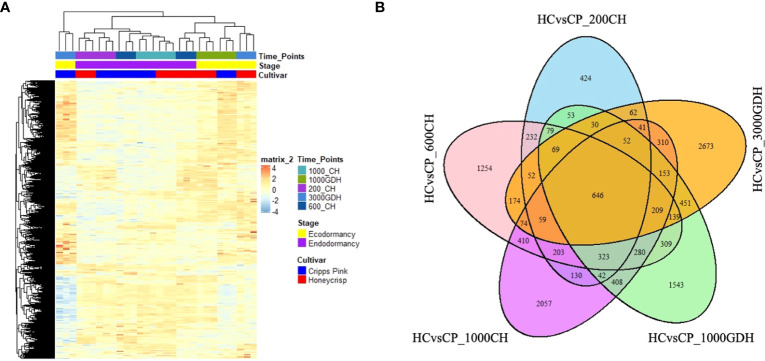
This study endeavors to explore the transcriptomic profiles of two apple cultivars, namely, 'Honeycrisp' and 'Cripps Pink,' which represent late and early-blooming cultivars, respectively. Using RNA-sequencing technology, we analyzed floral bud samples collected at five distinct time intervals during both endodormancy and ecodormancy. To evaluate the transcriptomic profiles of the 30 sequenced samples, we conducted principal component analysis (PCA). PC1 explained 43% of the variance, separating endodormancy and ecodormancy periods, while PC2 explained 16% of the variance, separating the two cultivars. The number of differentially expressed genes (DEGs) increased with endodormancy progression and remained elevated during ecodormancy. The majority of DEGs were unique to a particular time point, with only a few overlapping among or between the time points. This highlights the temporal specificity of gene expression during the dormancy transition and emphasizes the importance of sampling at multiple time points to capture the complete transcriptomic dynamics of this intricate process. We identified a total of 4204 upregulated and 7817 downregulated DEGs in the comparison of endodormancy and ecodormancy, regardless of cultivar, and 2135 upregulated and 2413 downregulated DEGs in the comparison of 'Honeycrisp' versus 'Cripps Pink,' regardless of dormancy stage. Furthermore, we conducted a co-expression network analysis to gain insight into the coordinated gene expression profiles across different time points, dormancy stages, and cultivars. This analysis revealed the most significant module (ME 14), correlated with 1000 GDH and consisting of 1162 genes. The expression of the genes within this module was lower in 'Honeycrisp' than in 'Cripps Pink.' The top 20 DEGs identified in ME 14 were primarily related to jasmonic acid biosynthesis and signaling, lipid metabolism, oxidation-reduction, and transmembrane transport activity. This suggests a plausible role for these pathways in governing bud dormancy and flowering time in apple.

Keywords: bud dormancy; ecodormancy; endodormancy; flowering time; jasmonic acid; transcriptomics.


Conflict of interest statement

The authors declare that the research was conducted in the absence of any commercial or financial relationships that could be construed as a potential conflict of interest.

Figures

Figure 1
Figure 1
Transcriptome variance distinguishes genotypes and dormancy stages. (A) Principal component analysis (PCA) of samples by transcriptome profile. (B) Number of differentially expressed genes (DEGs) at each time points in ‘Honeycrisp’ compared to ‘Cripps Pink’. (C, D) Volcano plots of DEGs upregulated (red), downregulated (green), non DEGs (blue) in endodormancy compared to ecodormancy (C) and ‘Honeycrisp’ compared to ‘Cripps Pink’ (D).
Figure 2
Figure 2
Hierarchical cluster analysis and Venn Diagrams for DEGs throughout the dormancy cycle. (A) Heatmap visualization of transcriptomic profiles. Rows correspond to individual transcripts, while columns represent different groups or samples. The color intensity reflects the gene expression levels (log2(FPKM+1)) among the different groups. The heatmap highlights the differentially expressed genes, identified based on their significant fold changes (|log2FoldChange| > 1) and adjusted p-values (p-adjusted < 0.05), with blue color indicating downregulation and red color representing upregulation. (B) a Venn Diagram showing DEGS at different time points during endo and ecodormancy in ‘Honeycrisp’ compared to ‘Cripps Pink’.
Figure 3
Figure 3
Time-series analysis of significantly enriched DEGs between ‘Honeycrisp’ and ‘Cripps Pink’ during endodormacy (A: 600 CH) and ecodormancy (B and C: 1000 GDH and 3000 GDH). Dot size represents the number of genes enriched in each GO at p-adj<0.05.
Figure 4
Figure 4
Gene ontology (GO) enrichment analysis. Top most significantly enriched GO terms of DEGs between endodormancy and ecodormancy in apple. (A) upregulated genes (B) downregulated genes in the cellular components, molecular function, and biological processes.
Figure 5
Figure 5
WGCNA of the floral buds of apple during endo and ecodormancy in apple cultivars ‘Honeycrisp’(HC) and ‘Cripps Pink’ (CP). (A) Module–sample relationships. Each row corresponds to a module eigengene, each column corresponds to a trait, and each cell consists of the corresponding correlation and p-value. (B) The expression profiles of ME 14 eigengenes (mean ± SE). (C) Expression profile of the top ten upregulated and downregulated genes at 1000 GDH in ‘HC’ and ‘CP’ based on adjusted p-value.
Figure 6
Figure 6
Expression profile of MdMYC, MdJAZ, and MdLOX genes at endodormancy and ecodormancy in ‘Honeycrisp’ and ‘Cripps Pink’. The expression of each gene was normalized to that of two reference genes (MdActin and MdGAPDH) and then calculated relative to the expression level in the control sample (‘Cripps Pink’ at 200 CH). Error bars represent the standard error of the means of three biological and three technical replicates. CH and GDH refers to Chilling Hour and Growing Degree Hour, respectively. *,**,*** represent significant at P-value = 0.05, 0.01, 0.001, respectively.

References

    1. Acosta I. F., Laparra H., Romero S. P., Schmelz E., Hamberg M., Mottinger J. P., et al. . (2009). Tasselseed1 is a lipoxygenase affecting jasmonic acid signaling in sex determination of maize. Science 323, 262–265. doi: 10.1126/science.1164645 - DOI - PubMed
    1. Andrews S. (2010). FastQC: a quality control tool for high throughput sequence data. Available at: http://www.bioinformatics.babraham.ac.uk/projects/fastqc.
    1. Beauvieux R., Wenden B., Dirlewanger E. (2018). Bud dormancy in perennial fruit tree species: a pivotal role for oxidative cues. Front. Plant Sci. 9. doi: 10.3389/fpls.2018.00657 - DOI - PMC - PubMed
    1. Bielenberg D. G., Wang Y., Li Z., Zhebentyayeva T., Fan S., Reighard G. L., et al. . (2008). Sequencing and annotation of the evergrowing locus in peach [Prunus persica (L.) batsch] reveals a cluster of six MADS-box transcription factors as candidate genes for regulation of terminal bud formation. Tree Genet. Genomes 4, 495–507. doi: 10.1007/s11295-007-0126-9 - DOI
    1. Bolger A. M., Lohse M., Usadel B. (2014). Trimmomatic: a flexible trimmer for illumina sequence data. Bioinformatics 30, 2114–2120. doi: 10.1093/bioinformatics/btu170 - DOI - PMC - PubMed