

Identification of biomarkers associated with the invasion of nonfunctional pituitary neuroendocrine tumors based on the immune microenvironment
- PMID: 37522128
- PMCID: PMC10376796
- DOI: 10.3389/fendo.2023.1131693
Identification of biomarkers associated with the invasion of nonfunctional pituitary neuroendocrine tumors based on the immune microenvironment
Abstract
Introduction: The invasive behavior of nonfunctioning pituitary neuroendocrine tumors (NF-PitNEts) affects complete resection and indicates a poor prognosis. Cancer immunotherapy has been experimentally used for the treatment of many tumors, including pituitary tumors. The current study aimed to screen the key immune-related genes in NF-PitNEts with invasion.
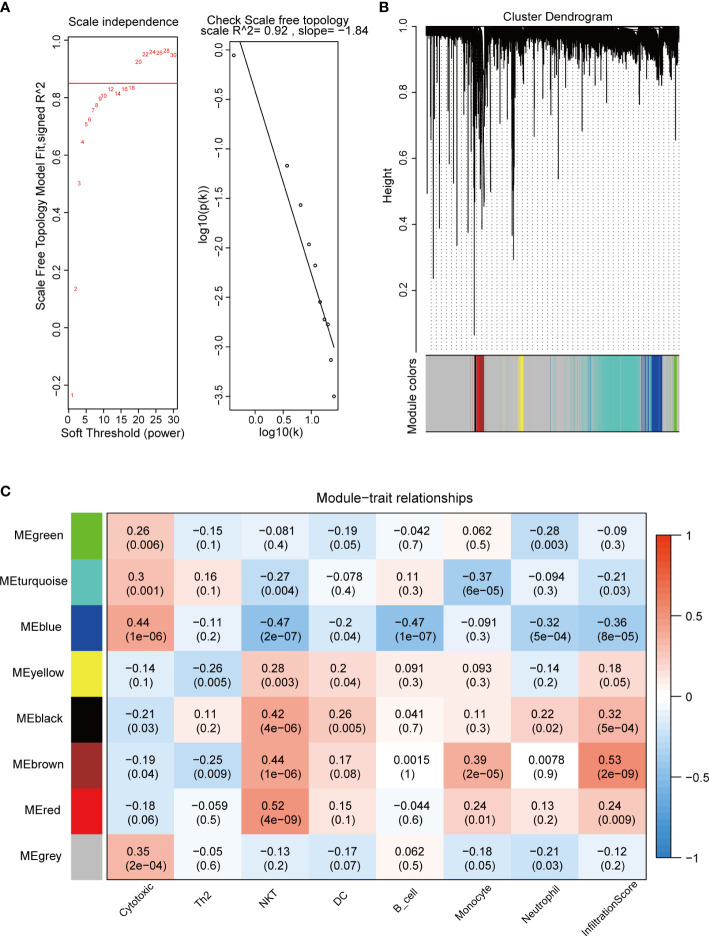
Methods: We used two cohorts to explore novel biomarkers in NF-PitNEts. The immune infiltration-associated differentially expressed genes (DEGs) were obtained based on high/low immune scores, which were calculated through the ESTIMATE algorithm. The abundance of immune cells was predicted using the ImmuCellAI database. WGCNA was used to construct a coexpression network of immune cell-related genes. Random forest analysis was used to select the candidate genes associated with invasion. The expression of key genes was verified in external validation set using quantitative real-time polymerase chain reaction (qRT‒PCR).
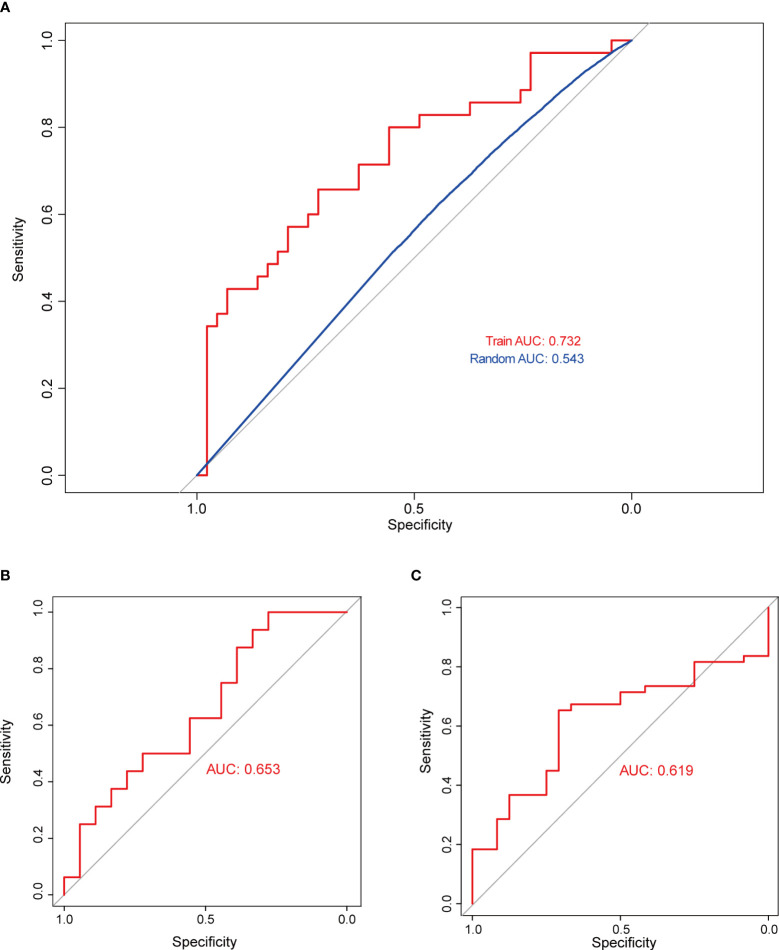
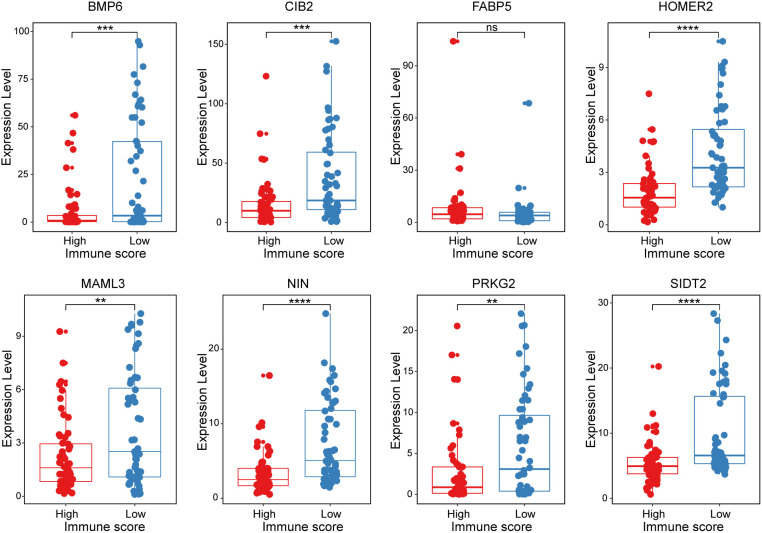
Results: The immune and invasion related DEGs was obtained based on the first dataset of NF-PitNEts (n=112). The immune cell-associated modules in NF-PitNEts were calculate by WGCNA. Random forest analysis was performed on 81 common genes intersected by immune-related genes, invasion-related genes, and module genes. Then, 20 of these genes with the highest RF score were selected to construct the invasion and immune-associated classification model. We found that this model had high prediction accuracy for tumor invasion, which had the largest area under the receiver operating characteristic curve (AUC) value in the training dataset from the first dataset (n=78), the self-test dataset from the first dataset (n=34), and the independent test dataset (n=73) (AUC=0.732/0.653/0.619). Functional enrichment analysis revealed that 8 out of the 20 genes were enriched in multiple signaling pathways. Subsequently, the 8-gene (BMP6, CIB2, FABP5, HOMER2, MAML3, NIN, PRKG2 and SIDT2) classification model was constructed and showed good efficiency in the first dataset (AUC=0.671). In addition, the expression levels of these 8 genes were verified by qRT‒PCR.
Conclusion: We identified eight key genes associated with invasion and immunity in NF-PitNEts that may play a fundamental role in invasive progression and may provide novel potential immunotherapy targets for NF-PitNEts.
Keywords: WGCNA; biomarkers; immune microenvironment; invasive; nonfunctioning pituitary neuroendocrine tumors (NF-PitNEts).
Copyright © 2023 Wu, Guo, Fang, Liu, Li, Xie and Zhang.
Conflict of interest statement
The authors declare that the research was conducted in the absence of any commercial or financial relationships that could be construed as a potential conflict of interest.
Figures


Similar articles
-
Identification of cholesterol metabolism-related subtypes in nonfunctioning pituitary neuroendocrine tumors and analysis of immune infiltration.Lipids Health Dis. 2023 Aug 10;22(1):127. doi: 10.1186/s12944-023-01883-3. Lipids Health Dis. 2023. PMID: 37563740 Free PMC article.
-
Identification of the enhancer RNAs related to tumorgenesis of pituitary neuroendocrine tumors.Front Endocrinol (Lausanne). 2023 Jul 18;14:1149997. doi: 10.3389/fendo.2023.1149997. eCollection 2023. Front Endocrinol (Lausanne). 2023. PMID: 37534217 Free PMC article.
-
Quantitative Acetylomics Revealed Acetylation-Mediated Molecular Pathway Network Changes in Human Nonfunctional Pituitary Neuroendocrine Tumors.Front Endocrinol (Lausanne). 2021 Oct 12;12:753606. doi: 10.3389/fendo.2021.753606. eCollection 2021. Front Endocrinol (Lausanne). 2021. PMID: 34712204 Free PMC article.
-
Aggressive nonfunctioning pituitary neuroendocrine tumors.Brain Tumor Pathol. 2022 Oct;39(4):183-199. doi: 10.1007/s10014-022-00441-6. Epub 2022 Jun 20. Brain Tumor Pathol. 2022. PMID: 35725837 Review.
-
Immune landscape and progress in immunotherapy for pituitary neuroendocrine tumors.Cancer Lett. 2024 Jun 28;592:216908. doi: 10.1016/j.canlet.2024.216908. Epub 2024 Apr 25. Cancer Lett. 2024. PMID: 38677640 Review.
Cited by
-
scRNA sequencing technology for PitNET studies.Front Endocrinol (Lausanne). 2024 Jul 24;15:1414223. doi: 10.3389/fendo.2024.1414223. eCollection 2024. Front Endocrinol (Lausanne). 2024. PMID: 39114291 Free PMC article. Review.
-
Role of Tumor Microenvironment in Pituitary Neuroendocrine Tumors: New Approaches in Classification, Diagnosis and Therapy.Cancers (Basel). 2023 Nov 6;15(21):5301. doi: 10.3390/cancers15215301. Cancers (Basel). 2023. PMID: 37958474 Free PMC article. Review.
References
Publication types
MeSH terms
Substances
LinkOut - more resources
Full Text Sources
Medical
Research Materials
Miscellaneous