

Single-cell profiling of muscle-infiltrating T cells in idiopathic inflammatory myopathies
- PMID: 37522383
- PMCID: PMC10565639
- DOI: 10.15252/emmm.202217240
Single-cell profiling of muscle-infiltrating T cells in idiopathic inflammatory myopathies
Abstract
Idiopathic inflammatory myopathies (IIM) are rare autoimmune systemic diseases characterized by muscle weakness and the presence of muscle-infiltrating T cells. IIM represent a clinical challenge due to heterogeneity of symptoms and variability of response to immunosuppressive treatment. Here, we performed in-depth single-cell sequencing on muscle-infiltrating T cells and peripheral blood memory T cells in six patients with recently diagnosed IIM. We identified tissue resident memory T-cell (TRM ) signatures including the expression of HOBIT, XCL1 and CXCR6 in the muscle biopsies of all patients with IIM. Clonally expanded T-cell clones were mainly found among cytotoxic and TRM implying their role in the disease pathogenesis. Finally, identical expanded T-cell clones persisting at follow-up in the muscle tissue of two patients suggest their involvement in disease chronicity. Our study reveals a muscle tissue resident memory T-cell signature in patients with IIM and a transcriptomic map to identify novel therapeutic targets in IIM.
Keywords: HOBIT; T-cell receptor; idiopathic inflammatory myopathies; muscle; tissue resident memory T cells.
© 2023 The Authors. Published under the terms of the CC BY 4.0 license.
Conflict of interest statement
The authors declare that they have no conflict of interest.
Figures
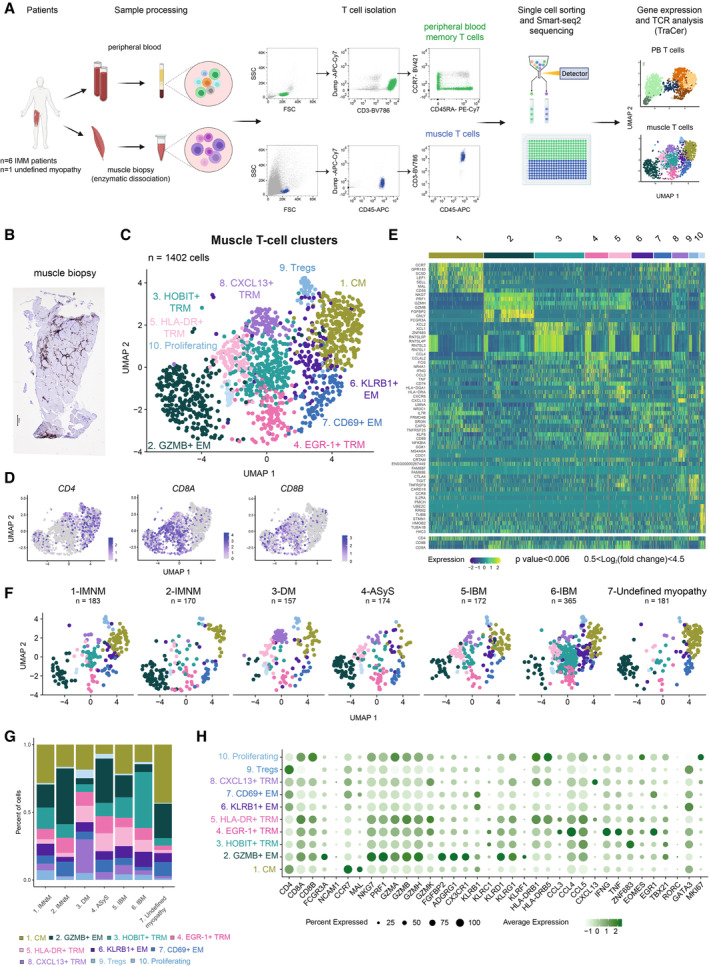
Methodological workflow including isolation of memory T cells from peripheral blood (PB, in green) and muscle T cells (in blue) from muscle biopsies, followed by Smart‐seq2 single‐cell sequencing in six patients with idiopathic inflammatory myopathies (IIM) and one with an undefined myopathy.
Representative CD3 immunohistochemistry staining of a muscle biopsy from a patient with inclusion body myositis (6‐IBM).
UMAP displaying 10 T‐cell clusters in the muscle of patients with IIM (n = 1,402 cells).
UMAP feature plots displaying the normalized expression of CD4, CD8A, and CD8B genes.
Heatmap showing the normalized and scaled expression of the top seven differentially expressed genes per cluster (Wilcoxon Ranked Sum test, P value < 0.006; 0.5 < log2 fold change < 4.5) as well as CD4, CD8B and CD8A gene expression.
UMAP displaying 10 muscle T‐cell clusters split by patient.
Stacked bar plots of the muscle T‐cell cluster composition in each patient with IIM. Color corresponds to muscle T‐cell clusters depicted in (C).
Dot plot showing the expression level of selected T‐cell effector function related genes per cluster (n = 6 IIM, n = 1 undefined myopathy). Circle size indicates percentage of cells expressing, color intensity indicates average expression.
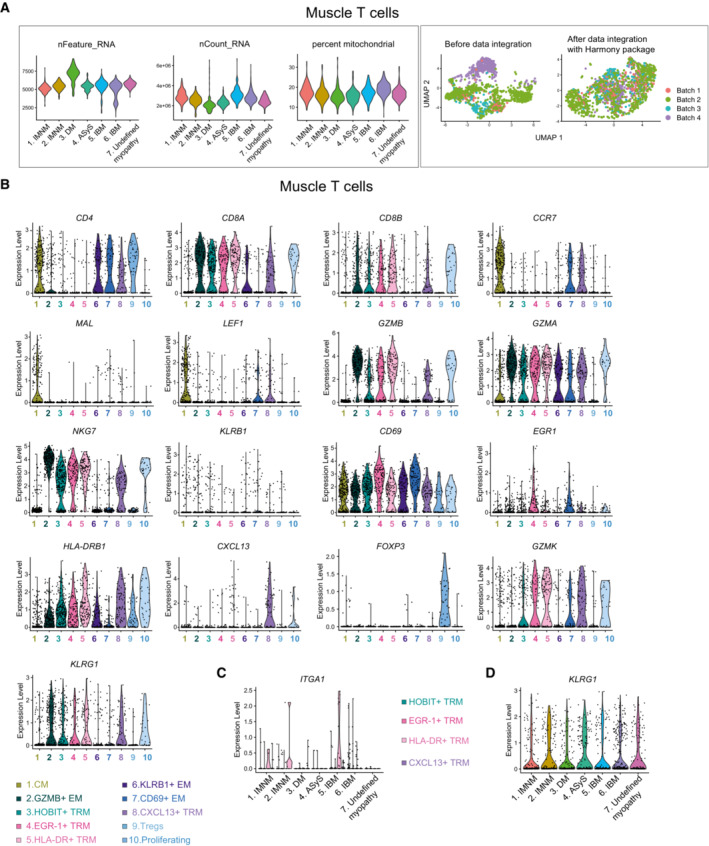
Left panel: Violin plots showing the total number of genes captured, the number of transcripts and percentage of mitochondrial genes per patient. Right panel: UMAPs displaying before data integration and after data integration with Harmony package per sequencing batch (n = 6 IIM, n = 1 undefined myopathy).
Violin plots showing the expression levels of selected differentially expressed genes per cluster in muscle T cells. Each color represents one T‐cell cluster in the muscle tissue as indicated (n = 6 IIM, n = 1 undefined myopathy).
Violin plot showing the expression level of ITGA1 per patient in the four TRM clusters. Each color represents one TRM cluster as indicated (n = 6 IIM, n = 1 undefined myopathy).
Violin plot showing the expression level of KLRG1 in muscle T cells per patient.
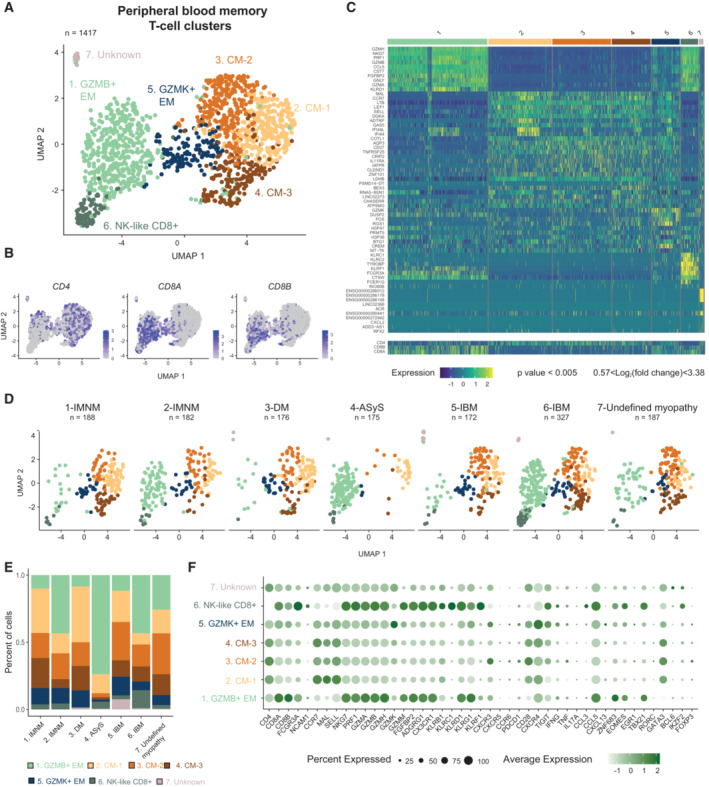
UMAP displaying seven T‐cell clusters identified in peripheral blood (PB) of patients with IIM (n = 1,417 cells).
UMAP feature plots displaying the normalized expression of CD4, CD8A, and CD8B genes.
Heatmap showing the normalized and scaled expression of the top 10 differentially expressed genes per cluster (Wilcoxon Rank Sum test, P value < 0.005; 0.57 < log2 fold change < 3.38) as well as CD4, CD8B and CD8A gene expression.
UMAP displaying seven PB T‐cell clusters split by patient.
Stacked bar plots of the PB T‐cell cluster composition in each patient with IIM. Color corresponds to the PB T‐cell clusters depicted in (A).
Dot plot showing the expression level of selected T‐cell effector function related genes per cluster (n = 6 IIM, n = 1 undefined myopathy). Circle size indicates percentage of cells expressing, color intensity indicates average expression.
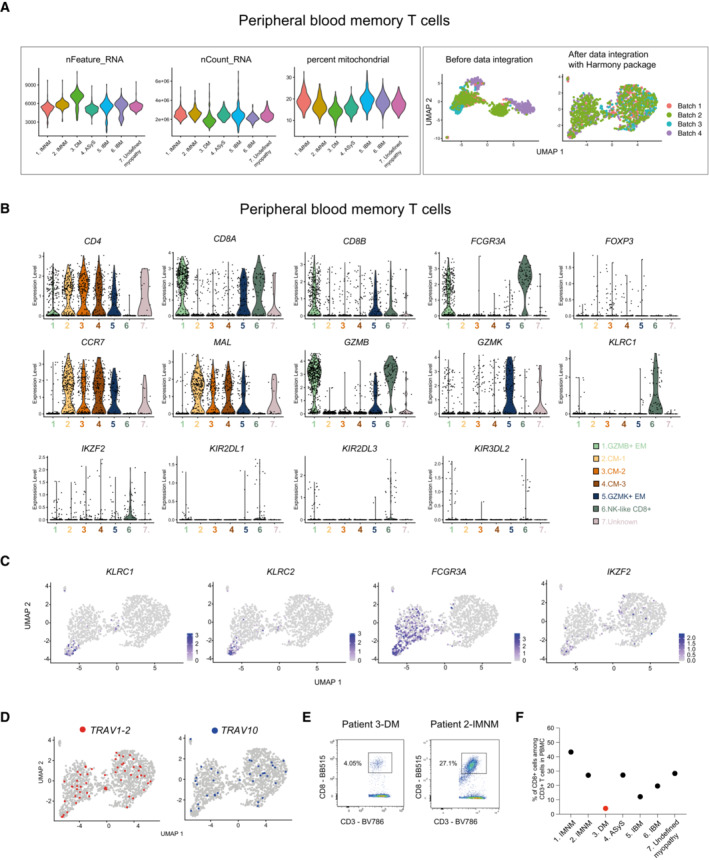
Left panel: Violin plots showing the total number of genes captured, the number of transcripts and percentage of mitochondrial genes per patient. Right panel: UMAPs displaying before data integration and after data integration with Harmony package per sequencing batch (n = 6 IIM, n = 1 undefined myopathy).
Violin plots showing the expression level of selected genes in peripheral blood memory T cells from patients with IIM (n = 6 IIM, n = 1 undefined myopathy).
UMAP feature plots displaying the normalized expression of KLRC1, KLRC2, FCGR3A and IKZF2 genes.
UMAP feature plot showing cells using TRAV1‐2 and TRAV10 genes.
Flow cytometry dot plots showing the frequency of CD3+CD8+ T cells in peripheral blood (PB) of patients with DM (left) and IMNM (right) patients.
Frequency of CD3+CD8+ T cells in PB of patients with IIM.
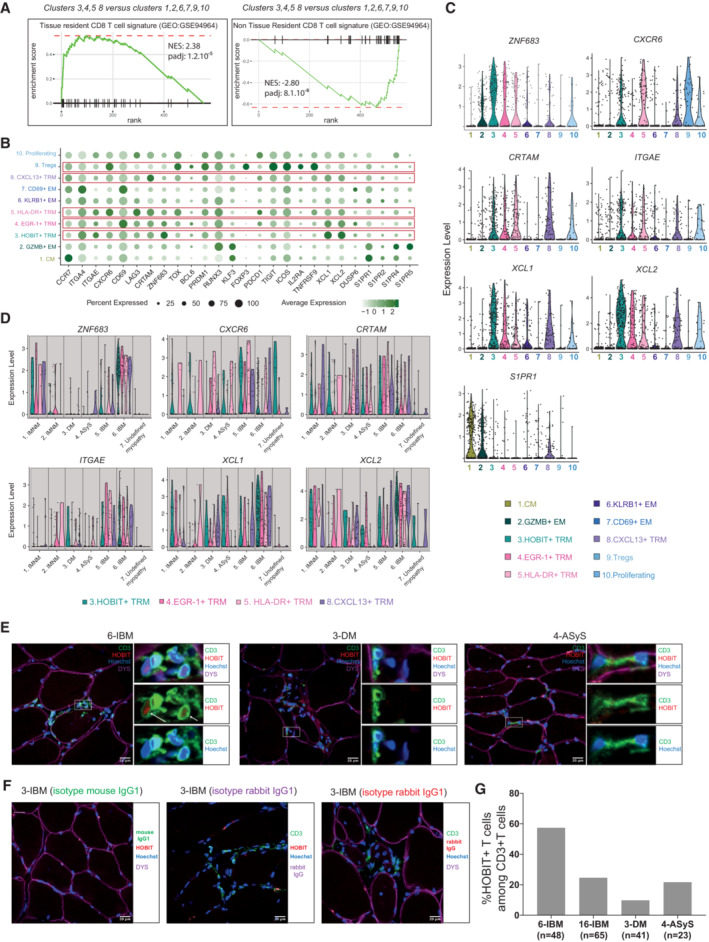
Gene Set Enrichment Analysis (GSEA) plot comparing muscle T‐cell clusters 3, 4, 5, 8 versus clusters 1, 2, 6, 7, 9, 10 for the TRM signature described in Kumar et al, .
Dot plot showing the normalized expression of selected genes coding for TRM and regulatory (Tregs) signatures per cluster (n = 6 IIM, n = 1 undefined myopathy). Circle size indicates percentage of cells expressing, color intensity indicates average expression.
Violin plots displaying the normalized expression level of selected genes per cluster in muscle T cells (n = 6 IIM, n = 1 undefined myopathy).
Violin plots displaying the normalized expression level of selected genes per patient in the four TRM clusters (n = 6 IIM, n = 1 undefined myopathy).
Representative immunofluorescence stainings of HOBIT (red), CD3 (green), dystrophin (purple) and Hoechst 33342 (blue) performed on muscle tissue for patient 6 (IBM), patient 3 (DM) and 4 (ASyS). Images were acquired using a LSM 880 confocal without Airyscan microscope (63× oil objective). Scale bar = 20 μm. The white arrows show HOBIT+ T cells.
Isotype mouse and rabbit IgG1 immunofluorescence stainings.
Quantification of HOBIT+ T cells in muscle biopsies of patient 6 (IBM), patient 16 (IBM), patient 3 (DM) and 4 (ASyS). The number of counted CD3‐positive T cells is indicated under each bar as n.
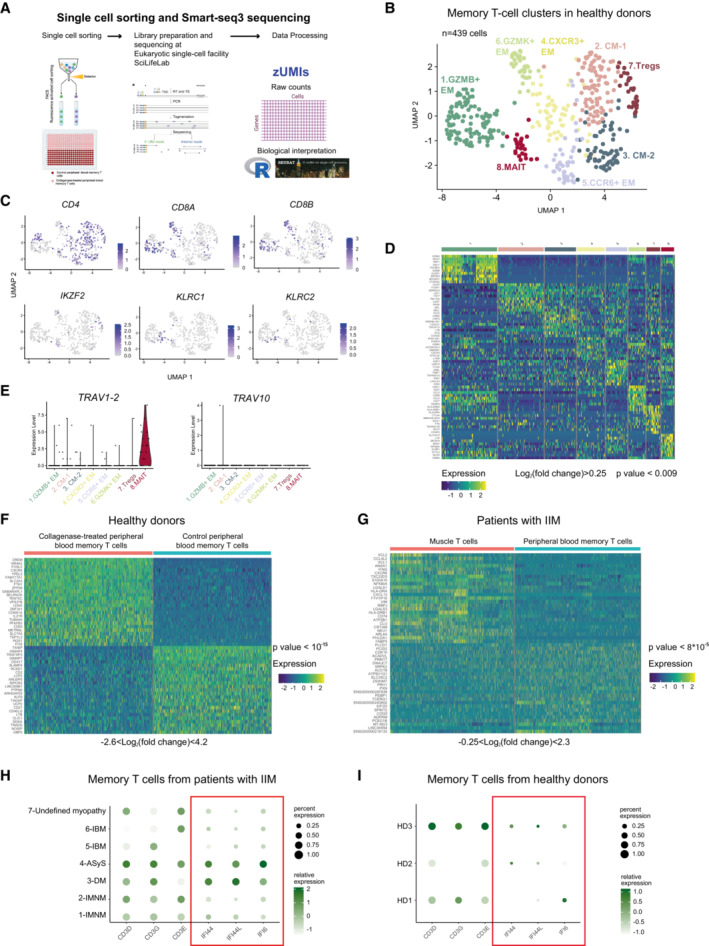
Workflow for Smart‐seq3 sequencing.
UMAP displaying eight memory T‐cell clusters identified in peripheral blood (PB) of healthy donors (n = 439 cells, n = 3 donors).
UMAP feature plots displaying the normalized expression of CD4, CD8A, CD8B, IKZF2, KLRC1 and KLRC2.
Heatmap showing the normalized and scaled expression of the top 10 differentially expressed genes per cluster (Wilcoxon Rank Sum, P value < 0.009; log2 fold change > 0.25).
Violin plots showing the expression level of TRAV1‐2 and TRAV10 genes per cluster in PB memory T cells from healthy donors (n = 3).
Heatmap showing the normalized and scaled expression of the top 25 upregulated and top 25 downregulated genes sorted by average log2FC values (Wilcoxon Rank Sum, P value < 10−15, −2.6 < log2 fold change < 4.2).
Heatmap showing the normalized and scaled expression of the top 25 upregulated and top 25 downregulated genes in muscle T cells versus PB memory T cells from patients with IIM after filtering out genes identified in Dataset EV5 (Wilcoxon Rank Sum, P value < 8 × 10⁻⁵, −0.25 < log2 fold change < 2.3).
Dotplots showing selected genes in PB of patients with IIM (n = 7).
Dotplots showing selected genes in PB of healthy donors (n = 3).
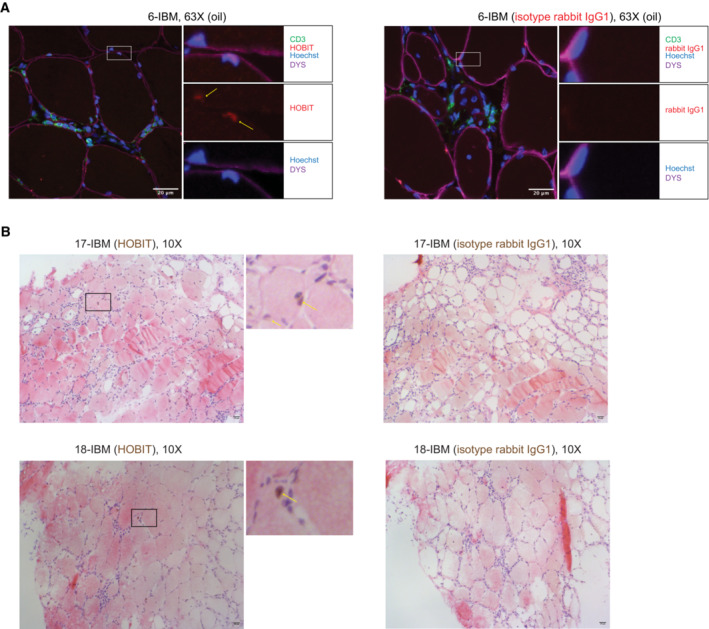
Representative immunofluorescence stainings of HOBIT (red), CD3 (green), dystrophin (purple) and Hoechst 33342 (blue) performed on muscle tissue from patient 6 (IBM) (left panel) and isotype rabbit IgG1 staining (red) (right panel). Images were acquired using a LSM 880 confocal without Airyscan microscope (63× oil objective). Scale bar = 20 μm. The yellow arrows show HOBIT expression in muscle nuclei.
Representative immunohistochemistry stainings of HOBIT (brown, left panels), and isotype rabbit IgG (right panels) with hematoxylin (purple) and eosin (red) stainings performed on muscle tissue of two patients with IBM. Images were acquired using a Leica Reichert Polyvar 2 light microscope (10× objective). Scale bar = 20 μm. The yellow arrows show HOBIT expression in muscle nuclei. IBM: Inclusion Body Myositis.
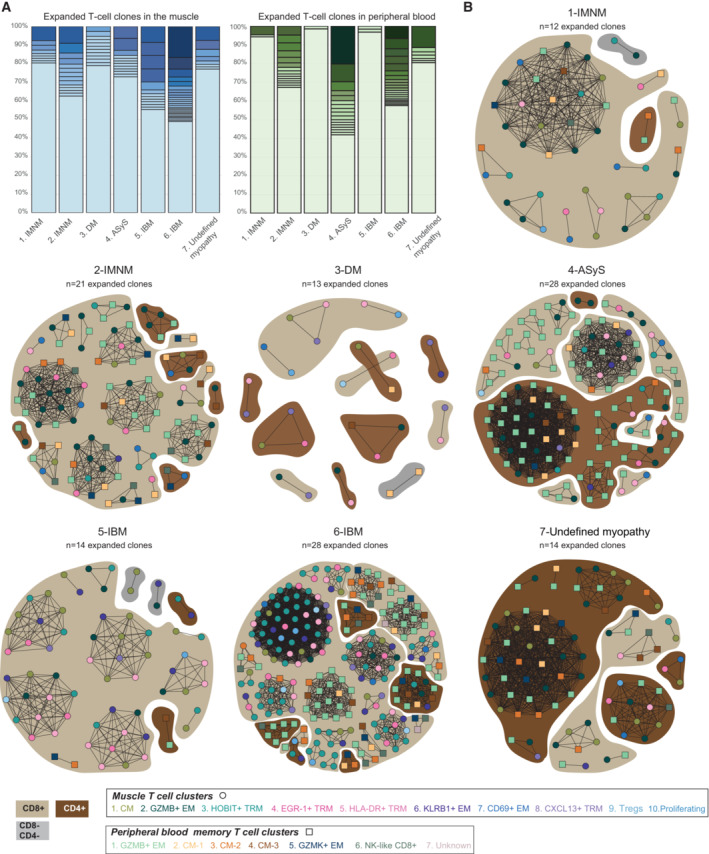
Stacked bar plots showing the frequency of T‐cell clones per patient in the muscle (left) and peripheral blood (PB) (right), including non‐expanded (unique, lightest shade) and expanded clones (colored from light to dark shades, from less expanded to more expanded clones).
Network plots displaying T‐cell expanded clones per patient, in both muscle (circle) and PB (square). The color of the shape corresponds to the T‐cell cluster as indicated. Dark brown indicates CD4+ T cells, light brown indicates CD8+ T cells, grey indicates CD8–CD4– T cells. The connecting line between at least two cells indicates sharing of CDR3 sequences. n indicates the number of expanded T cell‐clones per patient.
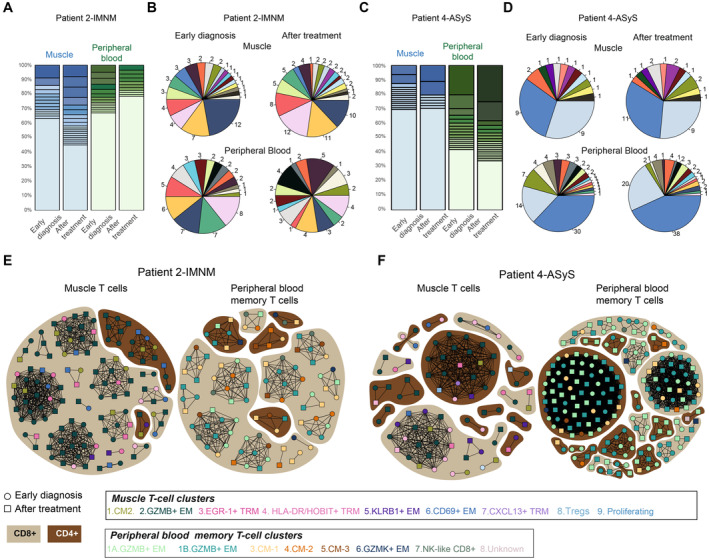
Stacked bar plots displaying the frequency of T‐cell clones in patient 2 (IMNM) at early diagnosis and after treatment in muscle and peripheral blood (PB).
Pie charts showing the shared CDR3 sequences (expanded or unique) between early diagnosis (left panel) and after treatment (right panel) in muscle (upper panel) or PB (lower panel) in patient 2 (IMNM). The same color shows identical CDR3 sequences. Numbers indicate number of cells per CDR3 sequence.
Stacked bar plots displaying the frequency of T‐cell clones in patient 4 (ASyS) at early diagnosis and after treatment in muscle and PB.
Pie charts showing shared CDR3 sequences (expanded or unique) between early diagnosis (left panel) and after treatment (right panel) in muscle (upper panel) or PB (lower panel) in patient 4 (ASyS). The same color shows identical CDR3 sequence. Numbers indicate number of cells per clone.
Network plots displaying shared and/or expanded CDR3 sequences in patient 2 (IMNM), in muscle (left) and PB (right) at early diagnosis (circle) and after immunosuppressive treatment (square).
Network plots displaying shared and/or expanded CDR3 sequences in patient 4 (ASyS), in muscle (left) and PB (right) at early diagnosis (circle) and after immunosuppressive treatment (square).
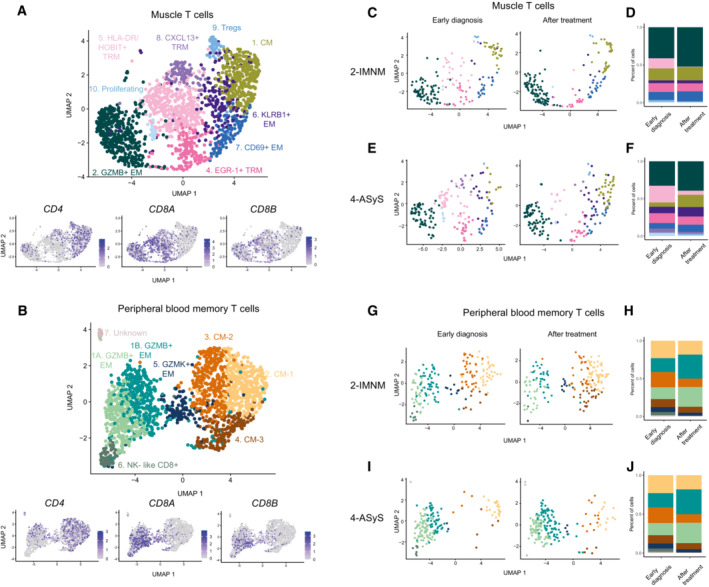
Upper Panel: UMAP displaying nine T‐cell clusters in the muscle of patients with idiopathic inflammatory myopathies (IIM) at early diagnosis (n = 7) and after treatment (n = 2) (n = 1747 cells). Lower panel: UMAP feature plots displaying the normalized expression of CD4, CD8A, and CD8B.
Upper panel: UMAP displaying eight T‐cell clusters in peripheral blood (PB) memory T cells of patients with IIM at early diagnosis (n = 7) and after treatment (n = 2) (n = 1788 cells). Lower panel: UMAP feature plots displaying the normalized expression of CD4, CD8A and CD8B.
UMAP displaying nine T‐cell clusters split by treatment status in muscle of patient 2 (IMNM).
Stacked bar plots of T‐cell cluster composition in early diagnosis and after treatment in muscle of patient 2 (IMNM).
UMAP displaying nine T‐cell clusters split by treatment status in muscle of patient 4 (ASyS).
Stacked bar plots of T‐cell cluster composition in early diagnosis and after treatment in muscle of patient 4 (ASyS).
UMAP displaying eight T‐cell clusters split by treatment status in PB of patient 2 (IMNM).
Stacked bar plots of T‐cell cluster composition in early diagnosis and after treatment in PB of patient 2 (IMNM).
UMAP displaying eight T‐cell clusters split by treatment status in PB of patient 4 (ASyS).
Stacked bar plots of T‐cell cluster composition in early diagnosis and after treatment in PB of patient 4 (ASyS).
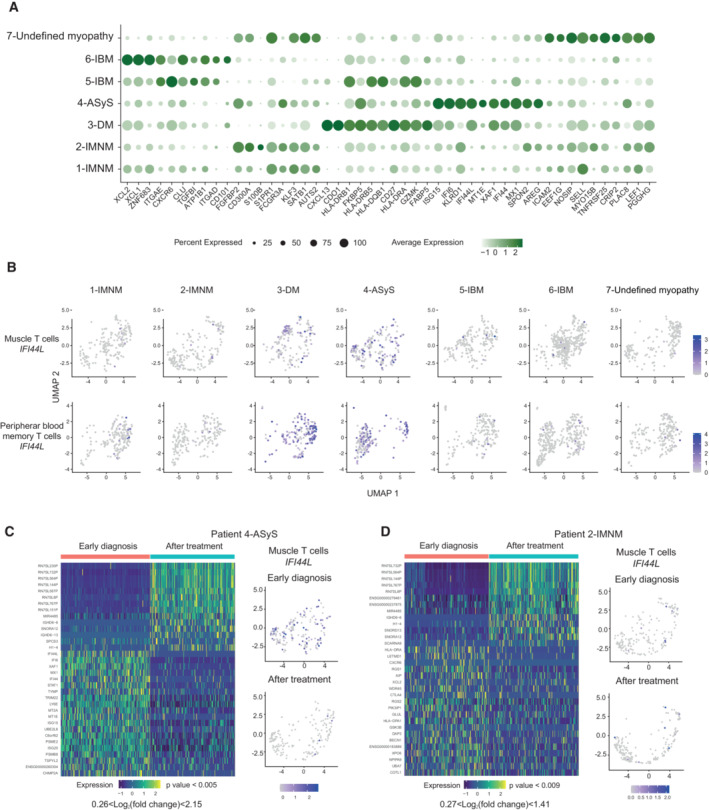
Dot plot displaying genes selected from the top 10 differentially expressed genes per subgroup of disease in muscle T cells. Circle size indicates the percentage of cells expressing, color intensity indicates average expression.
Feature plots of IFI44L expression levels in each patient at early diagnosis in muscle T cells (upper panel) and peripheral blood memory T cells (lower panel).
Left panel: Heatmap showing the normalized and scaled expression of the 10 most upregulated genes and the 10 most downregulated genes (based on average log2FC) in T cells when comparing gene expression at early diagnosis versus gene expression after treatment in the muscle of patient 4 (ASyS) (0.26 < log2 fold change < 2.15, P value < 0.005). Right panel: UMAP feature plot displaying IFI44L gene expression at early diagnosis (upper) and after treatment (lower) in muscle T cells.
Left panel: Heatmap showing the normalized and scaled expression of the 10 most upregulated genes and the 10 most downregulated genes (based on average log2FC) in T cells when comparing gene expression at early diagnosis versus gene expression after treatment in the muscle of patient 2 (IMNM) (0.27 < log2 fold change < 1.41, P value < 0.009). Right panel: UMAP feature plot displaying IFI44L gene expression at early diagnosis (upper) and after treatment (lower) in muscle T cells.
Comment in
-
Single cell RNA sequencing sheds light on infiltrating T cells in idiopathic inflammatory myopathies.EMBO Mol Med. 2023 Oct 11;15(10):e18190. doi: 10.15252/emmm.202318190. Epub 2023 Sep 28. EMBO Mol Med. 2023. PMID: 37768011 Free PMC article.
References
-
- Allenbach Y, Arouche‐Delaperche L, Preusse C, Radbruch H, Butler‐Browne G, Champtiaux N, Mariampillai K, Rigolet A, Hufnagl P, Zerbe N et al (2018) Necrosis in anti‐SRP(+) and anti‐HMGCR(+)myopathies: role of autoantibodies and complement. Neurology 90: e507–e517 - PubMed
-
- Arahata K, Engel AG (1984) Monoclonal antibody analysis of mononuclear cells in myopathies. I: quantitation of subsets according to diagnosis and sites of accumulation and demonstration and counts of muscle fibers invaded by T cells. Ann Neurol 16: 193–208 - PubMed
-
- Arahata K, Engel AG (1986) Monoclonal antibody analysis of mononuclear cells in myopathies. III: immunoelectron microscopy aspects of cell‐mediated muscle fiber injury. Ann Neurol 19: 112–125 - PubMed
-
- Argyriou A, Wadsworth MH 2nd, Lendvai A, Christensen SM, Hensvold AH, Gerstner C, van Vollenhoven A, Kravarik K, Winkler A, Malmstrom V et al (2022) Single cell sequencing identifies clonally expanded synovial CD4(+) TPH cells expressing GPR56 in rheumatoid arthritis. Nat Commun 13: 4046 - PMC - PubMed
Publication types
MeSH terms
LinkOut - more resources
Full Text Sources
Medical
