. 2023 Jul 31;183(9):963-972.
doi: 10.1001/jamainternmed.2023.3070. Online ahead of print.

National Estimates of the Adult Diabetes Care Continuum in India, 2019-2021

Affiliations

National Estimates of the Adult Diabetes Care Continuum in India, 2019-2021

Jithin Sam Varghese et al. JAMA Intern Med. .

Abstract

Importance: Diabetes is widespread and treatable, but little is known about the diabetes care continuum (diagnosis, treatment, and control) in India and how it varies at the national, state, and district levels.

Objective: To estimate the adult population levels of diabetes diagnosis, treatment, and control in India at national, state, and district levels and by sociodemographic characteristics.

Design, setting, and participants: In this cross-sectional, nationally representative survey study from 2019 to 2021, adults in India from 28 states, 8 union territories, and 707 districts were surveyed for India's Fifth National Family Health Survey (NFHS-5). The survey team collected data on blood glucose among all adults (18-98 years) who were living in the same household as eligible participants (pregnant or nonpregnant female individuals aged 15-49 years and male individuals aged 15-54 years). The overall sample consisted of 1 895 287 adults. The analytic sample was restricted to those who either self-reported having diabetes or who had a valid measurement of blood glucose.

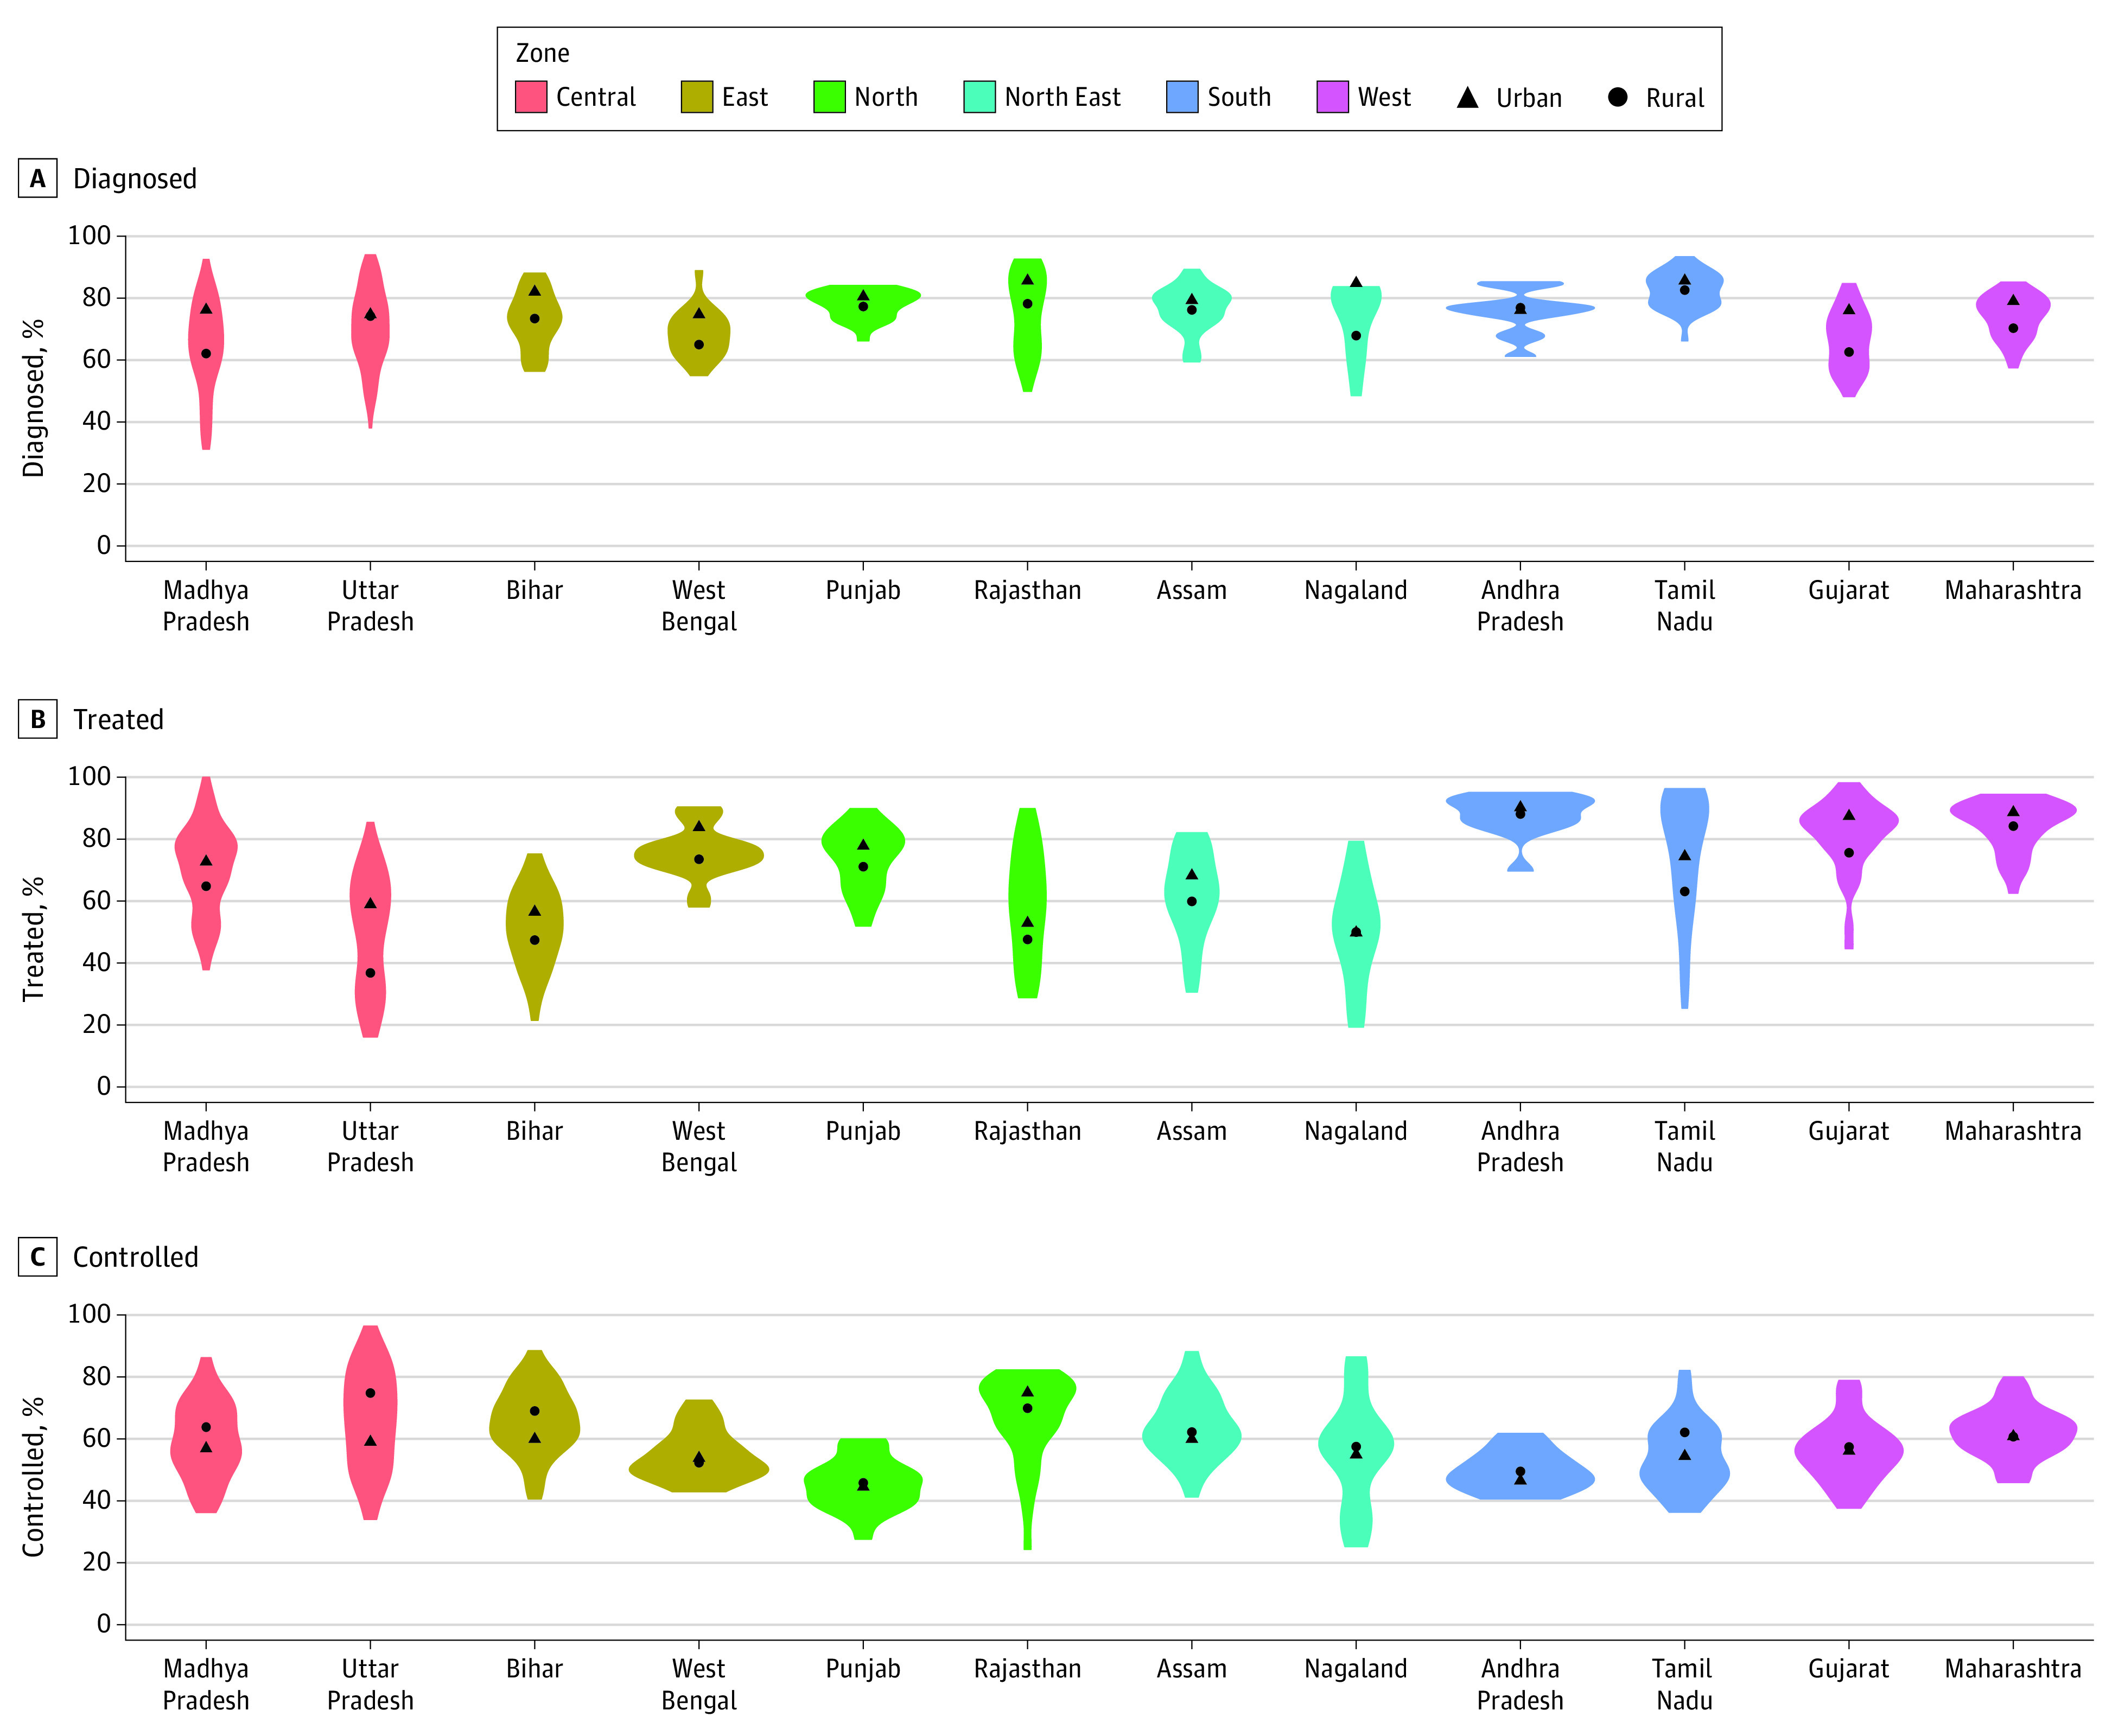
Exposures: The exposures in this survey study were district and state residence; urban vs rural residence; age (18-39 years, 40-64 years, or ≥65 years); sex; and household wealth quintile.

Main outcomes and measures: Diabetes was defined by self-report or high capillary blood glucose (fasting: ≥126 mg/dL [to convert to mmol/L, multiply by 0.0555]; nonfasting: ≥220 mg/dL). Among respondents who had previously been diagnosed with diabetes, the main outcome was the proportion treated based on self-reported medication use and the proportion controlled (fasting: blood glucose <126 mg/dL; nonfasting: ≤180 mg/dL). The findings were benchmarked against the World Health Organization (WHO) Global Diabetes Compact targets (80% diagnosis; 80% control among those diagnosed). The variance in indicators between and within states was partitioned using variance partition coefficients (VPCs).

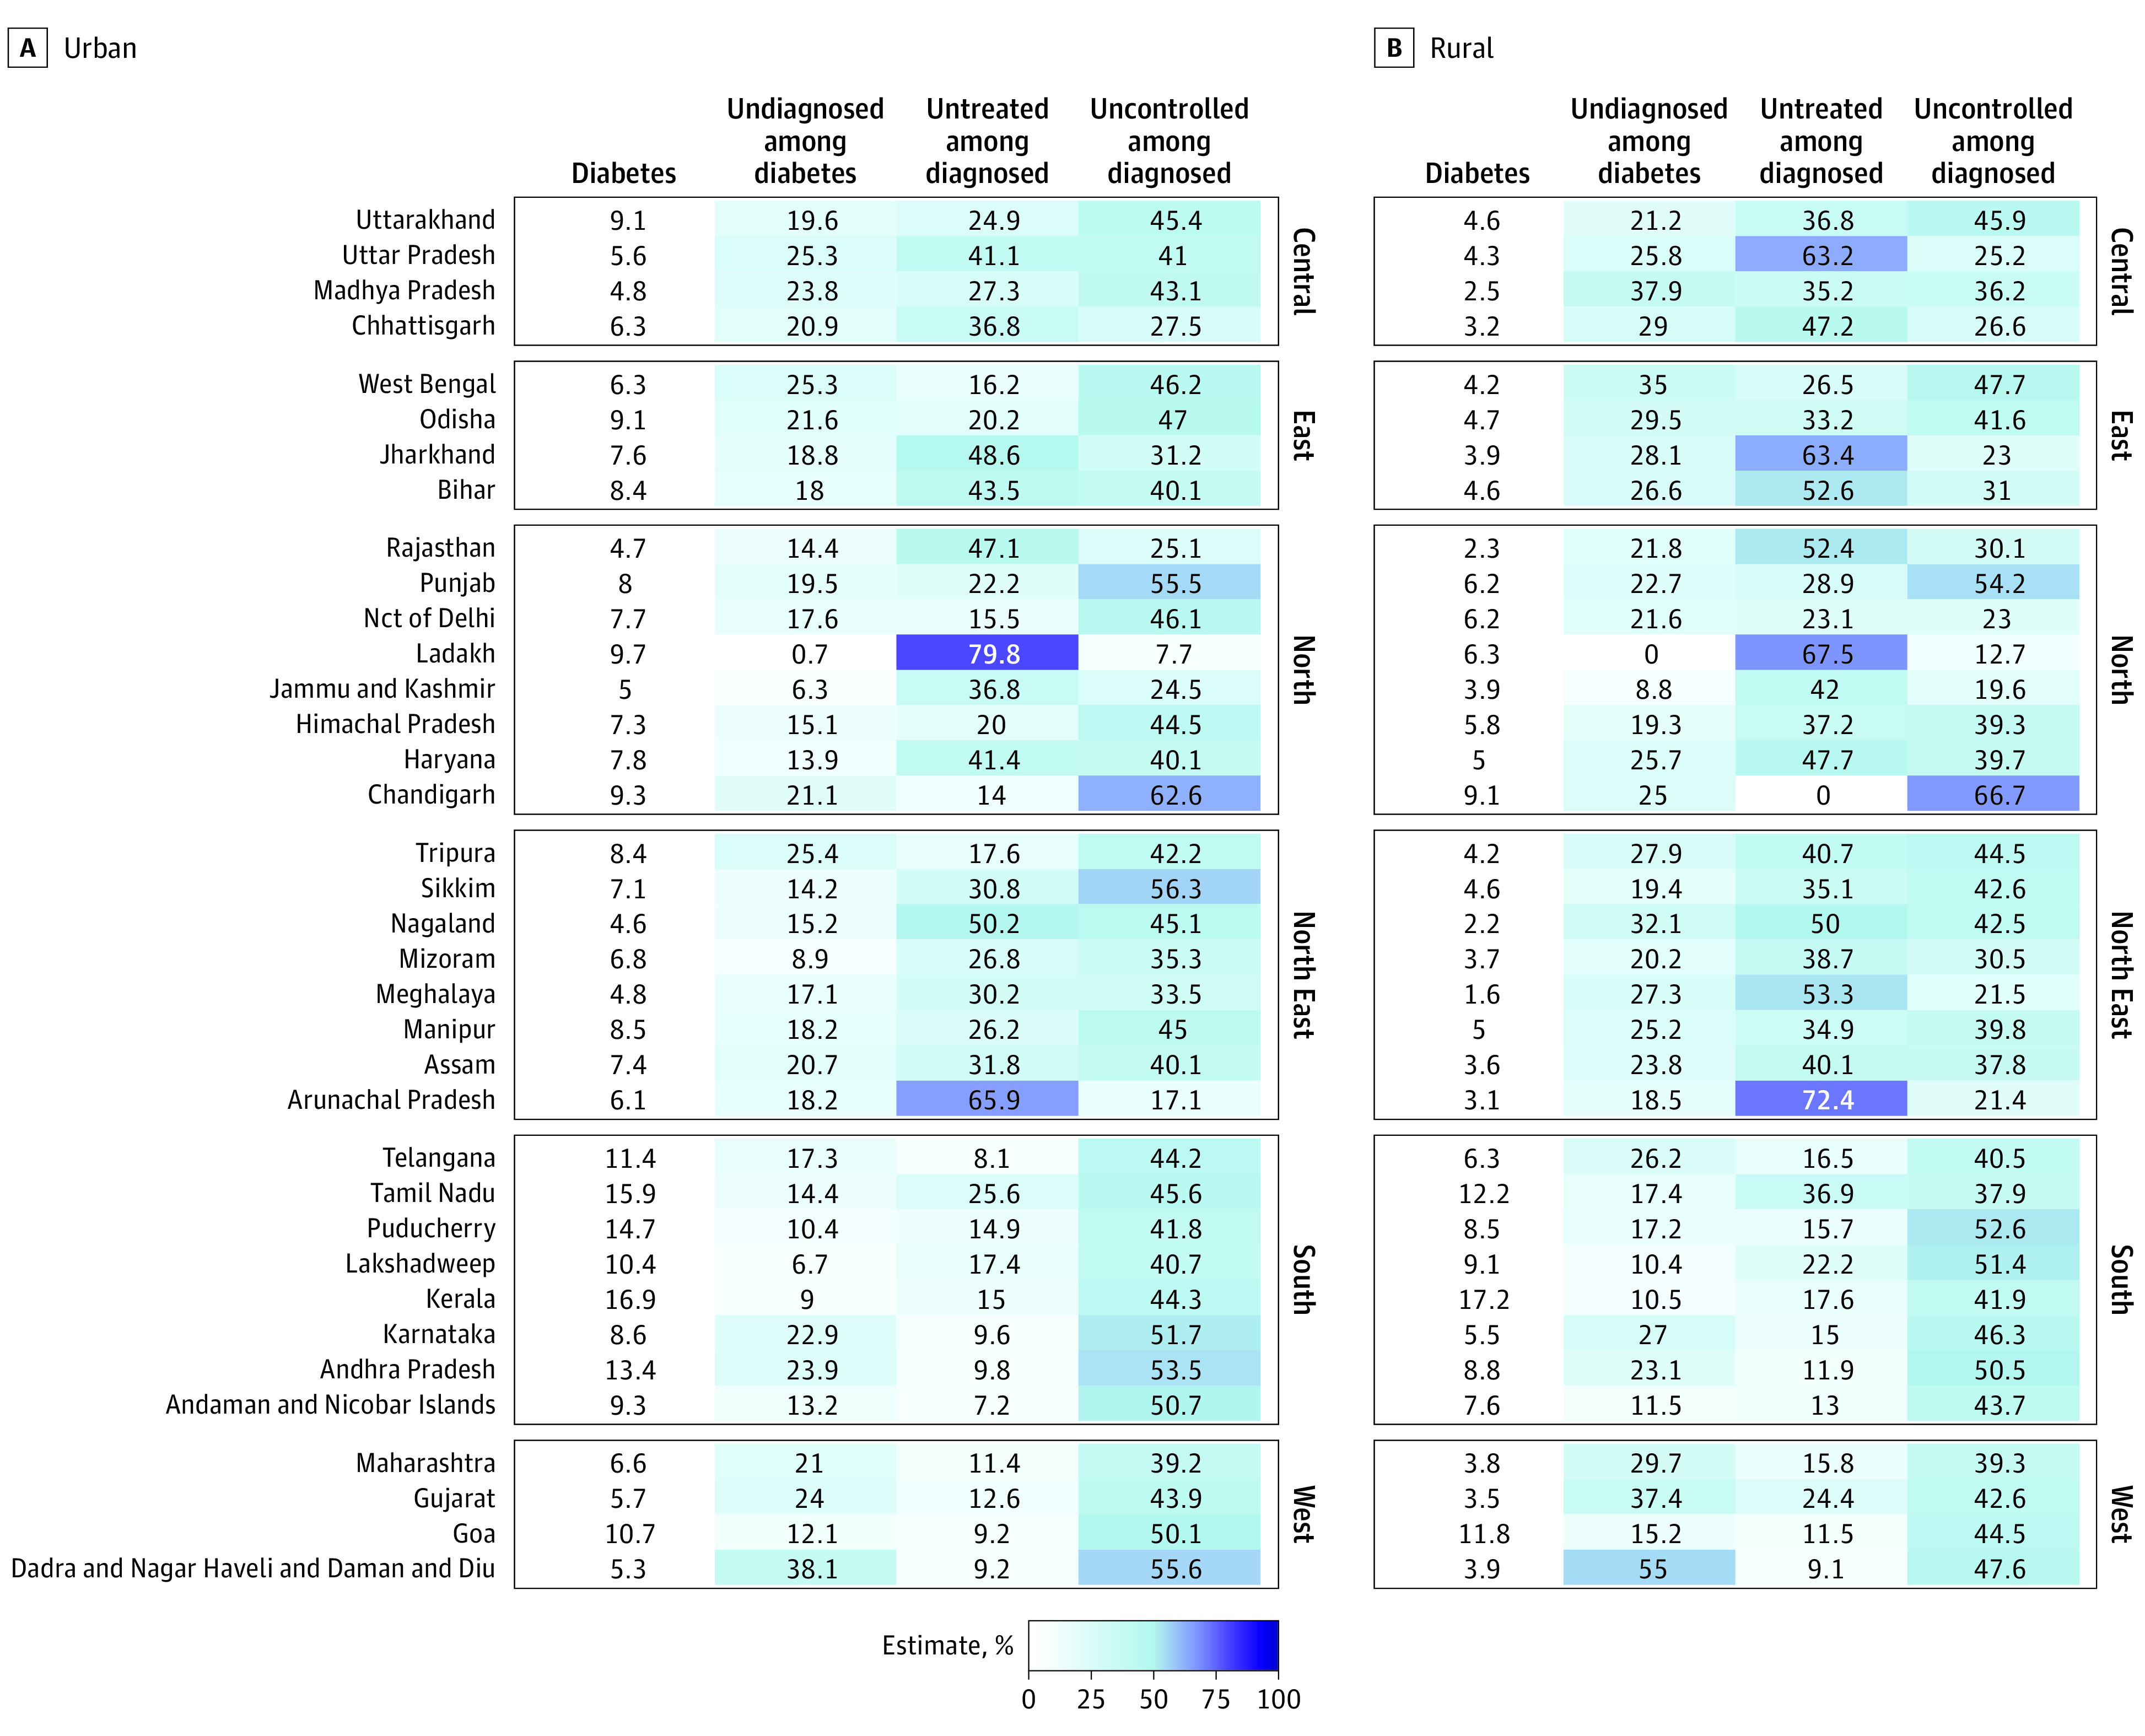
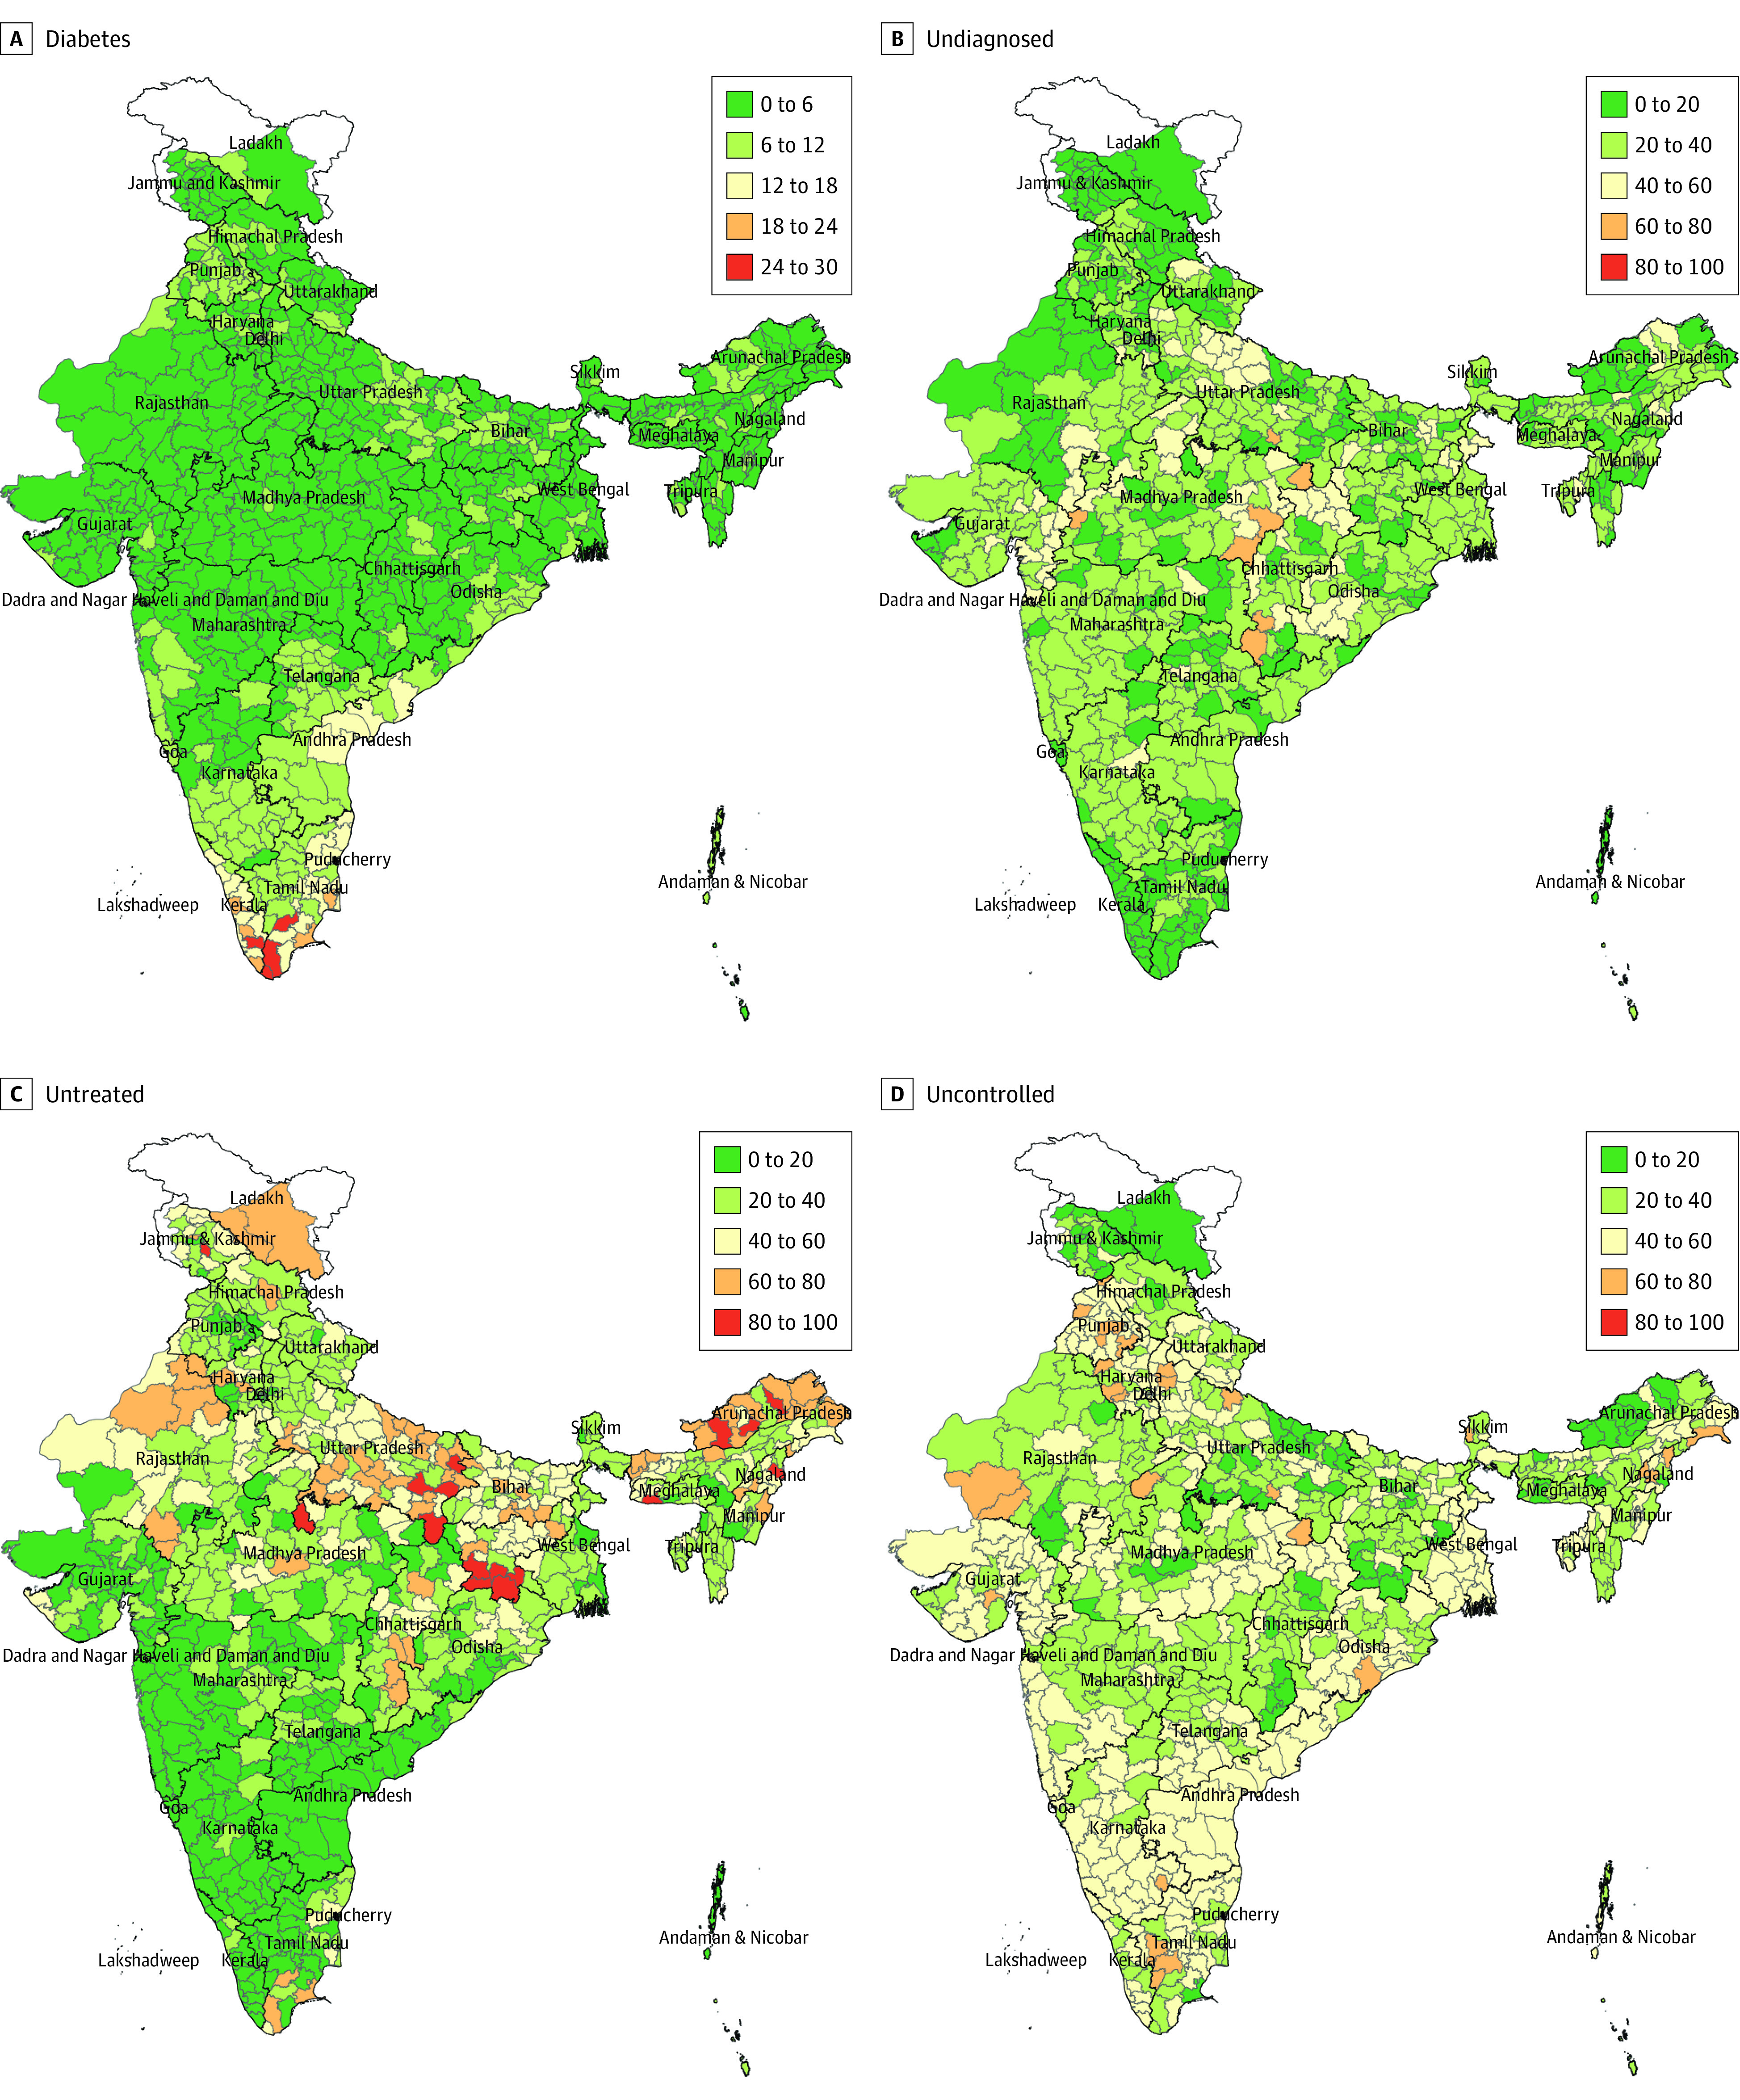
Results: Among 1 651 176 adult respondents (mean [SD] age, 41.6 [16.4] years; 867 896 [52.6%] female) with blood glucose measures, the proportion of individuals with diabetes was 6.5% (95% CI, 6.4%-6.6%). Among adults with diabetes, 74.2% (95% CI, 73.3%-75.0%) were diagnosed. Among those diagnosed, 59.4% (95% CI, 58.1%-60.6%) reported taking medication, and 65.5% (95% CI, 64.5%-66.4%) achieved control. Diagnosis and treatment were higher in urban areas, older age groups, and wealthier households. Among those diagnosed in the 707 districts surveyed, 246 (34.8%) districts met the WHO diagnosis target, while 76 (10.7%) districts met the WHO control target. Most of the variability in diabetes diagnosis (VPC, 89.1%), treatment (VPC, 85.9%), and control (VPC, 95.6%) were within states, not between states.

Conclusions and relevance: In this survey study, the diabetes care continuum in India is represented by considerable district-level variation, age-related disparities, and rural-urban differences. Surveillance at the district level can guide state health administrators to prioritize interventions and monitor achievement of global targets.


Conflict of interest statement

Conflict of Interest Disclosures: Dr Manne-Goehler reported being the site principal investigator for a COVID-19 study from Regeneron Pharmaceuticals outside the submitted work. Dr Ali reported grants from Merck & Co to Emory University, personal fees from Bayer, and personal fees from Eli Lilly and Company outside the submitted work. No other disclosures were reported.

Figures

Figure 1.
Figure 1.. National-Level Diabetes Care Cascade in Analytic Sample by Urban and Rural Residence
All values shown as columns are age-standardized estimates of proportions (error bars represent 95% CIs) in the total population (n = 1 651 176). The values above bars are the decreased values from all patients with diabetes after sequential multiplication of age-standardized proportions. The dashed curly braces indicate the denominator for the different columns. Age-standardized estimates of the performance indicators were reported for different strata at the national level. Age standardization to the distribution of the total sample was performed because different strata of schooling and wealth have different age distributions. aProportions of diagnosed diabetes were derived from patients with diabetes (from Table). bProportions of treated and controlled diabetes were derived from patients diagnosed with diabetes (from Table).
Figure 2.
Figure 2.. State-Level Unmet Need in Diabetes Care Cascade, Urban vs Rural
The total sample included 1 651 176 participants. All values are crude percentages. Undiagnosed proportions were from the group of patients with diabetes (n = 93 263). Untreated and uncontrolled diabetes proportions were from the group of patients diagnosed with diabetes (n = 67 209). Weighted estimates reported at the state level in this study were not age-standardized because the crude percentages are relevant for local decision-making. The age-standardized comparisons are presented in the interactive dashboard.
Figure 3.
Figure 3.. Diabetes Care Cascade in Analytic Sample by Urban and Rural Residence for 707 Districts
The total sample included 1 651 176 participants. All values are survey-weighted, crude percentages. Undiagnosed are among those with diabetes (n = 93 263). Untreated and uncontrolled are among those diagnosed with diabetes (n = 67 209). Weighted estimates reported at the district level in this study were not age-standardized because the crude percentages are relevant for local decision-making. All districts with less than 50 observations were excluded (eFigure 3 in Supplement 1).
Figure 4.
Figure 4.. Distribution of Between-State and Within-State Variability in the Diabetes Care Continua for Selected States
All values are survey-weighted, crude (not age-standardized) percentages of the care continua represented as a violin plot for 12 states from 6 administrative zones. State-level rural and urban estimates of the diabetes care continua are plotted as a circle and triangle, respectively. The width of each violin represents relative density of points. An elongated violin suggests greater within-state (between-district) variability in the diabetes care continua. A, The proportion diagnosed is derived from the sample of those with diabetes. B, The proportion treated was derived from the sample of patients with diagnosed diabetes. C, The proportion with controlled diabetes was derived from the sample of patients with diagnosed diabetes.

References

    1. International Diabetes Federation . IDF diabetes atlas. Accessed October 6, 2022. https://diabetesatlas.org/ - PubMed
    1. IDF Working Group . Adler A, Bailey C, Ascher P. IDF clinical practice recommendations for managing type 2 diabetes in primary care. 2017. Accessed August 30, 2022. https://d-net.idf.org/en/library/466-managing-type-2-diabetes-in-primary...
    1. ElSayed NA, Aleppo G, Aroda VR, et al. ; on behalf of the American Diabetes Association . Improving care and promoting health in populations: standards of care in diabetes—2023. Diabetes Care. 2023;46(suppl 1):S10-S18. doi:10.2337/dc23-S001 - DOI - PMC - PubMed
    1. Stone MA, Charpentier G, Doggen K, et al. ; GUIDANCE Study Group . Quality of care of people with type 2 diabetes in eight European countries: findings from the Guideline Adherence to Enhance Care (GUIDANCE) study. Diabetes Care. 2013;36(9):2628-2638. doi:10.2337/dc12-1759 - DOI - PMC - PubMed
    1. Siegel KR, Ali MK, Zhou X, et al. . Cost-effectiveness of interventions to manage diabetes: has the evidence changed since 2008? Diabetes Care. 2020;43(7):1557-1592. doi:10.2337/dci20-0017 - DOI - PubMed