. 2023 Jul 31;18(7):e0289216.
doi: 10.1371/journal.pone.0289216. eCollection 2023.

Temporal integration of infrasound at threshold

Affiliations

Temporal integration of infrasound at threshold

Björn Friedrich et al. PLoS One. .

Abstract

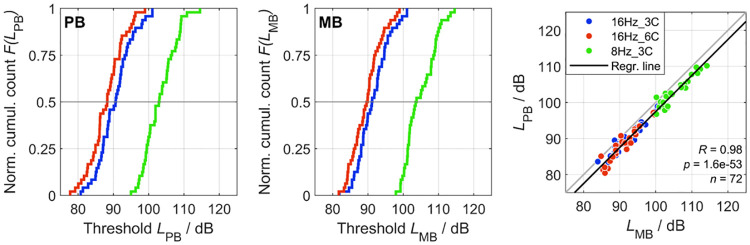
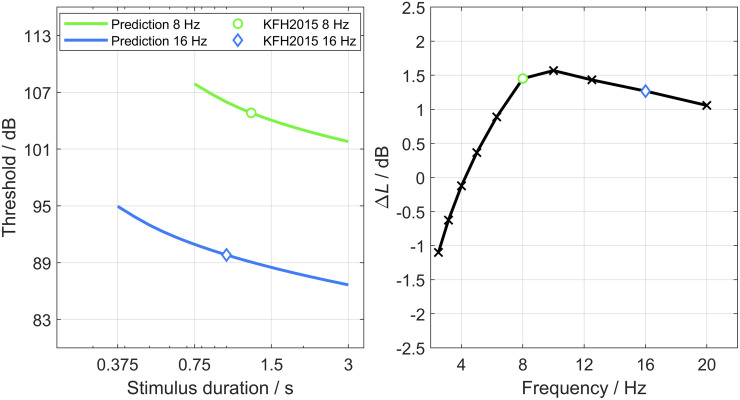
Infrasounds are signals with frequencies below the classical audio-frequency range, i.e., below 20 Hz. Several previous studies have shown that infrasound is audible as well, provided that the sound level is high enough. Hence, the sound pressure levels at threshold are much higher than those in the classical audio-frequency range. The present study investigates how the duration and the shape of the temporal envelope affect thresholds of infrasound stimuli in quiet. Two envelope types were considered: one where the duration of the steady state was varied (plateau bursts) and one where the number of consecutive onset-offset bursts was varied (multiple bursts). Stimuli were presented monaurally to human listeners by means of a low-distortion sound reproduction system. For both envelope types, thresholds decrease with increasing duration, a phenomenon often referred to as temporal integration. At the same duration, thresholds for plateau-burst stimuli are typically lower than those for multiple-burst stimuli. The data are well described by a slightly modified version of a model that was previously developed to account for temporal integration in the classical audio-frequency range. The results suggest similar mechanisms underlying the detection of stimuli with frequencies in the infrasound and in the classical audio-frequency range. Since the model accounts for the effect of duration and, more generally, the shape of the envelope, it can be used to enhance the comparability of existing and future datasets of thresholds for infrasounds with different temporal stimulus parameters.


Conflict of interest statement

The authors have declared that no competing interests exist.

Figures

Fig 1
Fig 1. Examples of stimuli used in the experiment.
Colored solid lines show time signals and envelopes of four stimuli with a carrier frequency of 16 Hz and a stimulus duration of 1500 ms. Alternating white–gray patterns indicate the segmentation of the stimuli.
Fig 2
Fig 2. Individual thresholds of MB and PB stimuli.
The left and the middle panel show the cumulative distribution functions of individual thresholds of MB and PB stimuli, respectively. The colors blue, red, and green identify different conditions. The right panel shows the Deming regression on pairs of thresholds of MB and PB stimuli with the same duration and of the same condition. The identical thresholds of MB1 and PB0 were excluded. The regression line (black) is located below the diagonal line (gray). The thresholds are strongly correlated. See text for details.
Fig 3
Fig 3. Thresholds as a function of stimulus duration.
Each column and each of the colors blue, red, and green represents a different condition. Each row and each color shading (dark versus light) represents a different envelope type. Dots represent data of individual listeners. Solid lines represent grand means and shaded tubes represent ranges of the grand mean ± 0.73 times the standard deviation.
Fig 4
Fig 4. Fits of the model to the grand-mean thresholds of the MB and PB stimuli.
Each color identifies a different condition, and color shading identifies the envelope type. Dots represent measured grand-mean thresholds and solid lines the corresponding threshold–duration functions predicted by the model. See text for detail.
Fig 5
Fig 5. Comparison to literature data for 8 Hz (left) and 16 Hz (right) data.
MP2004: Indicated as a black dotted line are the thresholds of 8 Hz and 16 Hz stimuli of various attributes published in the review by Møller and Pedersen [21]. KFH2015: The colored unfilled circles indicate the thresholds of 3C-PB stimuli reported by Kühler, Fedtke, and Hensel [17]. JFVF2021 and FJFV2020: The colored filled stars and the colored crosses represent thresholds of 3C-PB stimuli reported by Joost, Friedrich, Verhey, and Fedtke [18, 19], respectively. JLPM2020: Dark purple filled diamonds represent thresholds of 1C-PB stimuli as a function of stimulus duration reported by Jurado, Larrea, Patel, and Marquardt [20]. Light green, light red, and light blue solid lines are the fitted threshold–duration functions of PB stimuli in the three experimental conditions reproduced from Fig 4. The light purple solid line is a predicted threshold–duration function for a 16Hz_1C condition. The dark purple solid line represents the fit to the data points of JLPM2020. See text for details.
Fig 6
Fig 6. Predictions of the threshold differences relative to stimulus specifications by Kühler, Fedtke, and Hensel (KFH2015) [17].
Left: Thresholds predicted for 8 Hz and 16 Hz PB stimuli with ramp durations as specified in [17] but with varying plateau durations. For the predictions, the model with the parameters of the best fits to our data was used (see Table 2). Right: Threshold differences, ΔL in dB, predicted for the PB stimuli specified in [17] for frequencies from 2.5 Hz to 20 Hz. Values are highlighted for 8 Hz (green circle) and 16 Hz (blue diamond). See text for details.

Similar articles

References

    1. ISO 7196:1995: Acoustics–Frequency-weighting characteristic for infrasound measurements. International Organization for Standardization, Geneva. 1995. https://www.iso.org/obp/ui/es/#iso:std:iso:7196:ed-1:v1:en.
    1. Leventhall G. What is infrasound? Prog Biophys Mol Biol. 2007;93: 130–137. doi: 10.1016/j.pbiomolbio.2006.07.006 - DOI - PubMed
    1. Down WL. Natural Infrasound of Five Seconds Period. Nature 1967;215: 1469–1470. doi: 10.1038/2151469a0 - DOI
    1. Farges T, Hupe P, Le Pichon A, Ceranna L, Listowski C, Diawara A. Infrasound Thunder Detections across 15 Years over Ivory Coast: Localization, Propagation, and Link with the Stratospheric Semi-Annual Oscillation. Atmosphere 2021;12: 1188. doi: 10.3390/atmos12091188 - DOI
    1. Pilger C, Hupe P, Gaebler P, Ceranna L. 1001 Rocket Launches for Space Missions and Their Infrasonic Signature. Geophys Res Lett. 2021;48: e2020GL092262. doi: 10.1029/2020GL092262 - DOI

Publication types