. 2023 Aug 8;120(32):e2307451120.
doi: 10.1073/pnas.2307451120. Epub 2023 Jul 31.

Using single-cell RNA sequencing to generate predictive cell-type-specific split-GAL4 reagents throughout development

Affiliations

Using single-cell RNA sequencing to generate predictive cell-type-specific split-GAL4 reagents throughout development

Yu-Chieh David Chen et al. Proc Natl Acad Sci U S A. .

Abstract

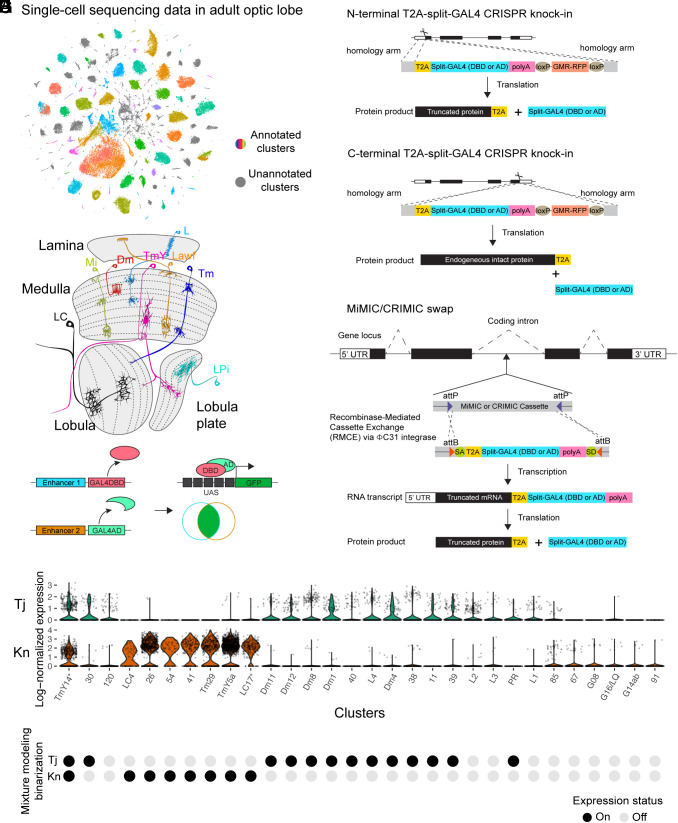
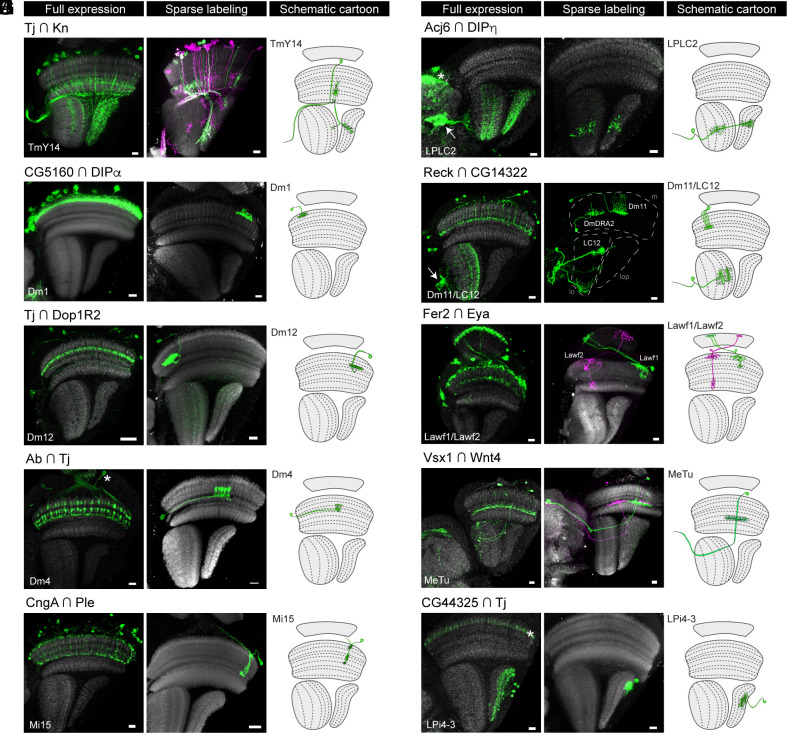
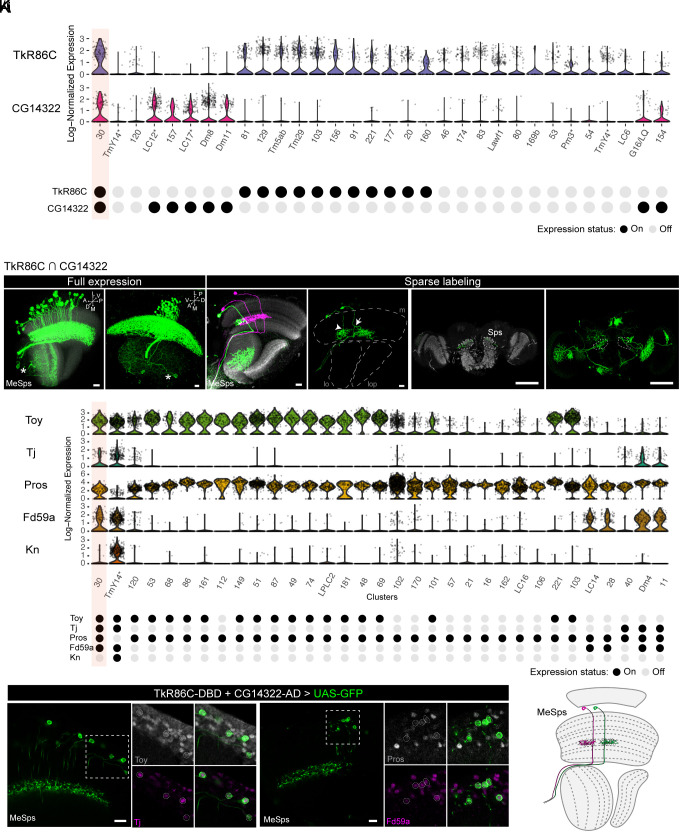
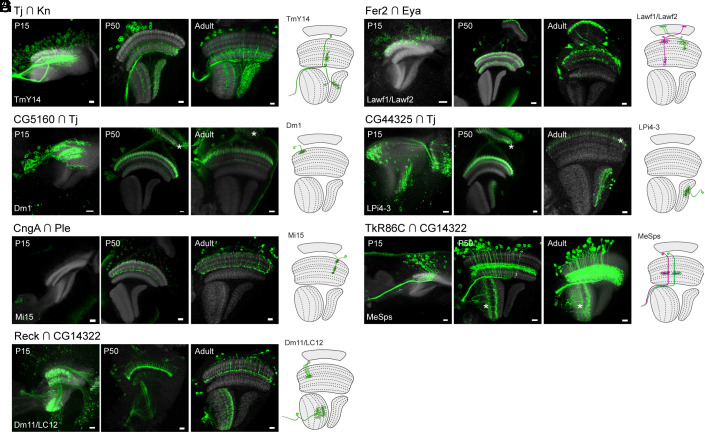
Cell-type-specific tools facilitate the identification and functional characterization of the distinct cell types that form the complexity of neuronal circuits. A large collection of existing genetic tools in Drosophila relies on enhancer activity to label different subsets of cells and has been extremely useful in analyzing functional circuits in adults. However, these enhancer-based GAL4 lines often do not reflect the expression of nearby gene(s) as they only represent a small portion of the full gene regulatory elements. While genetic intersectional techniques such as the split-GAL4 system further improve cell-type-specificity, it requires significant time and resources to screen through combinations of enhancer expression patterns. Here, we use existing developmental single-cell RNA sequencing (scRNAseq) datasets to select gene pairs for split-GAL4 and provide a highly efficient and predictive pipeline (scMarco) to generate cell-type-specific split-GAL4 lines at any time during development, based on the native gene regulatory elements. These gene-specific split-GAL4 lines can be generated from a large collection of coding intronic MiMIC/CRIMIC lines or by CRISPR knock-in. We use the developing Drosophila visual system as a model to demonstrate the high predictive power of scRNAseq-guided gene-specific split-GAL4 lines in targeting known cell types, annotating clusters in scRNAseq datasets as well as in identifying novel cell types. Lastly, the gene-specific split-GAL4 lines are broadly applicable to any other Drosophila tissue. Our work opens new avenues for generating cell-type-specific tools for the targeted manipulation of distinct cell types throughout development and represents a valuable resource for the Drosophila community.

Keywords: Drosophila visual system; MiMIC/CRIMIC; Single-cell RNA sequencing; Split-GAL4.


Conflict of interest statement

The authors declare no competing interest.

Figures

Fig. 1.
Fig. 1.
(A) t-SNE plot of the scRNAseq dataset of the adult Drosophila optic lobe. Clusters in gray represent unannotated clusters. Clusters with other colors were annotated in a previous study (15). (B) Schematic diagram of the Drosophila visual system with representative cell types of several major classes. There are four main neuropils in the optic lobe: lamina, medulla, lobula, and lobula plate. Distal medulla (Dm), lamina (L), lamina wide-field (Lawf), lobula columnar (LC), lobula plate intrinsic (LPi), medullar intrinsic (Mi), transmedullary (Tm), transmedullary Y (TmY). (C) Schematic diagram of the split-GAL4 system. GAL4 can be split into GAL4 DNA-binding domain (GAL4DBD) and activation domain (AD). Labeling specificity is further restricted when GAL4DBD and AD are under the control of two different enhancers and only the cells with both enhancers active have a functional reconstituted GAL4 for driving reporter gene expression. (DF) Schematic diagram of the gene-specific split-GAL4 generation. Gene-specific split-GAL4 lines can be generated either through N- (D) or C-terminal T2A-split-GAL4 knock-in (E), or through RMCE of T2A-split-GAL4 elements from the large existing collection of MiMIC/CRIMIC lines (F). The expression of a split-GAL4 reporter depends on the native gene regulatory network and is expected to recapitulate the endogenous transcript expression detected in the scRNAseq dataset. (G) Log-normalized expression of Tj (Top) and Kn (Bottom) for different clusters. Top 30 clusters expressing Tj or Kn are shown. (H) Binarization of gene expression by mixture modeling (15, 22). A probability (ON) score ranging from 0 to 1 is assigned to each cluster: 0 indicates no expression while 1 indicates strong expression. We set the probability score of 0.5 as an expression threshold and classified every gene in every cluster as either ON or OFF. Note that it is practically challenging to define whether a given gene is expressed in each cluster. For example, Tj showed similar expression level between cluster 39 and L2, yet, cluster 39 but not L2 is predicted to express Tj based on mixture modeling binarization.
Fig. 2.
Fig. 2.
Characterization of selected gene-specific split-GAL4 lines targeting different cell types/clusters. Targeted cell types predicted by scRNAseq expression are shown in the lower left corner for each split-GAL4 line. The expression pattern of each split-GAL4 line is shown either with UAS-myr-GFP reporter for full expression (Left) or with UAS-MCFO lines for sparse labeling (Middle). A schematic diagram of each cell type is shown on the right. (AF) Examples of split-GAL4 lines targeting single cell types. (G and H) Example of split-GAL4 lines targeting two cell types. (I and J) Examples of split-GAL4 lines targeting unannotated cell types in the scRNAseq dataset. Anti-NCad staining (gray) is used for visualizing neuropils. Images are substack projections of full expression labeling or segmented single cells from sparse labeling to show distinct morphological features of distinct cell types. Asterisks indicate expression in the cell types not predicted by mixture modeling. (Scale bar: 10 μm.)
Fig. 3.
Fig. 3.
(A) Log-normalized expression of TkR86C and CG14322 for different clusters (Top). Mixture modeling binarization of expression status for both genes is shown at the Bottom. Note that cluster 30 is predicted to be the only cluster intersected by TkR86C and CG14322. Top 30 clusters expressing TkR86C or CG14322 are shown. (B and C) The full expression pattern of TkR86C CG14322 line is shown with UAS-myr-GFP reporter. Note that there is an additional cell type in the lobula with only 2 to 3 cells labeled (marked by asterisks). The cell bodies of MeSps neurons are restricted to the medulla cortex. (D and E) Sparse labeling of MeSps neurons using MCFO. The bifurcation of neurites at M7 layer can be bidirectional (arrowhead to the anterior projection; arrow to the posterior projection). m: medulla; lo: lobula; lop: lobula plate. (Scale bar: 10 μm.) (F and G) Sparse labeling of MeSps neurons using MCFO show their projection to the superior posterior slope (Sps). Single optical section (F) of substack maximum projections (G) are shown. (Scale bar: 100 μm.) Anti-NCad staining (gray) is used for visualizing neuropils. (H) Log-normalized expression of selected transcription factors (Toy, Tj, Pros, Fd59a, and Kn) (Top). Mixture modeling binarization of expression status for selected genes are shown at the bottom. Note that cluster 30 is predicted to be the only cluster positive for Toy, Tj, Pros, and Fd59a. Kn is used to serve as a negative marker for cluster 30. Top 30 clusters expressing Toy, Tj, Pros, Fd59a, and Kn are shown. (IJ) Costaining of MeSps neurons labeled by TkR86C CG14322 with anti-Toy (Gray) and anti-Tj (Magenta) in I (region highlighted in the dotted white square was shown in I′–I″″) and anti-Pros (Gray) and anti-Fd59a (Magenta) in J (region highlighted in the dotted white square was shown in J′–J″″). MeSps neurons expressing GFP reporter are outlined in dotted circles. (Scale bar: 10 μm.) (K) Schematic diagram of MeSps neurons, a unique type of medulla projection neurons.
Fig. 4.
Fig. 4.
(A-F) Developmental characterization of selected gene-specific split-GAL4 lines targeting different cell types/clusters. Targeted cell types predicted by scRNAseq expression are shown in the lower left corner for each split-GAL4 line. The full expression pattern of each split-GAL4 line is shown with UAS-myr-GFP reporter at P15, P50, and adult stages. A schematic diagram of targeted cell types in adults is shown on the right in each panel. Asterisks indicate expression in the cell types not predicted by mixture modeling. Although other cell types are observed, the targeted cell types are always observed at multiple developmental stages. Anti-NCad staining (gray) is used for visualizing neuropils. Images are substack projections of full expression labeling to show distinct morphological features of distinct cell types. (Scale bar: 10 μm.)
Fig. 5.
Fig. 5.
(AC) Illustration of strategies to identify gene pairs that mark a cluster of interest throughout development with different stringency. Dark violet boxes indicate the stages when a gene pair is predicted to be on in the cluster of interest while light violet boxes indicate when the gene pair is predicted to be transiently active in other clusters. (D) Number of clusters that are predicted to be identified with gene pairs suggested by each strategy when all genes detected in the atlas are considered. (E) Number of clusters that are predicted to be identified with gene pairs suggested by each strategy when only considering genes with coding intronic MiMIC or CRIMIC lines available for RMCE (3,637 genes).
Fig. 6.
Fig. 6.
(A) Schematic diagram showing T2A-split-GAL4 triple donor cassette. The cassette is modified from T2A-GAL4 triple donor (16) by replacing T2A-GAL4 with T2A-GAL4DBD or T2A-AD. Split-GAL4 donors with three different splicing phases (phase 0, 1, and 2) are flanked by attB sequences and lox sequence variants. Supplement of Cre recombinase and ΦC31 integrase will allow the integration of T2A-split-GAL4 into targeted MiMIC insertion. (B) Gene structure annotation of bru1 (encoded in a “+” orientation) from JBrowse using D. melanogaster (r6.49) ref. . Phase 1 coding intronic MiMIC insertion (MI00135) is highlighted by an arrowhead. (C) Summary table of in vivo swapping by triple T2A-split-GAL4 donor. The genetic crossing scheme is shown in SI Appendix, Fig. S6A.

Update of

Comment in

References

    1. Brand A. H., Perrimon N., Targeted gene expression as a means of altering cell fates and generating dominant phenotypes. Dev. Camb. Engl. 118, 401–415 (1993). - PubMed
    1. Lai S.-L., Lee T., Genetic mosaic with dual binary transcriptional systems in Drosophila. Nat. Neurosci. 9, 703–709 (2006). - PubMed
    1. Potter C. J., Tasic B., Russler E. V., Liang L., Luo L., The Q system: A repressible binary system for transgene expression, lineage tracing, and mosaic analysis. Cell 141, 536–548 (2010). - PMC - PubMed
    1. Jenett A., et al. , A GAL4-driver line resource for Drosophila neurobiology. Cell Rep. 2, 991–1001 (2012). - PMC - PubMed
    1. Kvon E. Z., et al. , Genome-scale functional characterization of Drosophila developmental enhancers in vivo. Nature 512, 91–95 (2014). - PubMed

Publication types

LinkOut - more resources