. 2023 Aug 8;120(32):e2309967120.
doi: 10.1073/pnas.2309967120. Epub 2023 Jul 31.

Activin E-ACVR1C cross talk controls energy storage via suppression of adipose lipolysis in mice

Affiliations

Activin E-ACVR1C cross talk controls energy storage via suppression of adipose lipolysis in mice

Rene C Adam et al. Proc Natl Acad Sci U S A. .

Abstract

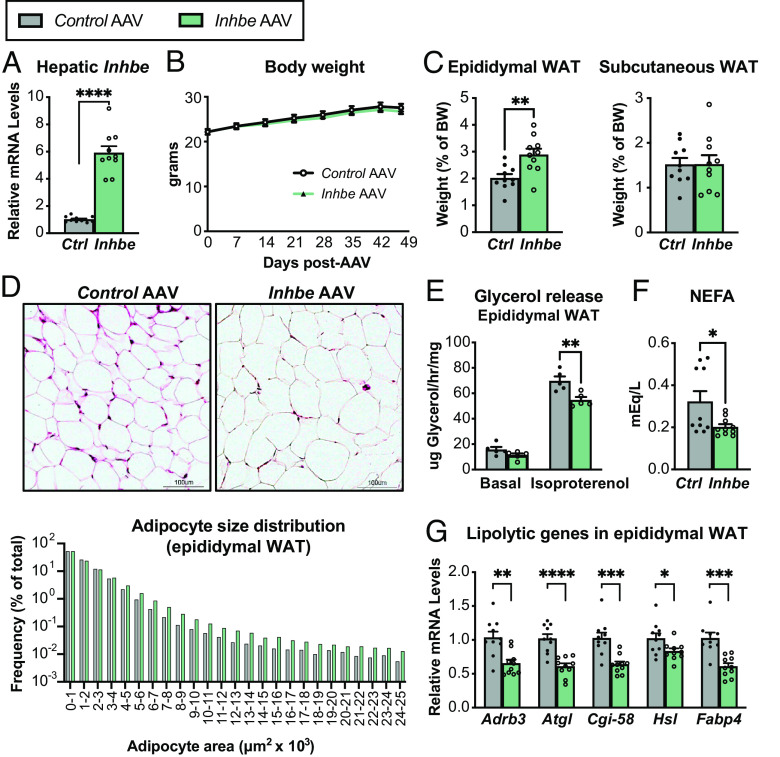
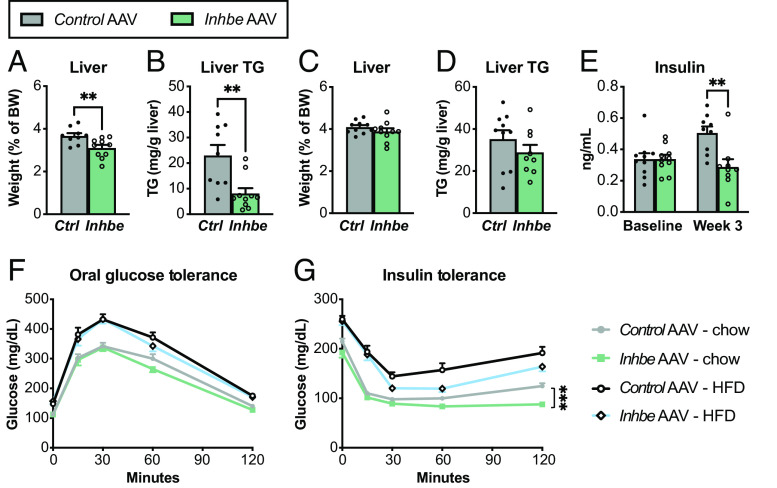
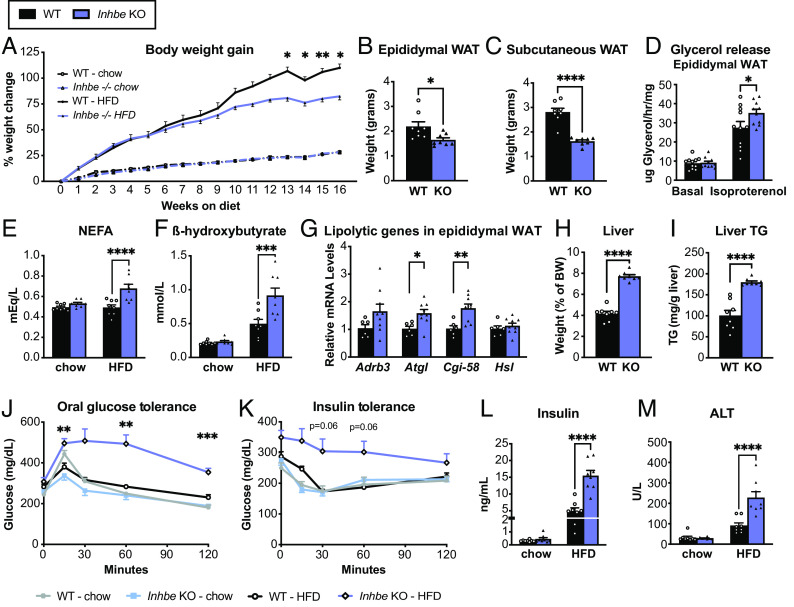
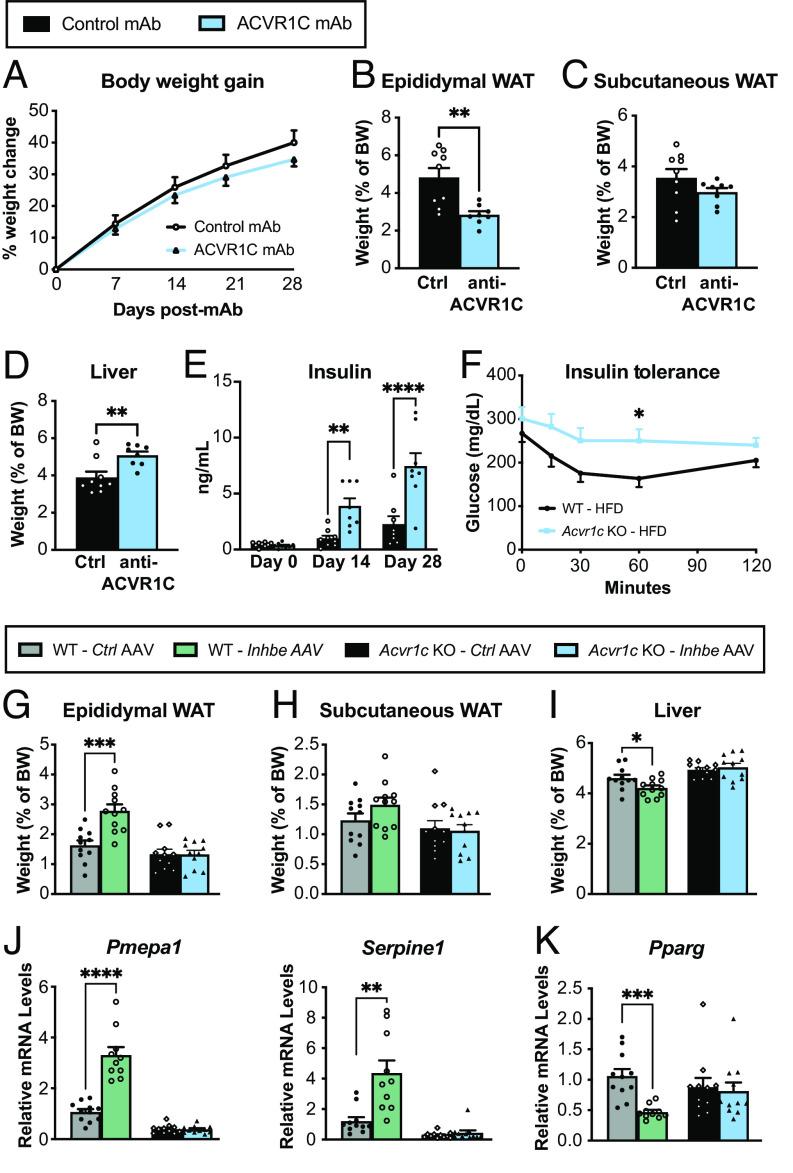
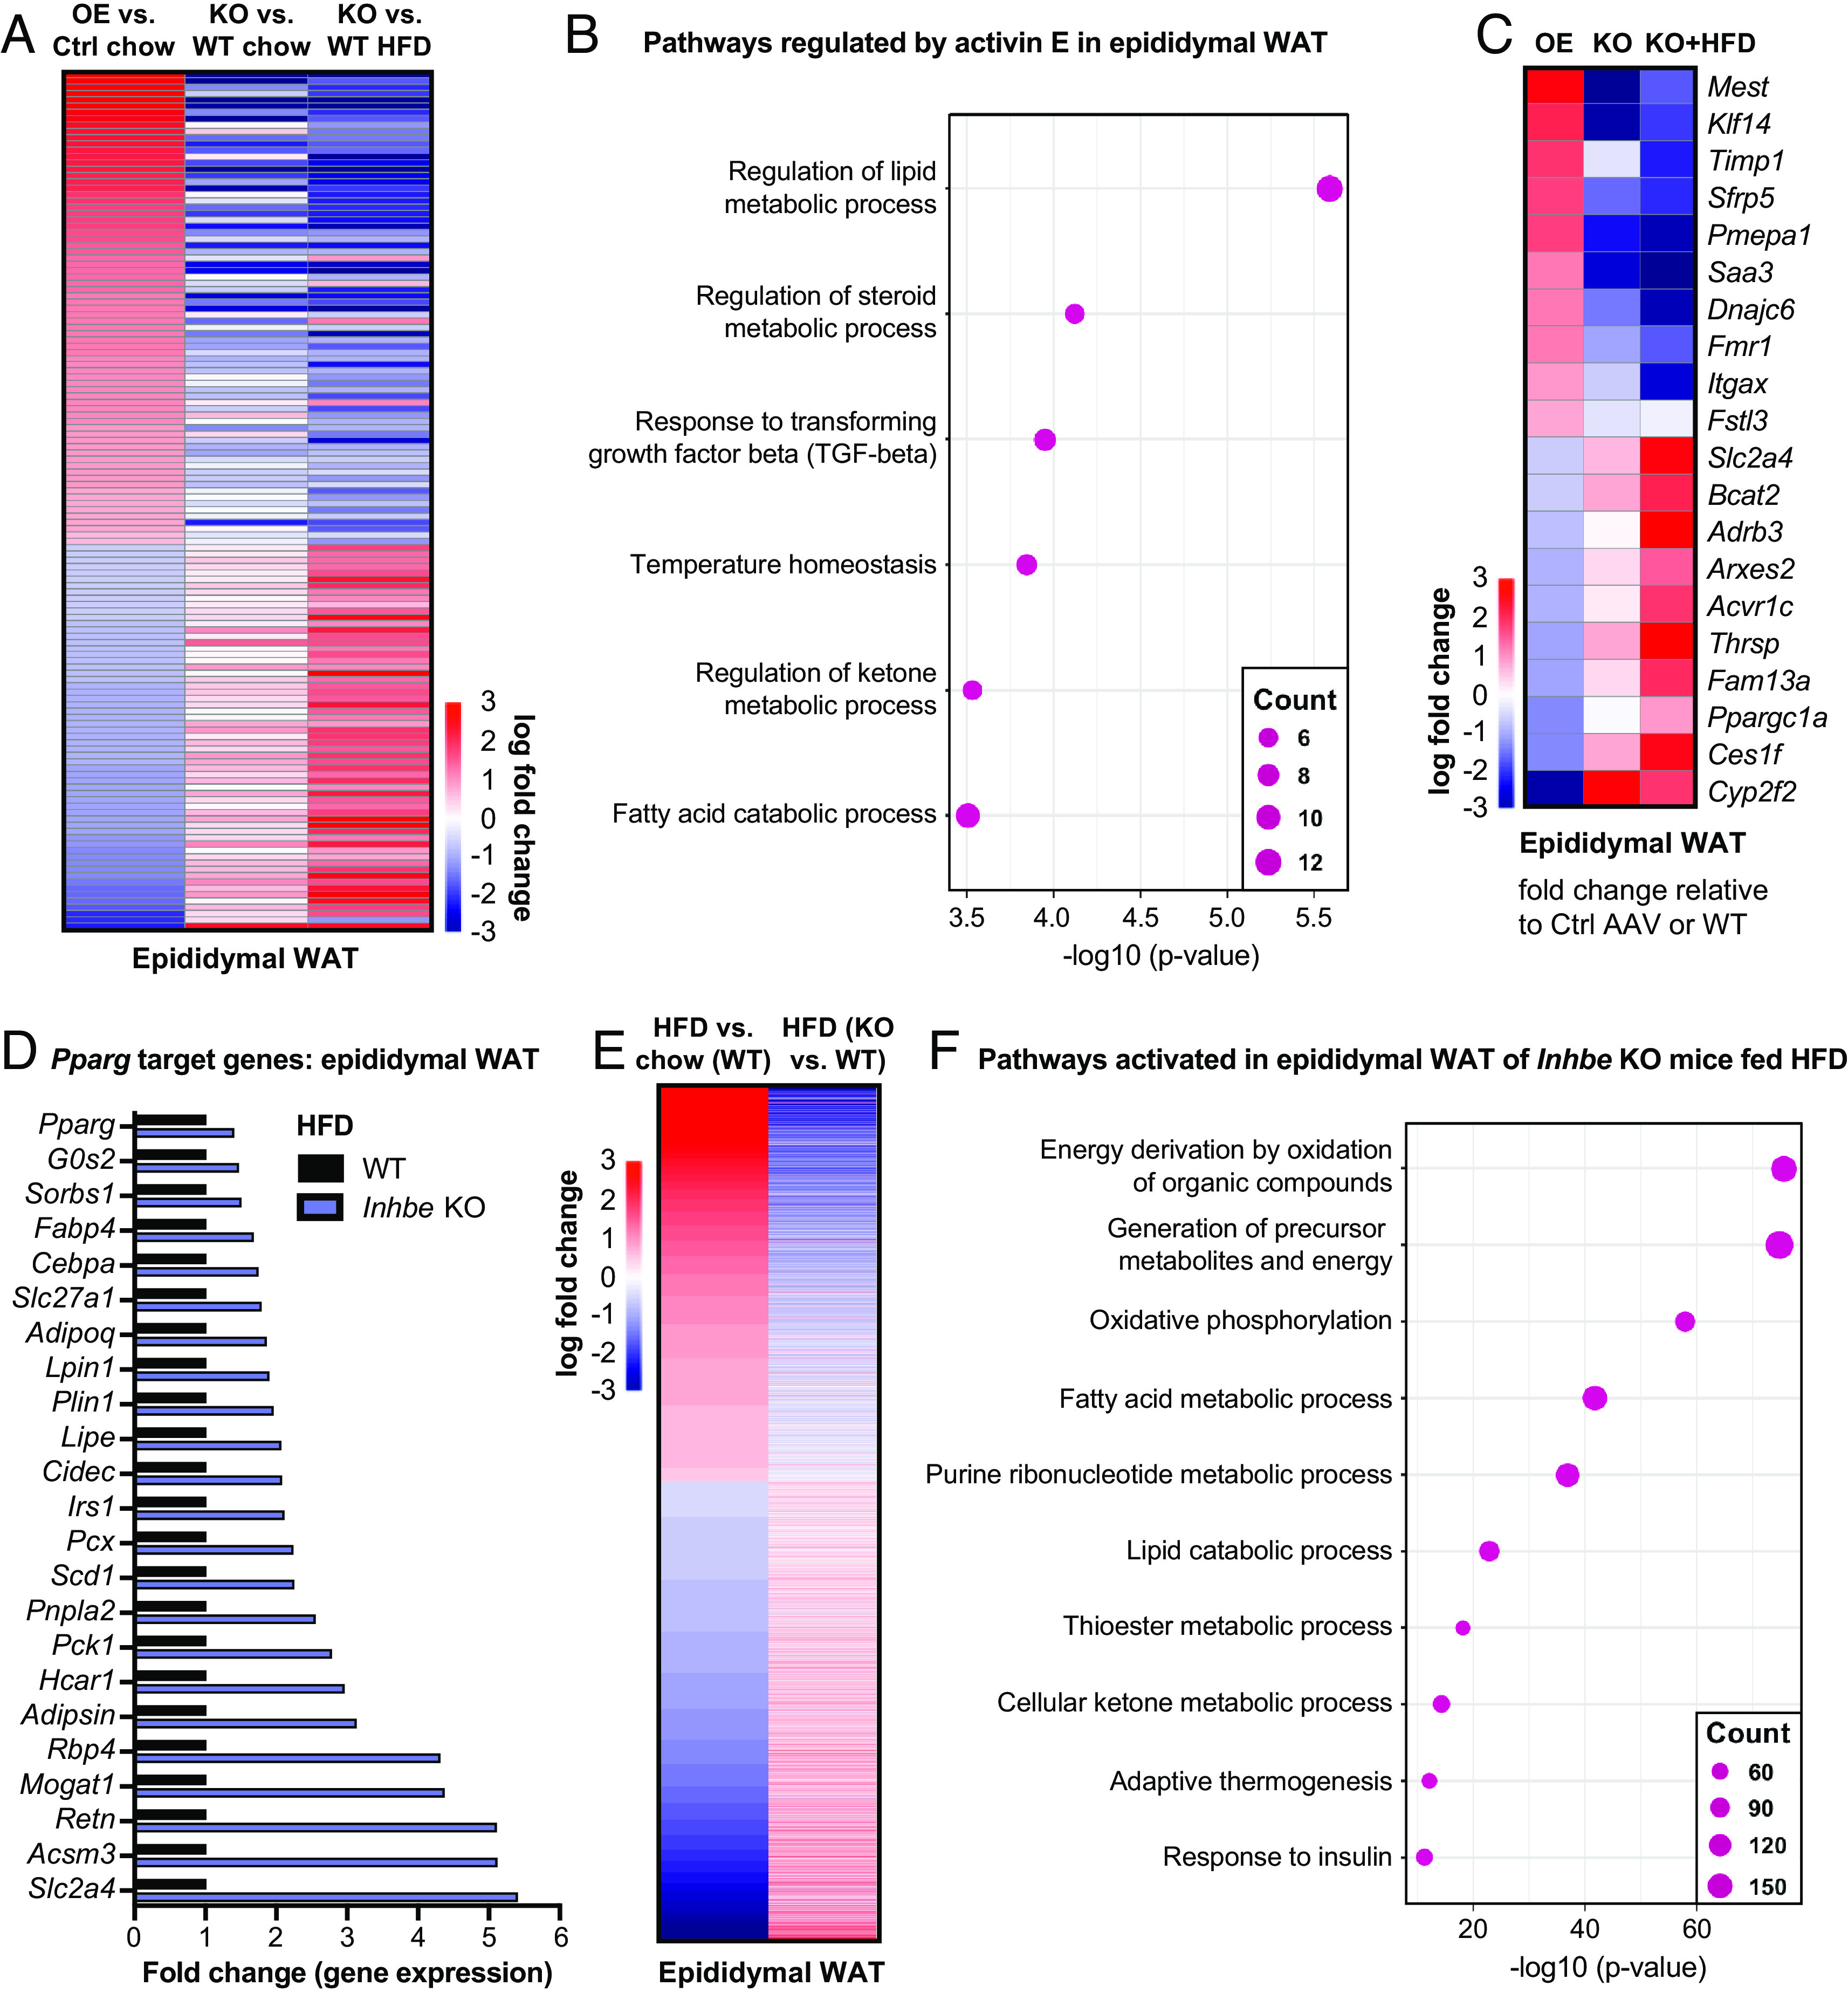
Body fat distribution is a heritable risk factor for cardiovascular and metabolic disease. In humans, rare Inhibin beta E (INHBE, activin E) loss-of-function variants are associated with a lower waist-to-hip ratio and protection from type 2 diabetes. Hepatic fatty acid sensing promotes INHBE expression during fasting and in obese individuals, yet it is unclear how the hepatokine activin E governs body shape and energy metabolism. Here, we uncover activin E as a regulator of adipose energy storage. By suppressing β-agonist-induced lipolysis, activin E promotes fat accumulation and adipocyte hypertrophy and contributes to adipose dysfunction in mice. Mechanistically, we demonstrate that activin E elicits its effect on adipose tissue through ACVR1C, activating SMAD2/3 signaling and suppressing PPARG target genes. Conversely, loss of activin E or ACVR1C in mice increases fat utilization, lowers adiposity, and drives PPARG-regulated gene signatures indicative of healthy adipose function. Our studies identify activin E-ACVR1C as a metabolic rheostat promoting liver-adipose cross talk to restrain excessive fat breakdown and preserve fat mass during prolonged fasting, a mechanism that is maladaptive in obese individuals.

Keywords: ACVR1C; INHBE (activin E); body fat distribution; diabetes; lipolysis.


Conflict of interest statement

R.C.A., D.S.P., J.S.L., Y.Z., I.J.M., S.M., G.H., J.M., G.S.A., S.A., V.I., A.N.E., L.A.L., A.J.M., G.D.Y., M.W.S., and V.G. are employees and shareholders at Regeneron Pharmaceuticals.

Figures

Fig. 1.
Fig. 1.
Activin E lowers fat mobilization and increases adiposity in mice. (A) Liver mRNA levels of Inhbe (n = 10). (B) Body weights in 7- to 14-wk-old male Control AAV and Inhbe AAV-treated WT mice (n = 10). (C) Weights of visceral (epididymal) and subcutaneous (inguinal) white adipose tissue (n = 10). (D) Adipocyte morphology and size distribution measured by imaging software in H&E-stained epididymal WAT sections (n = 534,046 cells for Control AAV and 525,314 cells for Inhbe AAV analyzed from 10 mice/group). (E) Ex vivo lipolysis with epididymal WAT explants from WT mice under basal and isoproterenol-stimulated conditions. Fat mobilization is determined enzymatically by glycerol measurements in supernatant (n = 5). (F) Plasma NEFA levels (n = 10). (G) Epididymal WAT mRNA levels of genes involved in adipose lipolysis, relative to Control AAV (n = 10). Mean ± SEM are shown in all graphs besides (D), where mean is shown. *P < 0.05, **P < 0.01, ***P < 0.001, ****P < 0.0001 relative to Control AAV.
Fig. 2.
Fig. 2.
Activin E regulates glycemic control and liver lipid content in mice. (A–D) Liver weights and lipid content. Fasted liver weight (A) and hepatic triglyceride content (B) in Control AAV or Inhbe AAV-treated mice on HFD (n = 9 to 10). Nonfasted liver weight (C) and hepatic triglyceride content (D) in Control AAV or Inhbe AAV-treated mice on HFD (n = 9 to 10). (E) Fasting plasma insulin levels before (baseline) and 3 wk after Inhbe AAV administration on chow (n = 9). (F and G) Glycemic control in Inhbe overexpressing mice. Oral glucose tolerance (F) and insulin tolerance tests (G) in mice administered with Control AAV or Inhbe AAV and fed chow or high-fat diets (n = 10). Mean ± SEM are shown in all graphs. **P < 0.01, ***P < 0.001.
Fig. 3.
Fig. 3.
Loss of activin E promotes fat mobilization. (A) Body weights in 7- to 24-wk-old male WT and Inhbe−/− mice on chow and high-fat diet (HFD) (n = 7 to 8). (B and C) Weights of epididymal (B) and subcutaneous (C) white adipose tissue of Inhbe−/− mice following 16 wk of HFD (n = 8). (D) Ex vivo lipolysis with epididymal WAT explants from WT and Inhbe−/− mice under basal and isoproterenol-stimulated conditions (n = 10 to 11). (E and F) Fasted plasma NEFA (E) and beta-hydroxybutyrate (F) levels before (chow) and after 10 or 16 wk of HFD (n = 8). (G) Epididymal WAT mRNA levels of genes involved in adipose lipolysis (n = 6 to 10). (H and I) Fasted liver weight (H) and hepatic triglyceride content (I) in WT and Inhbe−/− mice on HFD (n = 8). (J) Oral glucose tolerance and insulin tolerance tests (K) in WT and Inhbe−/− mice on chow and high-fat diets (n = 7 to 8). (L) Plasma insulin levels before (baseline chow) and 16 wk after HFD (n = 8). (M) Plasma ALT levels in Inhbe−/− mice on chow and HFD for 16 wk. Mean ± SEM are shown in all graphs. *P < 0.05, **P < 0.01, ***P < 0.001, ****P < 0.0001.
Fig. 4.
Fig. 4.
Activin E signals via ACVR1C to suppress PPARG in adipose tissue. (A) Body weight increase in 7- to 11-wk-old male WT mice treated with control monoclonal antibody (mAb) or neutralizing ACVR1C mAb while on HFD (n = 8 to 9). (B–D) Fasted weights of epididymal (B) and subcutaneous (C) white adipose tissue and liver (D) (n = 8 to 9). (E) Plasma insulin levels before (baseline) and 2 or 4 wk after Control mAb or ACVR1C neutralizing mAb administration to WT mice (n = 8 to 9). (F) Insulin tolerance test in WT and Acvr1c−/− mice on high-fat diet (n = 10). (G to I) Fasted weights of epididymal (G) and subcutaneous (H) white adipose tissue and liver (I) 6 wk following Control AAV or Inhbe AAV administration to WT or Acvr1c−/− mice on chow diet (n = 11). (J and K) Epididymal WAT mRNA levels of activin target genes Pmepa1 and Serpine1 (J), and adipose transcription factor Pparg (K), relative to Control AAV in WT and Acvr1c−/− mice (n = 10 to 11). Mean ± SEM are shown in all graphs. *P < 0.05, **P < 0.01, ***P < 0.001, ****P < 0.0001.
Fig. 5.
Fig. 5.
Activin E promotes a gene signature related to adipose dysfunction. (A) Heat map of epididymal adipose transcriptome signatures comparing Inhbe overexpression, Inhbe KO on chow and high-fat diet (HFD) vs. control-treated or WT mice, respectively. (B) Dot plots showing top biological pathways for oppositely regulated genes (Inhbe overexpression vs. KO) in epididymal WAT. (C) Heatmap showing examples of oppositely regulated genes (Inhbe overexpression vs. KO) in epididymal WAT. (D) Relative gene expression levels of PPARG target genes in epididymal WAT, comparing Inhbe KO and WT mice on high-fat diet. (E) Heatmap of epididymal adipose transcriptome signatures comparing WT chow vs. HFD, and Inhbe KO vs. WT on high-fat diet (HFD), demonstrating that Inhbe LOF reverses many of the HFD effects seen in WT mice. (F) Dot plots showing top biological pathways for genes increased in epididymal WAT of Inhbe KO vs. WT on HFD.

References

    1. Bluher M., Obesity: Global epidemiology and pathogenesis. Nat. Rev. Endocrinol. 15, 288–298 (2019). - PubMed
    1. Klein S., Gastaldelli A., Yki-Jarvinen H., Scherer P. E., Why does obesity cause diabetes? Cell Metab. 34, 11–20 (2022). - PMC - PubMed
    1. Czech M. P., Insulin action and resistance in obesity and type 2 diabetes. Nat. Med. 23, 804–814 (2017). - PMC - PubMed
    1. Emdin C. A., et al. , Genetic association of waist-to-hip ratio with cardiometabolic traits, type 2 diabetes, and coronary heart disease. JAMA 317, 626–634 (2017). - PMC - PubMed
    1. Dale C. E., et al. , Causal associations of adiposity and body fat distribution with coronary heart disease, stroke subtypes, and type 2 diabetes mellitus: A mendelian randomization analysis. Circulation 135, 2373–2388 (2017). - PMC - PubMed