. 2023 Aug 8;120(32):e2216532120.
doi: 10.1073/pnas.2216532120. Epub 2023 Jul 31.

Noncanonical HPV carcinogenesis drives radiosensitization of head and neck tumors

Affiliations

Noncanonical HPV carcinogenesis drives radiosensitization of head and neck tumors

Travis P Schrank et al. Proc Natl Acad Sci U S A. .

Abstract

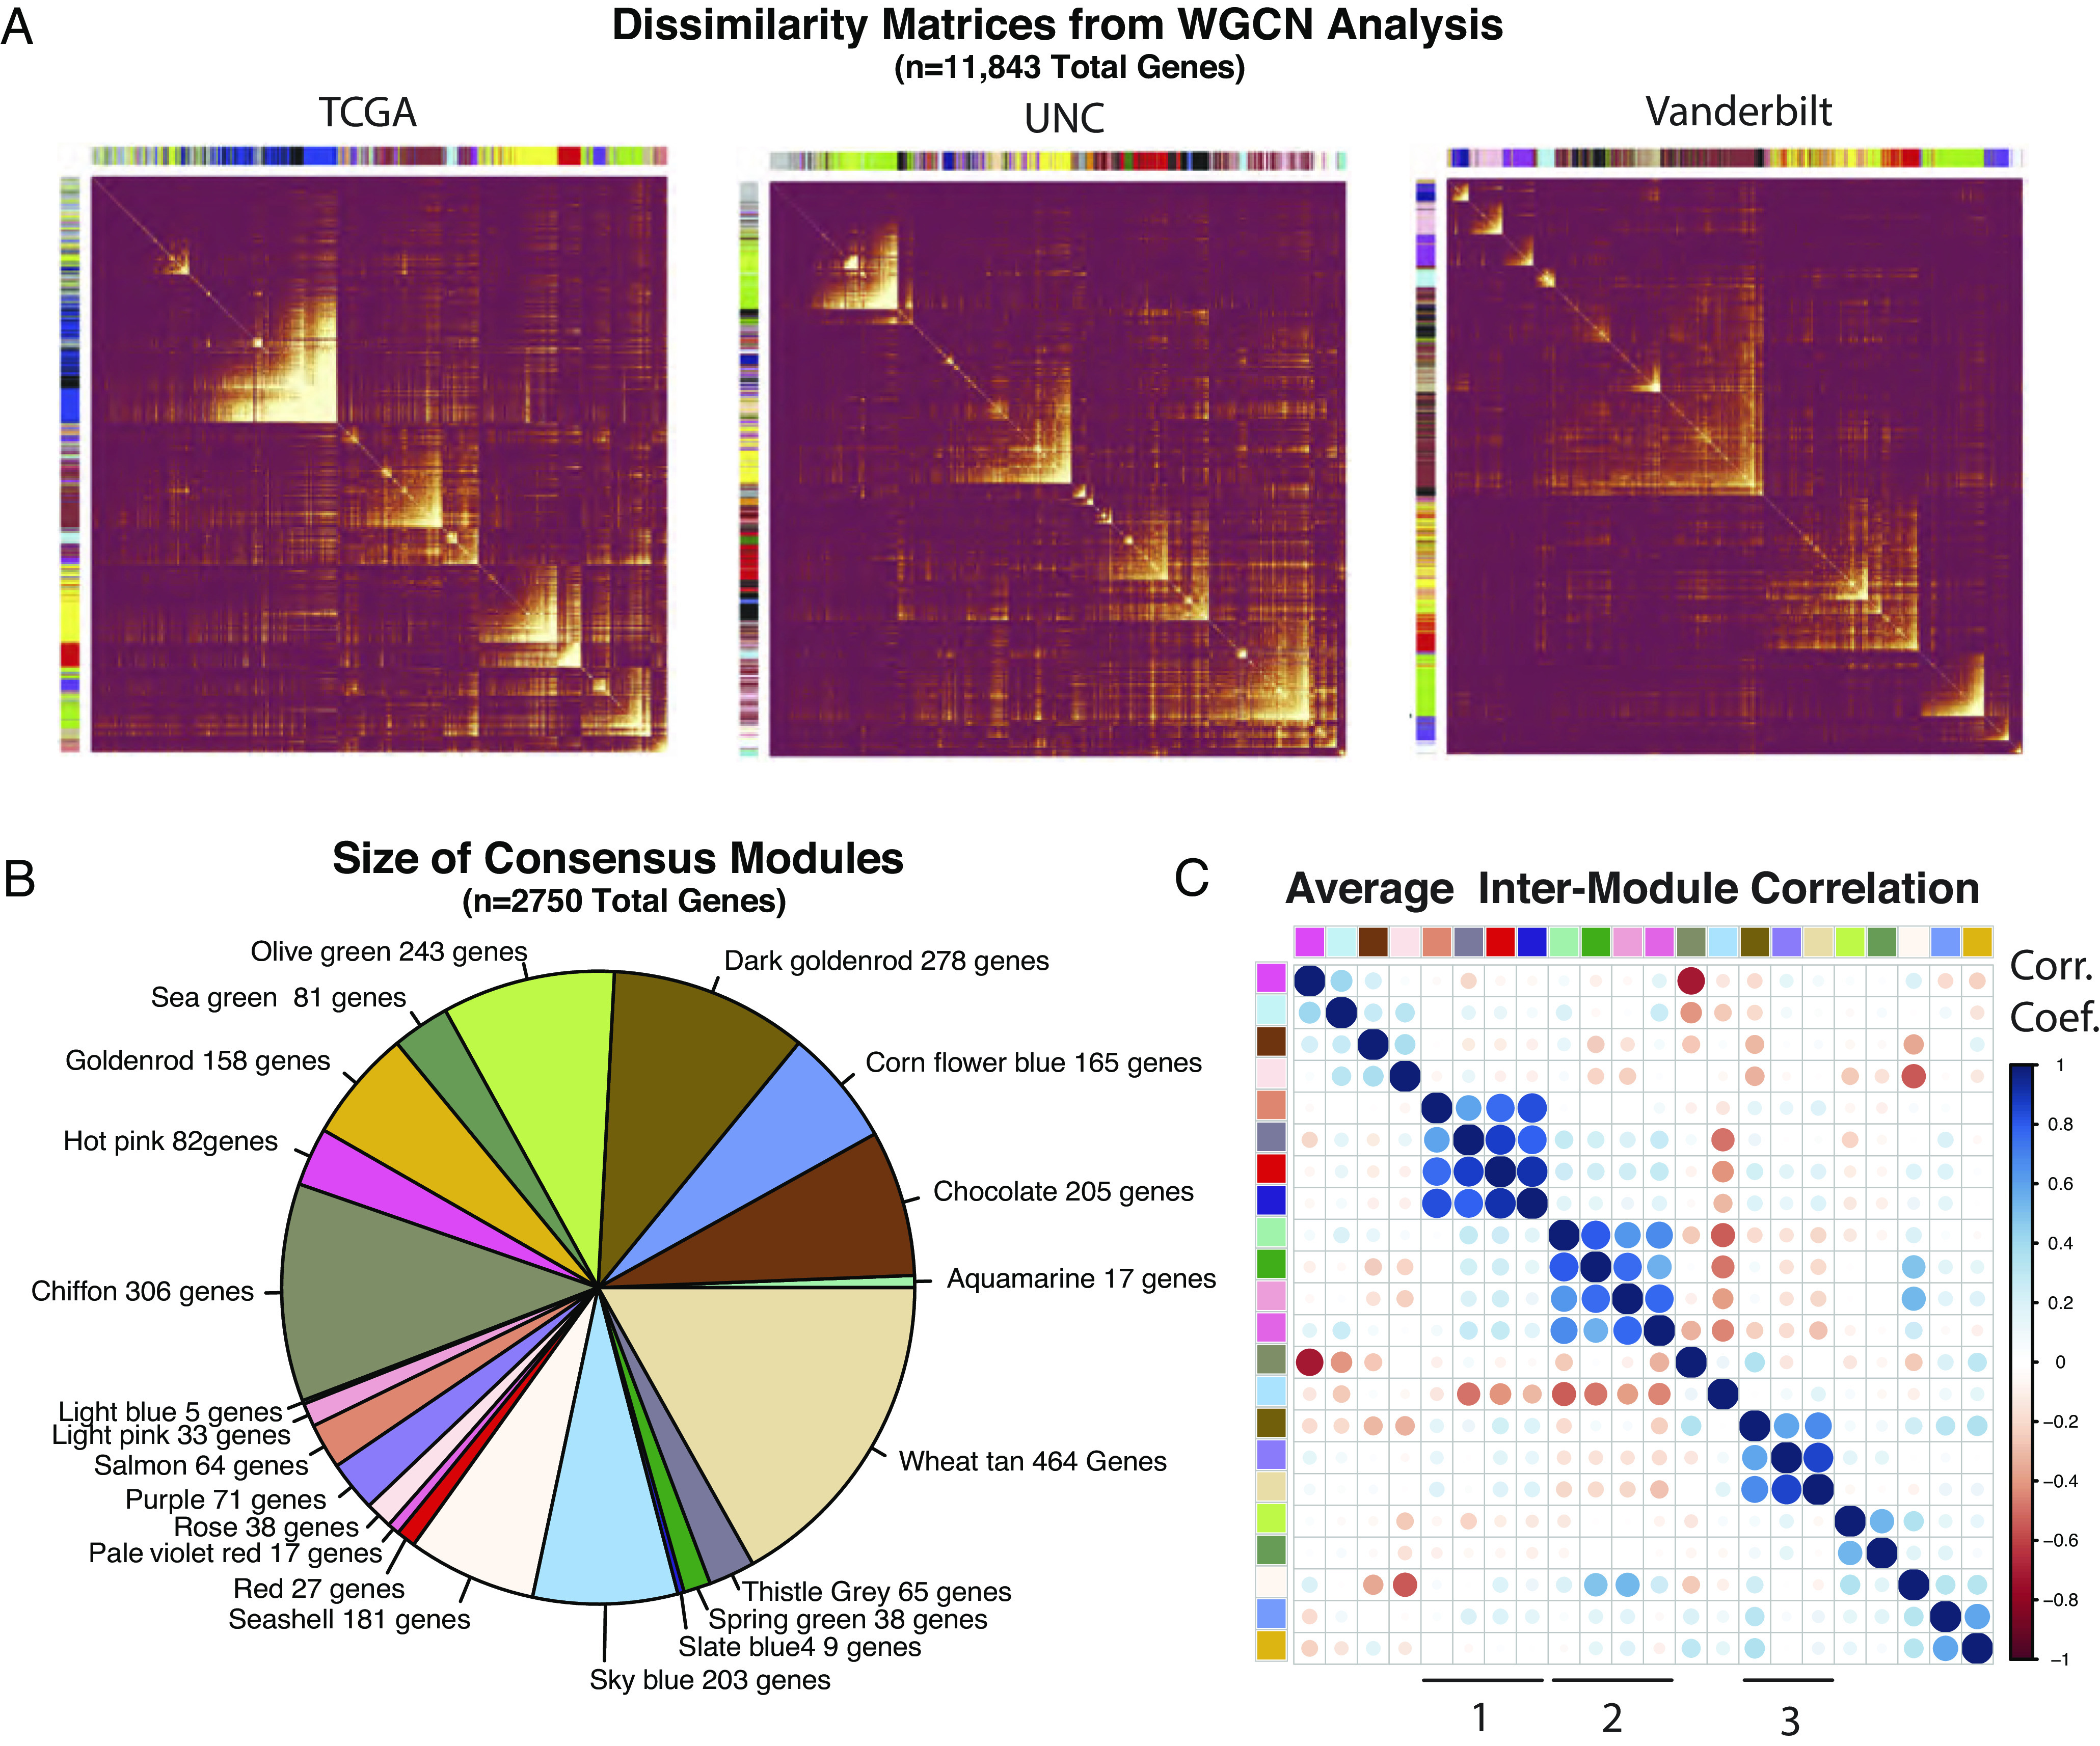
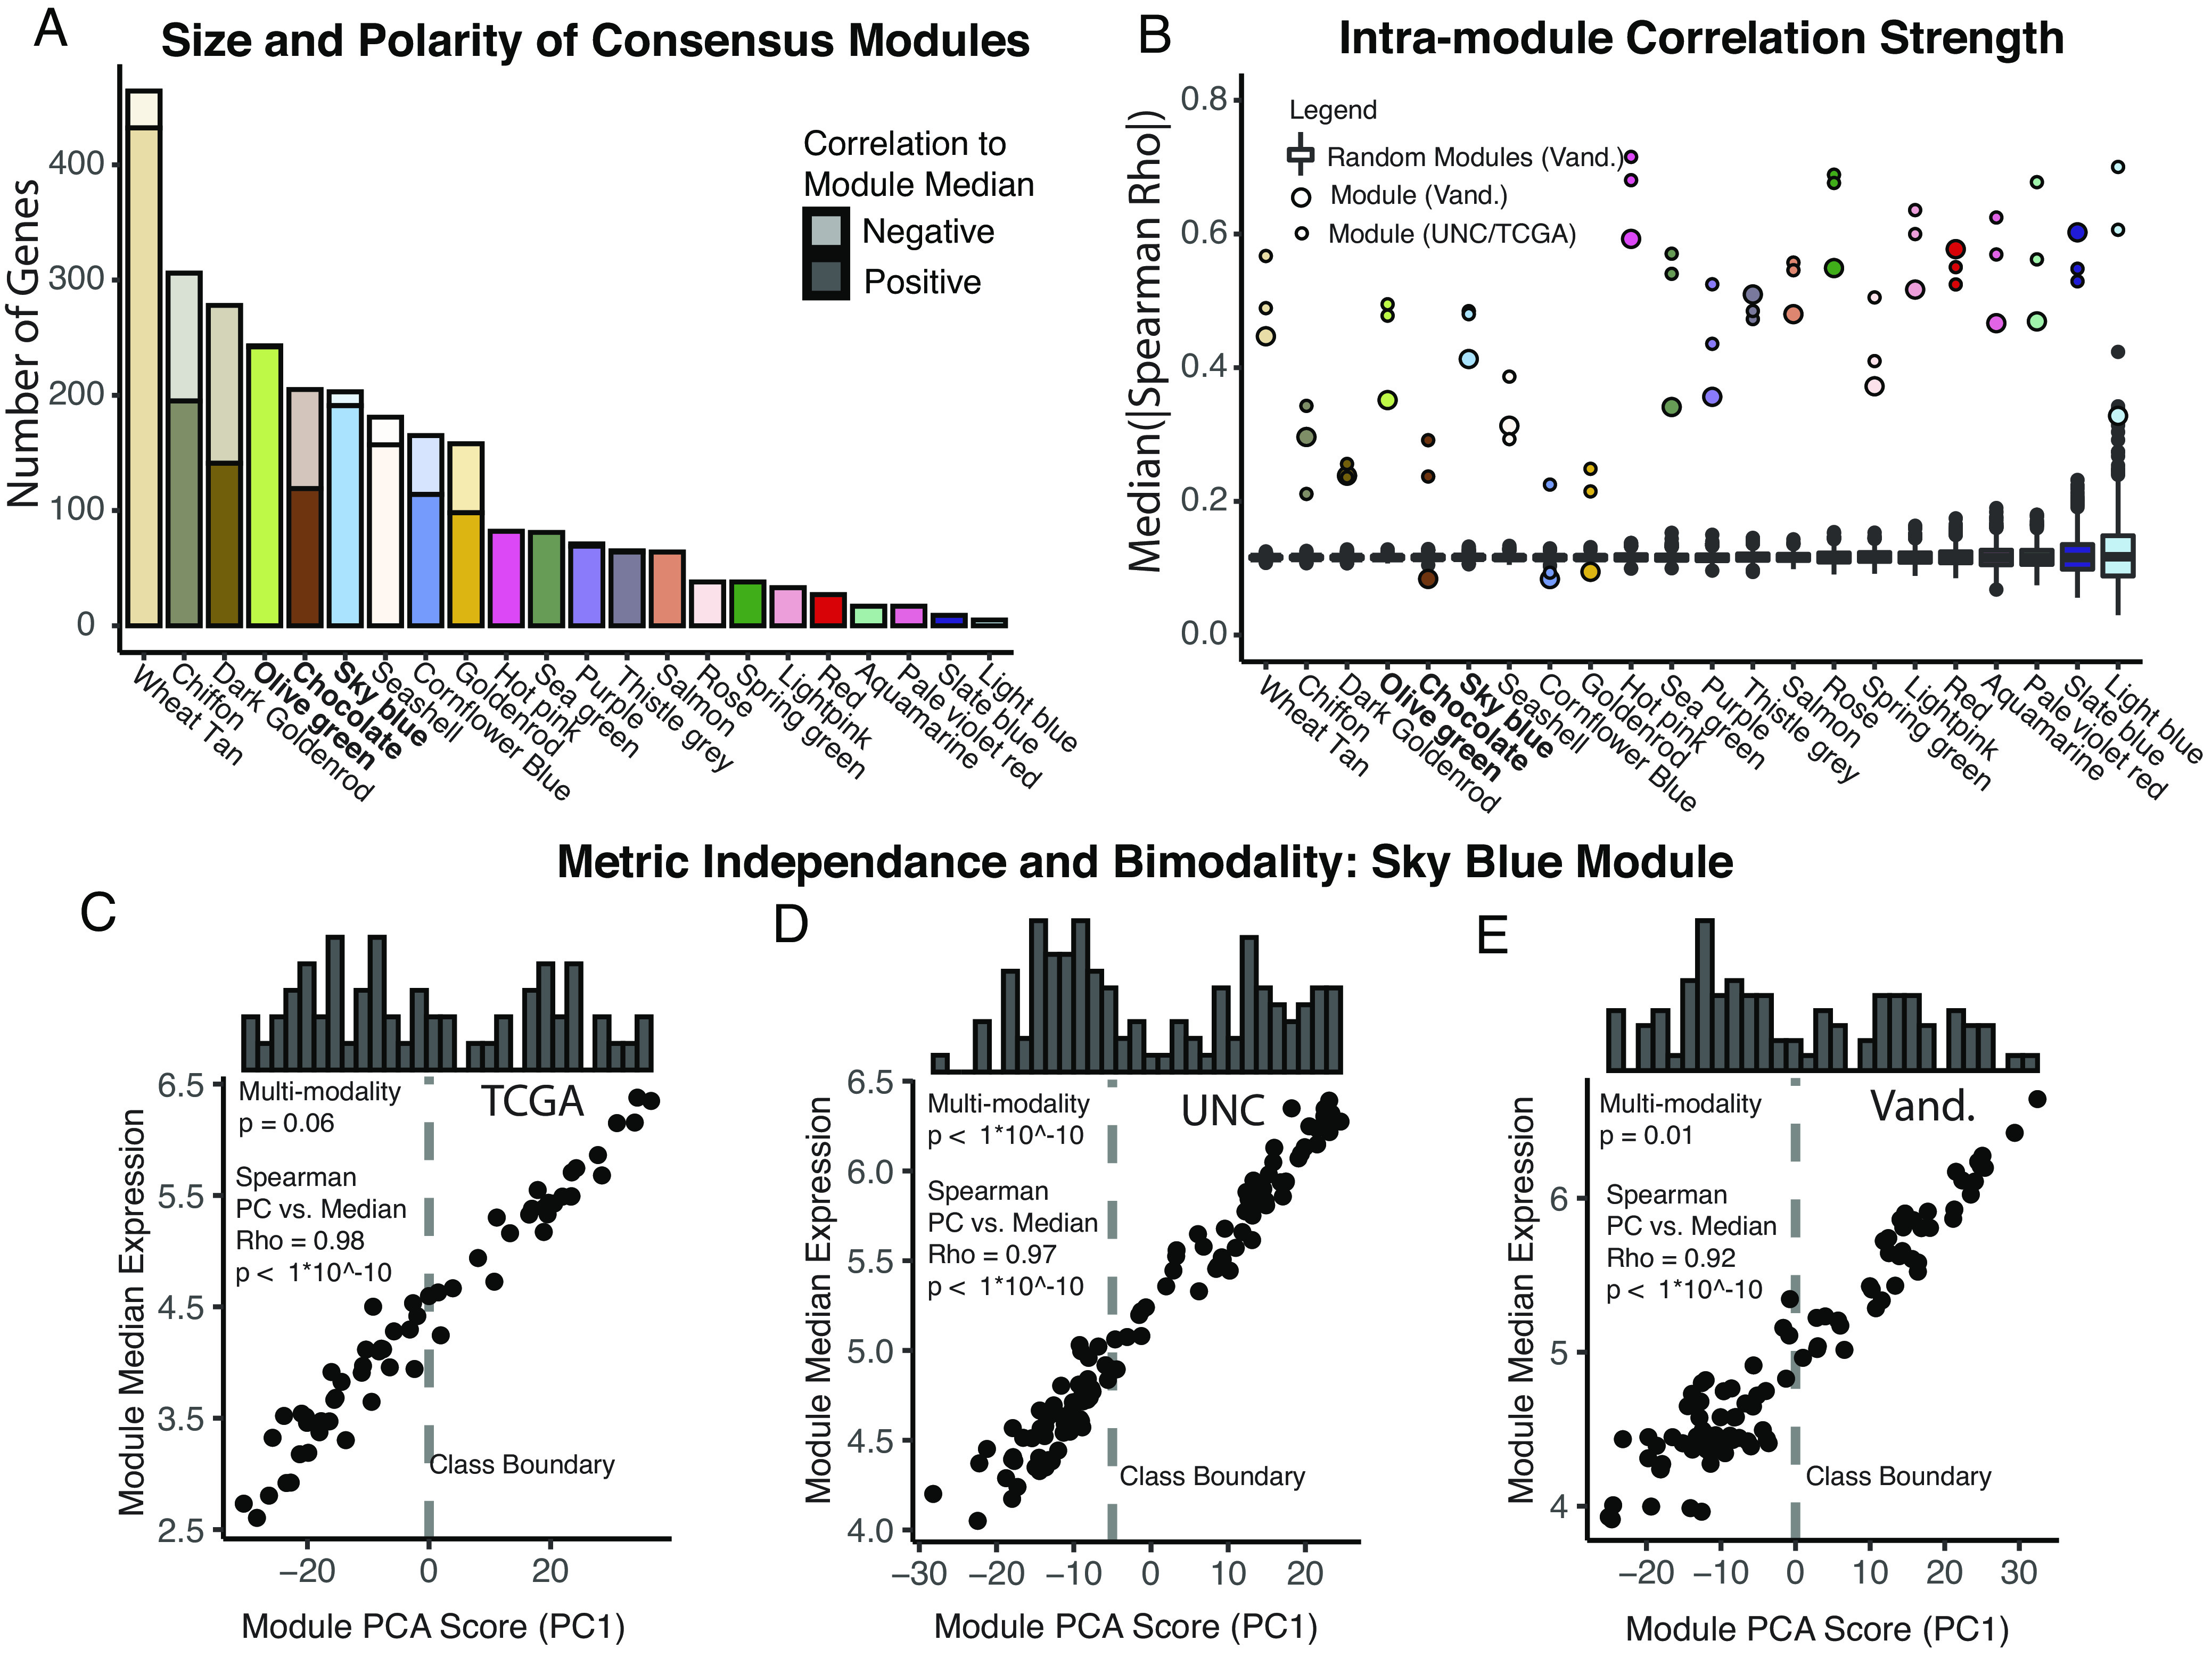
We analyzed transcriptional data from 104 HPV+ (Human papillomavirus) HNSCC (head and neck squamous cell carcinoma) tumors together with two publicly available sources to identify highly robust transcriptional programs (modules) which could be detected consistently despite heterogeneous sequencing and quantification methodologies. Among 22 modules identified, we found a single module that naturally subclassifies HPV+ HNSCC tumors based on a bimodal pattern of gene expression, clusters all atypical features of HPV+ HNSCC biology into a single subclass, and predicts patient outcome in four independent cohorts. The subclass-defining gene set was strongly correlated with Nuclear factor kappa B (NF-κB) target expression. Tumors with high expression of this NF-κB module were rarely associated with activating PIK3CA alterations or viral integration, and also expressed higher levels of HPHPV E2 and had decreased APOBEC mutagenesis. Alternatively, they harbored inactivating alterations of key regulators of NF-κB, TNF receptor associated factor 3 (TRAF3), and cylindromatosis (CYLD), as well as retinoblastoma protein (RB1). HPV+ HNSCC cells in culture with experimental depletion of TRAF3 or CYLD displayed increased expression of the subclass-defining genes, as well as robust radio-sensitization, thus recapitulating both the tumor transcriptional state and improved treatment response observed in patient data. Across all gene sets investigated, methylation to expression correlations were the strongest for the subclass-defining, NF-κB-related genes. Increased tumor-infiltrating CD4+ T cells and increased Estrogen receptors alpha (ERα) expression were identified in NF-κB active tumors. Based on the relatively high rates of cure in HPV+ HNSCC, deintensification of therapy to reduce treatment-related morbidity is being studied at many institutions. Tumor subclassification based on oncogenic subtypes may help guide the selection of therapeutic intensity or modality for patients with HPV+ HNSCC.

Keywords: HPV; head and neck cancer; patient outcome; radiosensitization; tumor microenvironment.


Conflict of interest statement

T.P.S., W.G.Y., and N.I., hold intellectual property related to the presented work. UNC 21-0070 reporting filing of PCT application No. PCT/US22/32871; OLG Ref. 150-34-PCT.

Figures

Fig. 1.
Fig. 1.
WGCNA of multiple cohorts reveals consensus transcriptional modules in HPV+ HNSCC. (A) Clustered dissimilarity matrices used for module selection in the WGCNA procedure. Columns/rows—sampled genes (n = 1,000) with module assignment. (B) Relative size of consensus modules. (C) Average intermodule correlation across all datasets. The mean Spearman's correlation coefficient is displayed. Color key as in panel B. Groups of modules with consistent intermodule correlation are indicated with numerals 1 to 3.
Fig. 2.
Fig. 2.
Module characteristics and quality metrics. (A) Bar plot of size and relative polarity of the consensus modules. Opaque—genes with expression positively correlated to the median expression of module genes. Transparent—genes with expression negatively correlated to the median expression of module genes. (B) Comparison of intramodule correlation of consensus modules to background. Box plot with black points—1,000 random gene sets of the size of the module in question were created. The median absolute value of Spearman's Rho is plotted for each resampling. The Vanderbilt cohort was used for this analysis, but resampling was also performed for TCGA and UNC which did not alter the results significantly. Colored points—median absolute value of Spearman's Rho for the consensus modules in all three datasets. (CE) Ideal module characteristics of the Sky Blue module. Scatter plot—comparison of principle component 1 values to the median expression of all module genes. Histogram—frequency of PC1 scores. Correlation statistics—Spearman. Multimodality testing—excess mass method. Dashed line—empiric class boundary used for subsequent analyses.
Fig. 3.
Fig. 3.
Hypergeometric enrichment analysis of HPV+ HNSCC consensus modules and correlation to tumor microenvironment. WGCNA modules were screened for enrichment in Hallmark gene sets from MiSigDB. Warmer colors represent lower adjusted P value (q value). Only results with q < 0.05 were displayed. The percent of module genes in the Hallmark gene set is represented by point size. Q values represent hypergeometric enrichment as reported by the EnrichR R package. (A) Enrichment analysis of individual consensus modules. (B) Heatmap of correlation coefficients. EcoTyper was applied to three datasets to estimate the proportion of cell types. The log2 (cell type intensity/epithelial intensity) was correlated to WGCNA module expression. The average Spearman's Rho considering all three datasets is displayed. (C) Box plots comparing the ratio of CD4+ T cell to epithelial cells in all three cohorts, stratified by expression of the sky blue (NF-κB) module. Significance tested with the Wilcoxon test. (D) Graphical summary of WGCNA modules with associated biological processes and tumor microenvironment, as well as the module size (number of genes). (E and F) Representative images of immunofluorescent staining of HPV+ HNSCCs from the UNC cohort. (E and F) tumors with low and high CD4+ cell infiltration into the tumor epithelial component, respectively. (G) Correlation between CD8+ and CD4+ cells in the tumor epithelial regions and expression of the sky blue (NF-κB) module. Pearson correlation coefficients with 95% CIs are provided. (H) Proportion of tumors with high CD4+ to nuclear staining ratios in the epithelial tumor regions. Significance based on the chi-squared test. (I) Box plot, comparing proportions of CD4+ cells in the tumor mesenchymal vs. epithelial components. Two outlier points related to low CD4 scoring in the stroma are not visualized for clarity but were included in statistical analysis. (J) Box plot, comparing proportions of CD4+ to CD8+ cells in the tumor mesenchymal component. (K) Box plot, showing proportions of FoxP3+CD4+ vs. CD+ cells in the tumor component. One outlier point with no FoxP3 staining was imputed to the lowest detectable value of FoxP3+; results were unchanged if this data point was excluded from the analysis. (L) Box plot, displaying the relative density of high ERα staining cells in the tumor component. (I–L) Significance tested with the Wilcoxen test. (GL) Epithelial tumor components were defined by central areas of cytokeratin-positive staining. *P value < 0.05. ***P value < 0.0005.
Fig. 4.
Fig. 4.
Genotypic associations with the sky blue (NF-κB) module. (A) Waterfall plot and frequency of gene alterations in tumors with low (Left) or high (Right) expression of NF-κB (sky blue) module. The top 8 nonredundant genes in terms of alteration frequency in both groups are displayed, excluding MUC16 and TTN. **z-test of equal proportions P value < 0.005. *z-test of equal proportions P value < 0.05. (B) Box plot comparing sky blue (NF-κB) module expression in tumors with and without simultaneous low (arm) level copy loss of both TRAF3 and CYLD. TCGA—Tumors with GISTIC scores of −1 for both TRAF3 and CYLD are highlighted in blue and compared to those without. UNC—Copy number log2Ratio values were estimated for TRAF3 and CYLD using the CNVkit RNA pipeline. Tumors with log2Ratio < −0.35 for both the TRAF3 and CYLD loci are highlighted in blue and compared to those without. ***Wilcoxon rank-sum test P value < 0.0005. (C) Pathway oriented mutational analysis of NF-kB pathway genes, stratified by (NF-κB) module low vs. high expression tumors. (D) Recurrence free survival of patients with HPV+ HNSCC, stratified by NF-kB pathway alterations, as in panel C. P value represents log-rank test. (E) Box plot of the number of somatic SNPs per tumor stratified by expression of the sky blue (NF-κB) module. (F) Box plot of the proportion of APOBEC-related somatic SNP per tumor stratified by expression of the sky blue (NF-κB) module. APOBEC-related SNPs as defined by the maftools function trinucleotideMatrix() function. (G and H) Pie charts showing relative abundance of mutagenic signatures in tumors with low vs. high expression of the sky blue (NF-κB) module. Values represent non-negative matrix factorization weights for the COSMIC2 signatures.
Fig. 5.
Fig. 5.
NF-κB module expression is related to patterns of viral gene expression and viral genomic integration. (AC) Analysis of RNA sequencing (RNAseq) data from the UNC Cohort. (A) Annotated heat map of HPV16 viral gene expression. Columns—tumor samples, organized by clustering on viral gene expression, normalized to human RNA. Sky blue (NF-κB) module high—tumors with high expression of the sky blue (NF-κB) module genes based on the PCA score. Sky blue (NF-κB) module expression—principal component analysis score for the NF-κB (Sky Blue) module. E6E7/E2E5 Ratio—ratio of E6 and E7 expression to E2 and E5 expression. Log2[(readsE6+readsE7)/(readsE2+readsE5)]. Split reads—presence of detectable split read pairs mapping to both the HPV16 and human genome, as identified by the ViFi viral integration software package. (B) Box plot of sky blue (NF-κB) module PCA scores for tumors with low and high E6E7/E2E5 ratio, as defined in panel A. Significance based on the Wilcoxon rank-sum test. (C) Box plot of sky blue (NF-κB) module PCA scores for tumors with and without viral integration, as defined by split read pairs as in panel A. Significance based on the Wilcoxon rank-sum test. See SI Appendix, Fig. S4 for similar analysis of the TCGA cohort. *P value < 5*10^−2. **P value < 5*10^−3.
Fig. 6.
Fig. 6.
Analysis of genomic methylation in HPV+ HNSCC with consensus clustering. (A) Heatmap of methylation probe intensities for HPV+ HNSCC tumors in TCGA organized by consensus clustering (k = 2), see Materials and Methods for further details. Green color scale—NF-κB (sky blue) module principal component analysis (PCA) scores. Dark green—denotes high expression of the NF-κB (sky blue) module (as applied in panel C). Tan—tumors assigned to methylation cluster 1. Orange—tumors assigned to methylation custer 2. Warm colors—higher beta-values (more methylated). Cool colors—lower beta-values (less methylated). (B) Box plot of NF-κB (sky blue) module principal component analysis scores, stratified by methylation subgroup. Color scale as in panel A. The P value represents the Wilcoxon rank-sum test. (C) Proportion bar plot of methylation subgroup, stratified by high and low NF-κB (sky blue) module expression. Colors as in panel A. The P value represents the z-test of equal proportions. (DF) Analysis of minor methylation probe cluster, defined by consensus clustering. DF are identical to AC, except only the minor group of methylation probes (panel A, dark purple) was included. (G) Barplot displaying the proportion of module genes with correlated changes in methylation in the area of the gene in question. (H) Barplot displaying GSEA-based adjusted P value representing the enrichment of each WGCNA module for probe–gene correlation.
Fig. 7.
Fig. 7.
Increased expression of sky blue (NF-κB) module is associated with improved patient outcomes. Kaplan–Meier plots with number at risk tables below. (AC) Recurrence-free survival (RFS) of patients included in WGCNA module analysis. (D and E) Progression-free survival (PFS) and overall survival (OS) of patients in E1308 clinical trial, a validation cohort not used in module development. (F) Combined analysis of event-free survival (RFS or PFS based on availability) in all patients treated with chemoradiation with available quantitative smoking data (UNC, TCGA, E1308). Hazard ratio CIs in parentheses represent 95% CI. P values represent the log-rank test. Follow-up was limited to 5 y.
Fig. 8.
Fig. 8.
Noncanonical oncogenic alterations activate NF-κB and radiosensitize HPV+ HNSCC cancer cells. (A) Immunoblot confirming CRISPR knockout (KO) of TRAF3 in UMSCC47 cells. (B and C) RNAseq of UMSCC47 cells with and without TRAF3 KO. (B) Gene set enrichement analysis (GSEA) for MSigDB Hallmark gene sets, ranked by adjusted P value. Gene sets with P > 0.1 are not displayed. (C) GSEA of the sky blue (NF-κB) module genes. Genes anticorrelated to the module median (12 genes, 6% of module) were excluded. (D) Clonogenic survival of UMSCC47 cells with and without TRAF3 KO. Top—raw images. Bottom—quantification. (E) Small interfering RNA knockdown of TRAF3 and CYLD. Top—RTqPCR confirmation of knockdown. Bottom—quantified clonogenic survival. (F) Improved clinical outcomes of NF-κB active patients as compared to NF-κB inactive nonsmokers. Nonsmokers defined as less than 10 pack-years of tobacco smoke exposure. Event-free survival (EFS) represents combined progression-free survival or recurrence-free survival based on availability.

References

    1. Viens L. J., et al. , Human papillomavirus-associated cancers–United States, 2008–2012. MMWR Morb. Mortal Wkly. Rep. 65, 661–666 (2016). - PubMed
    1. Shiboski C. H., Schmidt B. L., Jordan R. C. K., Tongue and tonsil carcinoma: Increasing trends in the U.S. population ages 20–44 years. Cancer 103, 1843–1849 (2005). - PubMed
    1. Tota J. E., et al. , Evolution of the oropharynx cancer epidemic in the United States: Moderation of increasing incidence in younger individuals and shift in the burden to older individuals. J. Clin. Oncol. 37, 1538–1546 (2019). - PMC - PubMed
    1. Burtness B., et al. , Pembrolizumab alone or with chemotherapy versus cetuximab with chemotherapy for recurrent or metastatic squamous cell carcinoma of the head and neck (KEYNOTE-048): A randomised, open-label, phase 3 study. Lancet 394, 1915–1928 (2019). - PubMed
    1. Ang K. K., et al. , Randomized phase III trial of concurrent accelerated radiation plus cisplatin with or without cetuximab for stage III to IV head and neck carcinoma: RTOG 0522. J. Clin. Oncol. 32, 2940–2950 (2014). - PMC - PubMed

Publication types

MeSH terms

Substances