. 2023 Oct 24;119(13):2294-2311.
doi: 10.1093/cvr/cvad118.

Integrative human atrial modelling unravels interactive protein kinase A and Ca2+/calmodulin-dependent protein kinase II signalling as key determinants of atrial arrhythmogenesis

Affiliations

Integrative human atrial modelling unravels interactive protein kinase A and Ca2+/calmodulin-dependent protein kinase II signalling as key determinants of atrial arrhythmogenesis

Haibo Ni et al. Cardiovasc Res. .

Abstract

Aims: Atrial fibrillation (AF), the most prevalent clinical arrhythmia, is associated with atrial remodelling manifesting as acute and chronic alterations in expression, function, and regulation of atrial electrophysiological and Ca2+-handling processes. These AF-induced modifications crosstalk and propagate across spatial scales creating a complex pathophysiological network, which renders AF resistant to existing pharmacotherapies that predominantly target transmembrane ion channels. Developing innovative therapeutic strategies requires a systems approach to disentangle quantitatively the pro-arrhythmic contributions of individual AF-induced alterations.

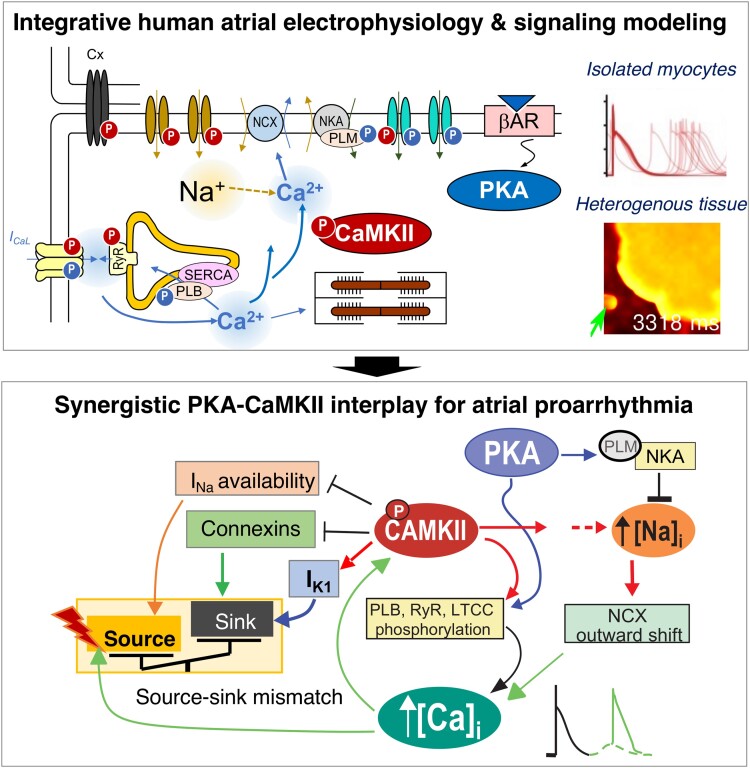
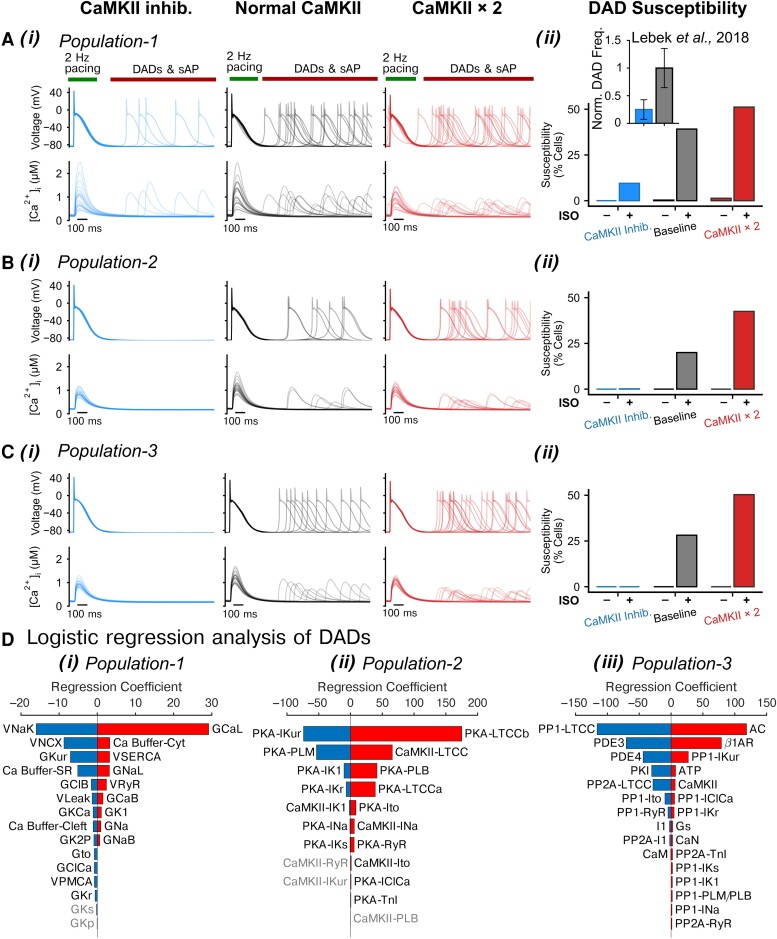
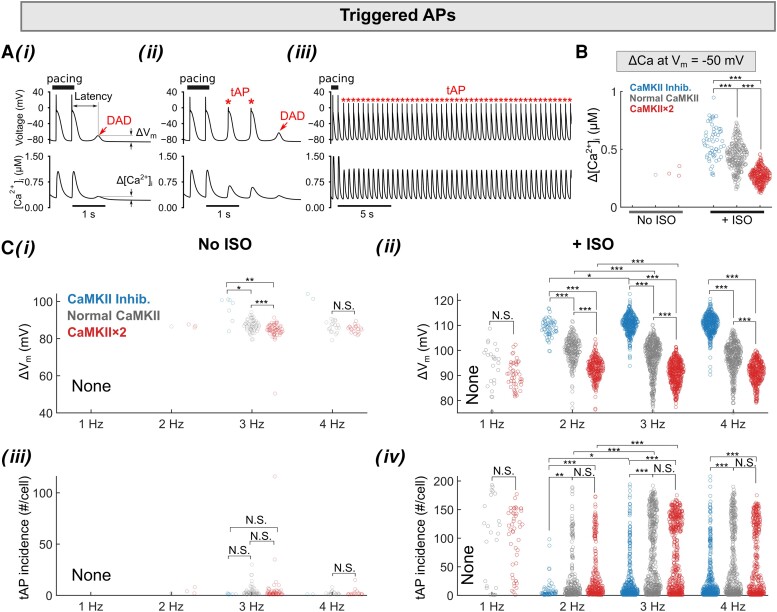
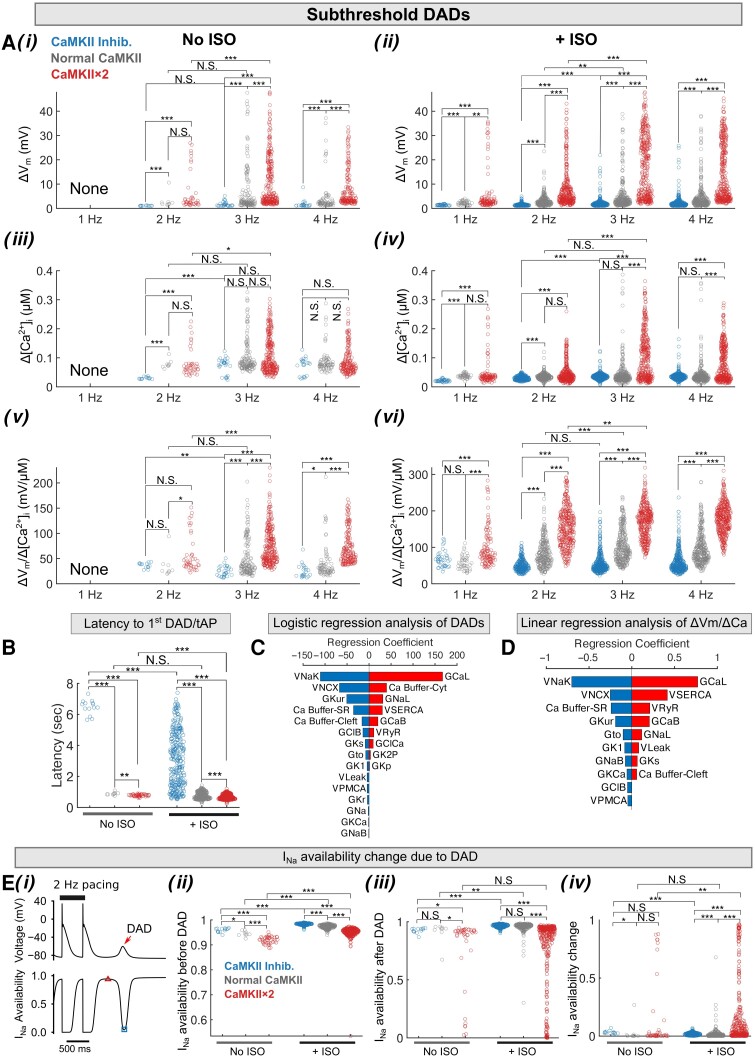
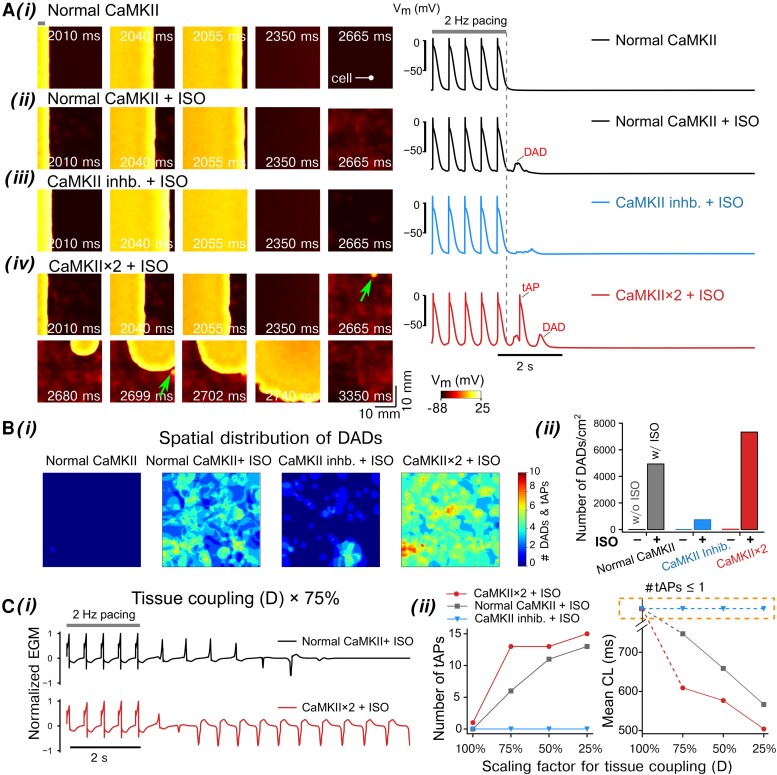
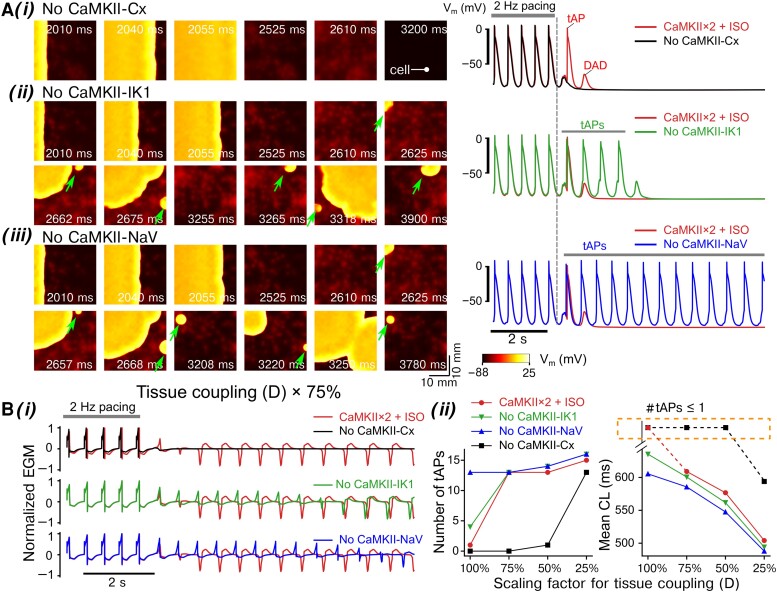
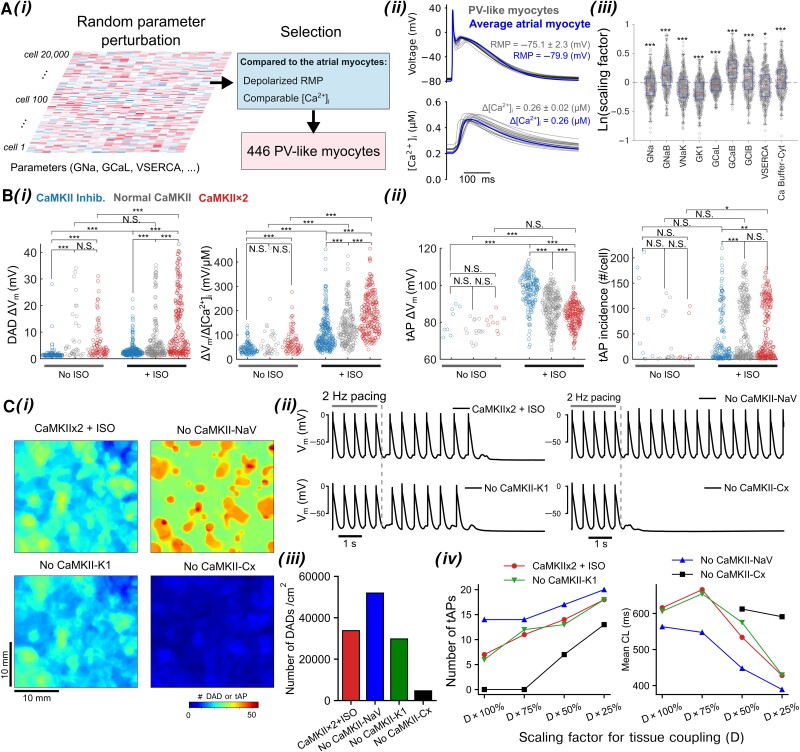
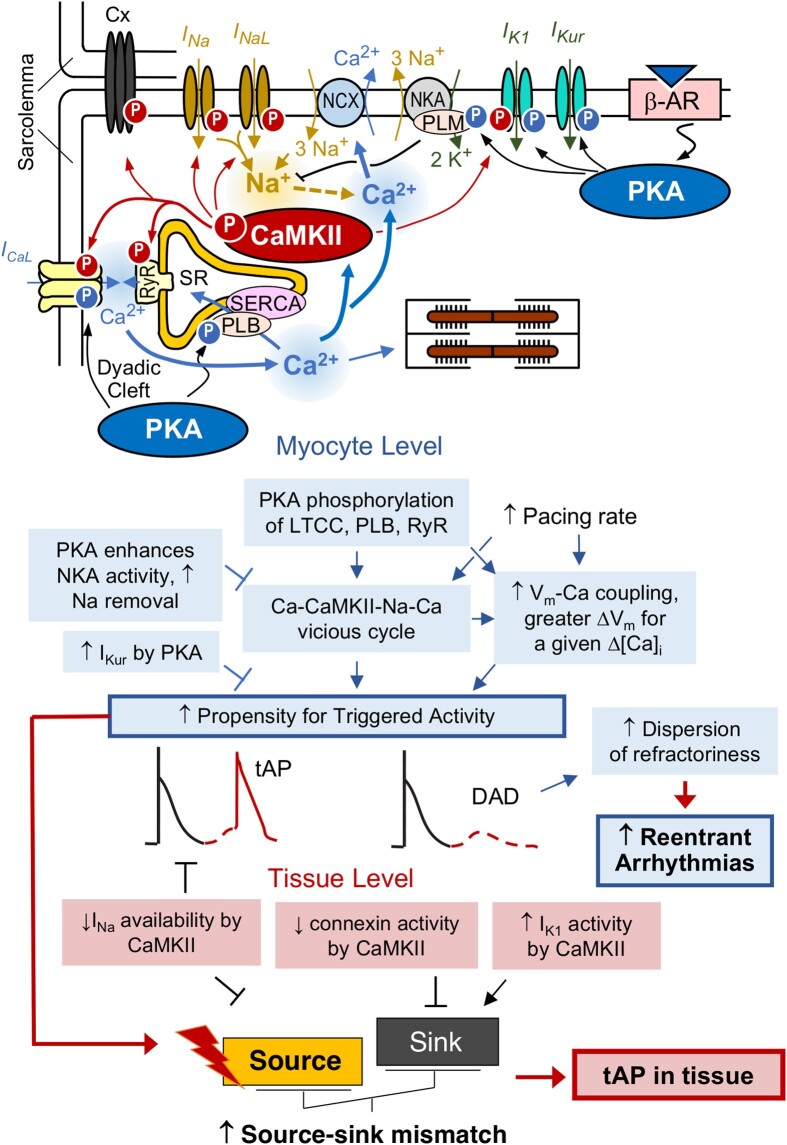
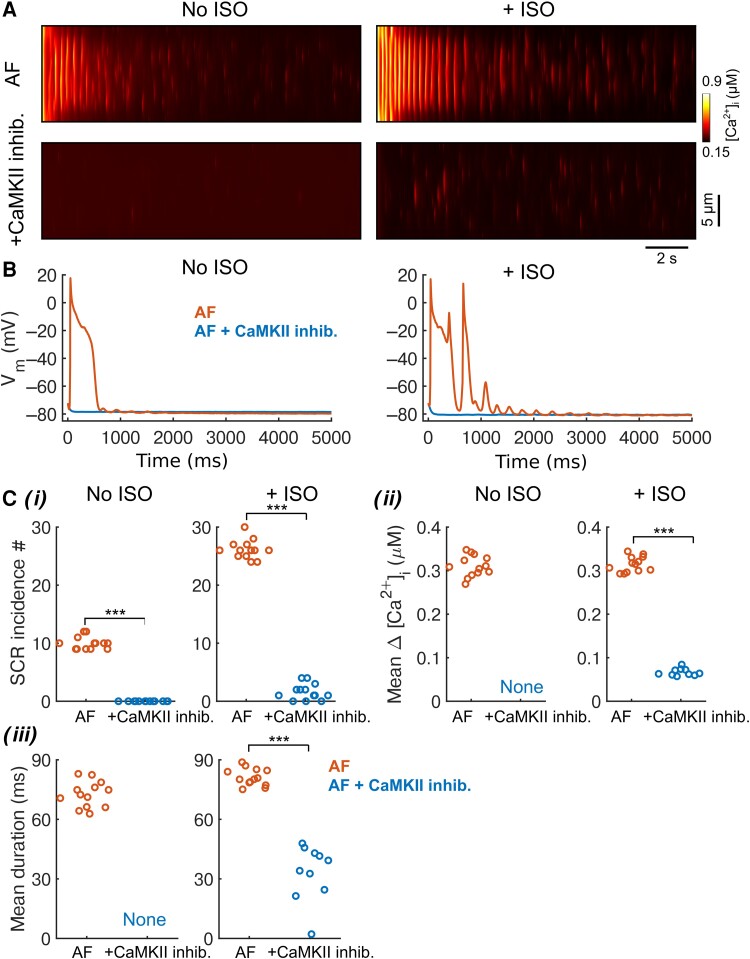
Methods and results: Here, we built a novel computational framework for simulating electrophysiology and Ca2+-handling in human atrial cardiomyocytes and tissues, and their regulation by key upstream signalling pathways [i.e. protein kinase A (PKA), and Ca2+/calmodulin-dependent protein kinase II (CaMKII)] involved in AF-pathogenesis. Populations of atrial cardiomyocyte models were constructed to determine the influence of subcellular ionic processes, signalling components, and regulatory networks on atrial arrhythmogenesis. Our results reveal a novel synergistic crosstalk between PKA and CaMKII that promotes atrial cardiomyocyte electrical instability and arrhythmogenic triggered activity. Simulations of heterogeneous tissue demonstrate that this cellular triggered activity is further amplified by CaMKII- and PKA-dependent alterations of tissue properties, further exacerbating atrial arrhythmogenesis.

Conclusions: Our analysis reveals potential mechanisms by which the stress-associated adaptive changes turn into maladaptive pro-arrhythmic triggers at the cellular and tissue levels and identifies potential anti-AF targets. Collectively, our integrative approach is powerful and instrumental to assemble and reconcile existing knowledge into a systems network for identifying novel anti-AF targets and innovative approaches moving beyond the traditional ion channel-based strategy.

Keywords: Arrhythmias; Atrial fibrillation; Computational biology; Electrophysiology; Physiology; Population modelling; Systems biology; Upstream signalling.


Conflict of interest statement

Conflict of interest: None declared.

Figures

Graphical Abstract
Graphical Abstract
A novel integrative human atrial electrophysiology and signalling model reveals synergistic PKA and CaMKII interactions promoting delayed after depolarizations and triggered action potentials in both atrial myocytes and tissues. CaMKII, Ca2+/CaM-dependent protein kinase II; Cx, connexin; IK1, inward rectifier K+ current; INa, fast Na+ current; ICaL, L-type Ca2+ current; NCX, Na+/Ca2+ exchanger; NKA, Na+/K+ ATPase; PLB, phospholamban; PLM, phospholemman; RyR, ryanodine receptor 2; SERCA, sarco/endoplasmic reticulum Ca2+ ATPase; βAR, β adrenergic receptor; PKA, protein kinase A.
Figure 1
Figure 1
Populations of models uncover synergistic interplay between PKA and CaMKII signalling in promoting DADs. (A–C) (i) APs and CaTs simulated using (A) Population-1, (B) Population-2, and (C) Population-3 under CaMKII inhibition, normal CaMKII, or with two-fold CaMKII expression conditions after application of ISO following a 2 Hz pacing and pause protocol; (ii) fraction of cells developed DADs. Inset in (A) (ii): normalized frequency of DADs for human atrial cardiomyocytes under control vs. CaMKII inhibition conditions reported in experiments (Lebek et al.). (D) Logistic regression analysis of DAD incidence under two-fold CaMKII expression conditions and after ISO application for (i) Population-1, (ii) Population-2, and (iii) Population-3, respectively. Please refer to Supplementary material online, Tables S1–S3 for abbreviation descriptions for panel (D).
Figure 2
Figure 2
Populations of models reveal rate dependence of tAPs in human atrial cardiomyocytes following a pace-pause protocol. (A) Illustration of three types of membrane Vm instabilities following a pace-pause protocol: (i) sub-threshold DAD only, (ii) both sub-threshold DAD and tAPs, and (iii) long-lasting tAPs. (B) Threshold Ca2+ amplitude causing tAPs is measured as the [Ca2+]i when Vm depolarizes to −50 mV. (C) Rate-dependent characterization of tAPs without (i and iii) and with (ii and iv) ISO treatment: (i and ii) mean voltage amplitude and (iii and iv) number of tAPs for each cardiomyocyte that developed tAPs. Statistical analysis was performed using Kruskal–Wallis test followed by planned comparisons with Wilcoxon rank sum test and Bonferroni correction. ***P < 0.001; **P < 0.01; *P < 0.05; N.S., not significant.
Figure 3
Figure 3
Populations of models reveal rate dependence of sub-threshold DADs in human atrial cardiomyocytes following a pace-pause protocol. (A) Rate-dependent characterization of sub-threshold DAD: (i and ii) amplitudes of Vm instability (ΔVm) and (iii and iv) associated [Ca2+]i (Δ[Ca2+]i), and (v and vi) Vm to [Ca2+]i coupling (ΔVm/Δ[Ca2+]i); the left and right columns display data for no ISO conditions and after ISO treatment, respectively. (B) Latency to developing first sub-threshold DAD or tAP after cessation of 2-Hz stimulation. (C) Logistic regression analysis of sub-threshold DAD incidence in a subpopulation of Population-1 comprising model variants displaying only sub-threshold DADs and those showing no membrane instability for CaMKII × 2 + ISO application. (D) Linear regression analysis reveals the influence of subcellular parameters on the ΔVm/Δ[Ca2+]i of sub-threshold DADs. (E) CaMKII activation reduces INa availability following a sub-threshold DAD. (i) Illustration of tAPs and sub-threshold DADs after 2 Hz pacing, and the accompanying INa availability. The maximum INa availability before a sub-threshold DAD is indicated with a triangle, and its minimum after a sub-threshold DAD is marked with a square. (ii) Comparison of maximum INa availability before sub-threshold DADs. (iii) Comparison of minimum INa availability after sub-threshold DADs. (iv) The INa availability change due to sub-threshold DAD (computed as the difference between maximum and minimum availability). Statistical analysis was performed using Kruskal–Wallis test followed by planned comparisons with Wilcoxon rank sum test and Bonferroni correction. ***P < 0.001; **P < 0.01; *P < 0.05; N.S., not significant.
Figure 4
Figure 4
Effects of PKA and CaMKII activation on the membrane instabilities in simulated 2D atrial tissue. The 2D tissue slab was paced from the left side [site width indicated with a bar in top left of panel (i)] using a 2 Hz pacing (five beats) and pause protocol. The total simulated time was 10 s. (A, left) Time-stamped snapshots of tissue cell membrane voltage map featuring membrane voltage changes following the last pacing at t = 2000 ms. (A, right) Time courses of single-cell AP extracted from the tissue. The cell location is indicated in (A) (i), left. Panels (iiv) illustrate (i) normal CaMKII without ISO, (ii) normal CaMKII with ISO, (iii) CaMKII inhibition with ISO, and (iv) two-fold CaMKII expression with ISO. Triggered AP initiation is indicated by arrows. (B) (i) Spatial distribution and (ii) density of DAD incidences in the tissue slab following the cessation of the pacing protocol. (C) (i) Simulated electrograms (EGMs) from the tissue simulations at reduced gap junction conductance (scaled to 75%, D × 75%) for the normal vs. CaMKII × 2 with ISO application. (ii) Effects of CaMKII inhibition or two-fold CaMKII expression on the number of tAP propagation and cycle length (CL) for normal and reduced gap junction conductances (D scaled from 100 to 25%).
Figure 5
Figure 5
Dissecting the roles of CaMKII-dependent modulations of connexins (CaMKII-Cx), IK1 (CaMKII-IK1), and Na+ channel availability (CaMKII-NaV) in inducing tAPs in tissue. The 2D tissue slab was paced from the left side [site width indicated with a bar in top left of panel (i)] using a 2 Hz pacing (five beats) and pause protocol. The total simulated time was 10 s. (A, left) Time-stamped snapshots of tissue cell membrane voltage map featuring membrane voltage changes following the last pacing at t = 2000 ms. (A, right) Time courses of single cell AP extracted from the tissue. The location of the cell is marked in (A) (i), left. (i–iii) illustrate simulations after ISO application with two-fold CaMKII expression but removing CaMKII-dependent modulations of (i) gap junctions (No CAMKII-Cx), (ii) IK1 (No CaMKII-IK1), and (iii) Na+ channel availability (No CaMKII-NaV). The 2D tissue slab was paced from the left side using a 2 Hz pacing (five beats) and pause protocol. Triggered AP initiation is indicated by arrows. (B) (i) Simulated EGMs from the tissue simulations at reduced gap junction conductance (scaled to 75%, D × 75%) showing effects of removing the CaMKII-dependent modulations on gap junctions (Cx), IK1, and Na+ channel availability. (ii) Number of tAP propagation and CL for normal and reduced tissue conductivities (D scaled from 100 to 25%).
Figure 6
Figure 6
Populations of PV-like myocytes and tissues demonstrate critical roles of PKA and CaMKII signals in promoting Vm and Ca2+ instabilities in PVs. (A) (i) Illustration of generating PV-like cardiomyocytes models by introducing random parameter perturbation to the average atrial cardiomyocyte model; model calibration selected PV-like cardiomyocytes as having depolarized RMP compared to the average LA cardiomyocytes while the [Ca2+]i being comparable. (A) (ii) Superimposed AP and [Ca2+]i traces of PV-like cardiomyocyte population and the average LA cardiomyocyte model paced at 1 Hz. (A) (iii) Identification of subcellular parameters of the PV-like cardiomyocyte population that are significantly different from the average LA cardiomyocyte. Note that the y-axis plots the scaling factors for those subcellular parameters in logarithm, and the scaling factors of the average atrial cardiomyocyte are thus zero and indicated with a dashed line. Statistical test was performed using one-sample t-test with Bonferroni correction. (B) Characterization of (i, left) Vm amplitude and (i, right) ΔVm/Δ[Ca2+]i coupling strength for sub-threshold DADs, and (ii, left) mean amplitude and (ii, right) number of incidence for tAPs in each PV-like cardiomyocyte following a 2-Hz pacing-pause protocol. Statistical analysis was performed using Kruskal–Wallis test followed by planned comparisons with Wilcoxon rank sum test and Bonferroni correction. (C) Tissue simulations uncover precise contributions of CaMKII-dependent modulations of INa availability (CaMKII-NaV), IK1 activity (CaMKII-K1), and connexins (CaMKII-Cx). (i) Spatial distribution of sub-threshold DADs and tAPs in simulated tissue following 2 Hz pacing-pause protocol. (ii) APs of cardiomyocytes extracted from the tissue. (iii) Density of DAD and tAP incidence in tissue. (iv, left) incidence number and (iv, right) mean CL of tAPs in tissue with respect to gradual reduction of tissue coupling. ***P < 0.001; **P < 0.01; *P < 0.05; N.S., not significant.
Figure 7
Figure 7
Working model schematic illustrates the mechanisms underlying PKA and CaMKII activations promoting DADs and tAPs in both atrial myocytes and tissues.
Figure 8
Figure 8
Three-dimensional spatial model of non-stimulated human atrial cardiomyocytes shows that AF-induced remodelling and ISO treatment promote tAPs and Ca2+ release events, which are ameliorated by CaMKII inhibition. The spatial cell model was pre-conditioned with same initial conditions (i.e. same ion channel states, local Ca2+ concentrations in each compartment, etc.) before switching on AF remodelling effects, and adding ISO or CaMKII inhibition treatment effects. (A) Simulated transversal line-scan of [Ca2+]i in AF-remodelled human atrial cardiomyocytes showing effects of ISO treatment or CaMKII inhibition. (B) Membrane Vm of AF-remodelled cardiomyocytes and following treatments. (C) Characterization of SCR events in response to treatments measured with 13 transversal line scans spaced by 5.5 μm along the longitudinal axis. (i) Number of SCR incidence, (ii) mean [Ca2+]i amplitude of SCR, and (iii) mean duration of SCR. Two-sample Student’s t-test was applied to perform statistical test. ***P < 0.001.

Similar articles

Cited by

References

    1. Andrade J, Khairy P, Dobrev D, Nattel S. The clinical profile and pathophysiology of atrial fibrillation relationships among clinical features, epidemiology, and mechanisms. Circ Res 2014;114:1453–1468. - PubMed
    1. Chung MK, Refaat M, Shen W-K, Kutyifa V, Cha Y-M, Di Biase L, Baranchuk A, Lampert R, Natale A, Fisher J, Lakkireddy DR. Atrial fibrillation. J Am Coll Cardiol 2020;75:1689–1713. - PubMed
    1. Nattel S, Heijman J, Zhou L, Dobrev D. Molecular basis of atrial fibrillation pathophysiology and therapy: a translational perspective. Circ Res 2020;127:51–72. - PMC - PubMed
    1. Heijman J, Guichard J-B, Dobrev D, Nattel S. Translational challenges in atrial fibrillation. Circ Res 2018;122:752–773. - PubMed
    1. Michaud GF, Stevenson WG. Atrial fibrillation. N Engl J Med 2021;384:353–361. - PubMed

MeSH terms

Substances