. 2023 Jul 31;14(1):4599.
doi: 10.1038/s41467-023-40155-7.

Three-dimensional molecular architecture of mouse organogenesis

Affiliations

Three-dimensional molecular architecture of mouse organogenesis

Fangfang Qu et al. Nat Commun. .

Abstract

Mammalian embryos exhibit sophisticated cellular patterning that is intricately orchestrated at both molecular and cellular level. It has recently become apparent that cells within the animal body display significant heterogeneity, both in terms of their cellular properties and spatial distributions. However, current spatial transcriptomic profiling either lacks three-dimensional representation or is limited in its ability to capture the complexity of embryonic tissues and organs. Here, we present a spatial transcriptomic atlas of all major organs at embryonic day 13.5 in the mouse embryo, and provide a three-dimensional rendering of molecular regulation for embryonic patterning with stacked sections. By integrating the spatial atlas with corresponding single-cell transcriptomic data, we offer a detailed molecular annotation of the dynamic nature of organ development, spatial cellular interactions, embryonic axes, and divergence of cell fates that underlie mammalian development, which would pave the way for precise organ engineering and stem cell-based regenerative medicine.


Conflict of interest statement

The authors declare no competing interests.

Figures
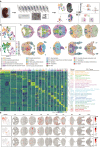
Fig. 1
Fig. 1. 3D spatial transcriptional atlas for mouse organogenesis at E13.5.
a Schematic overview of experimental design and analysis workflow for the spatial transcriptome of mouse organogenesis at E13.5. b UMAP projection and clustering of the spatial transcriptome from all sections and spots, colored by spatial domains (Top) and sections (Bottom). c The spatial distribution of 19 UMAP clusters in (b) across all embryo tissue sections, annotated according to anatomical structures and molecular features in (d). d The heatmap showing the expression pattern of the top five representative marker genes for each spatial domain. Examples of marker genes are listed together with the enriched Gene Ontology (GO) terms for selected spatial domains. e UMAP projection and spatial expression distribution of selected marker genes, Myog, Gal, and Ptgds across all the ten embryo sections. S section, D domain.
Fig. 2
Fig. 2. Spatial gene regulation network, signaling and proliferation activity.
a Heatmap of mean regulon activity score of selected top regional specific regulons for each spatial domain. b Spatial distribution of regulon activity scores across embryonic tissues for selected domain-specific regulons. c The hierarchical clustering of heatmap showing the seven regulon groups based on CSI matrix, with associated spatial domains, representative TFs and spatial plots visualizing the spatial distribution of mean activity score across each section. d The co-expression network based on CSI for the seven regulon groups. The node with different colors represents the regulon in each module and width of edge represents the CSI value of two nodes (filtered with CSI > 0.85). Color of the edges represents positive (brown) or negative (green) correlation. e Activity of development-related signaling pathways in each spatial domain. Differentially activated signaling in spatial domains computed by two-sided Wilcoxon rank-sum test are marked with * for mean score greater than 0 and p-value less than 0.001. f UMAP and spatial plots showing activities of Notch and Nodal signaling in all spots and all sections of embryo tissue. g. Spatial plots showing the spatial distribution of cell cycle activity of G1, G2M and S phase in embryo tissue and the spatial expression of Mki67.
Fig. 3
Fig. 3. Spatially resolved molecular characterization of major organs and sex specification.
a UMAP embedding of spots from D5 (visceral organ) labeled by subclusters in embryo E1. b Spatial distribution of the 10 subclusters of D5. Segmented regions are highlighted on S9 (right) and colored according to the denoted anatomical structure. Subcluster 6 Nep_sp_Om was further divided into 6.1 and 6.2 to represent finer structures. Trachea_Mes, trachea and mesenchyme; Nep_sp_Om, mesonephros-spleen-superior recess of omental bursa. c The heatmap showing the expression pattern of selected top marker genes for each subcluster. d Spatial expression of selected marker genes Barx1 for Stomach (top) and Nkx2-1 for lung (middle) across all embryo sections. The dashed box showing the region-specific expression of Barx1 in the stomach region of S9 (bottom left) and Nkx2-1 (bottom right) in the lung region of S7 and their corresponding regions in tissue images. e Subcluster annotation of D5 (top) and segmented regions are highlighted according to the denoted anatomical structure (bottom) on section 9.5 (F9.5) in embryo E3. f Heatmap showing the sex-related gonad-specific marker genes for the female and male embryos, of which pink represents female-specific, light blue represents male-specific, and gray represents common-specific marker genes. g Spatial distribution of sex-related gonad-specific marker genes Dppa3 for common, Lefty2 for male and Irx3 for female in S9 of male embryo E1 and F9.5 of female embryo E3. h Rank plot for regulons in gonad based on regulon specificity score (left). Spatial distribution of regulon activity scores for regulon Sall4 and Zfp42 in both male and female tissue sections. i The spatial distribution of annotated subclusters of D19-heart. Ven, Ventricular; OFT, Outflow tract; Epi, Epicardial. j Spatial expression of selected sub-domain specific marker genes Myl1 (Atrial), Myl2 (Ven), Eln (OFT), and Nsrp1 (Epi). k The spatial map of predicted cell types in the heart region. l Spatial visualization of deconvoluted weights of 8 heart-specific cell types including atrial cardiomyocytes (atrial_cm), ventricular cardiomyocytes (ventricular_cm), endocardial endothelial cells (endocardial_ec), vascular endothelial cells (vascular_ec), epicardial cells, fibroblast-like cells, immune cells, and blood cells. S section, D domain.
Fig. 4
Fig. 4. 3D alignment to reveal body axes and spinal cord patterning.
a Heatmap plot showing the smoothed spatial expression pattern of Hox family genes along the A–P axis with spots from hindbrain and spinal cord regions ordered by pseudo-axis within each section. b Pseudo-time trajectory plot showing pseudo-space patterning of spots from hindbrain and spinal cord region across sections of whole mouse embryos, colored by section numbers (top) and pseudo-time (bottom). c Spatial expression of selected Hox family genes and newly identified A–P axis related genes in hindbrain and spinal cord from sections along anterior to posterior (top), and heatmap showing the expression pattern of corresponding genes ordered along sections from anterior to posterior (bottom). d Spatial plot showing the D–M–V activity scores for respective neuronal progenitors and neuronal cells in the spinal cord of sections 5 and 6. e Spatial expression of selected D–V axis-related genes in sections 5 and 6. f. RNAScope multiplex in situ hybridizations of D–V patterning genes in the spinal cord, and representative images from hybridizations on sections 5 and 6 (n = 3). Scale bars, 100 μm. g Spatial visualization of radial axis patterning genes in the spinal cord region. h RNAScope multiplex in situ hybridizations of radial axis patterning genes in the spinal cord, and representative images from hybridizations on serial sections from anterior to posterior (ns5,6,7 = 3, ns3,8,9 = 2). Scale bars, 100 μm. Source data are provided as a Source Data file.
Fig. 5
Fig. 5. Spatial mapping of cell populations across all the tissue sections.
a Deconvolution analysis inferred the weights of 46 cell populations in all spots of embryo tissue. The dot plot showing cell type composition within each spatial domain. Color bar indicates the averaged cell-type weights in each spatial domain. Dot size represents the relative abundance of cell types in each spatial domain. b Spatial distribution of organ/tissue specific cells including epithelium, intermediate mesoderm, pre-epidermal keratinocytes, cardiomyocytes and hepatocytes. c The workflow of STcomm analysis pipeline which combined the spatial cellular colocalization and L–R co-expression from spatial transcriptomic data with cell–cell communication inferred from sc-RNA seq data (see the “Methods” section). Source data are provided as a Source Data file.
Fig. 6
Fig. 6. Cell–cell communication network of spatial proximity brain-related cell types in mouse embryo organogenesis.
a Schematic showing the number of significant L–R pair interactions between olfactory sensory neurons and olfactory epithelium cells by STcomm analysis (top). The bottom panel showing the spatial mapping (color intensity) and colocalization of olfactory sensory neurons and olfactory epithelium cells according to deconvoluted weights in section 4 (S4). b Dot plot showing significant L–R pairs between olfactory sensory neurons and olfactory epithelium cells via secreted signaling (left) and cell-cell contact (right) with p < 0.05. The dot color represents communication probability and the size indicates p-values which are computed from one-sided permutation test by Cellchat. c The spatial distribution of expression of L–R pairs of Wnt4 and Fzd3, and their co-expression in S4. The inlet shows the co-expression level of Wnt4 and Fzd3 in co-localized region of olfactory sensory neurons and olfactory epithelium. d The spatial distribution of expression of L–R pairs of Efna5 and Epha4, and their co-expression in S4. e Dot plot showing significant L–R pairs communication among spatial proximity brain-related cell types calculated by STcomm. The dot color and size indicate communication probability and p-values which are computed from the one-sided permutation test by Cellchat. f Schematic showing the number of significant L–R interactions between neuron progenitor cells and inhibitory interneurons. g Circos plots representing significant interaction of L–R pairs of Nrxn3 and Nlgn1 among spatial proximity brain-related cell types. h Spatial plots showing the spatial distribution (color intensity) and colocalization with spots of neuron progenitor cells and inhibitory interneurons according to deconvoluted weights in section 2 (S2). i Spatial distribution of expression and co-expression of L–R Nrxn3 and Nlgn1 in S2. j Nrxn3 and Nlgn1 spatial expression pattern examined by RNA-scope in brain tissue sections matched to S2 in (i) (n = 4). White dashed box showing the staining of Nrxn3 and Nlgn1 in spatial proximity cells. Blue, DAPI; green, Nrxn3; red, Nlgn1; yellow, co-location of Nrxn3 and Nlgn1. Source data are provided as a Source Data file.

References

    1. Qiu C, et al. Systematic reconstruction of cellular trajectories across mouse embryogenesis. Nat. Genet. 2022;54:328–341. doi: 10.1038/s41588-022-01018-x. - DOI - PMC - PubMed
    1. Cao J, et al. The single-cell transcriptional landscape of mammalian organogenesis. Nature. 2019;566:496–502. doi: 10.1038/s41586-019-0969-x. - DOI - PMC - PubMed
    1. Xu, Y. et al. A single-cell transcriptome atlas of human early embryogenesis. Nat. Cell Biol.25, 604–615 (2022). - PubMed
    1. Peng G, et al. Molecular architecture of lineage allocation and tissue organization in early mouse embryo. Nature. 2019;572:528–532. doi: 10.1038/s41586-019-1469-8. - DOI - PubMed
    1. Lohoff T, et al. Integration of spatial and single-cell transcriptomic data elucidates mouse organogenesis. Nat. Biotechnol. 2022;40:74–85. doi: 10.1038/s41587-021-01006-2. - DOI - PMC - PubMed

Publication types