. 2023 Jul 31;14(1):4594.
doi: 10.1038/s41467-023-40199-9.

Engineering tRNA abundances for synthetic cellular systems

Affiliations

Engineering tRNA abundances for synthetic cellular systems

Akshay J Maheshwari et al. Nat Commun. .

Abstract

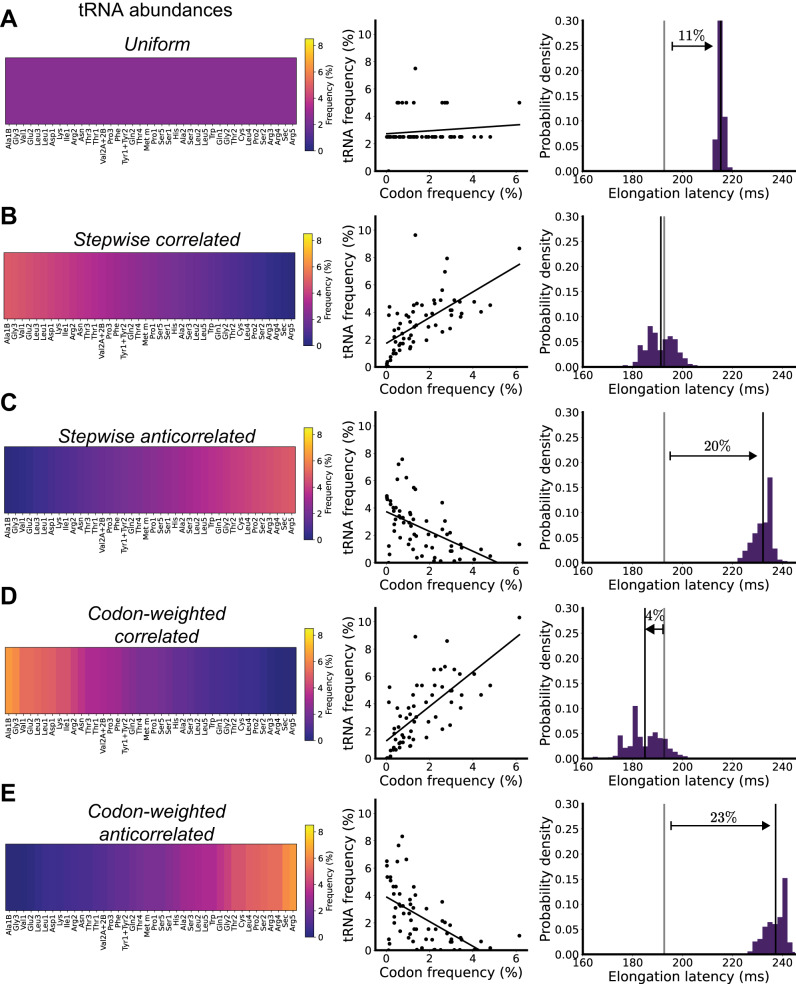
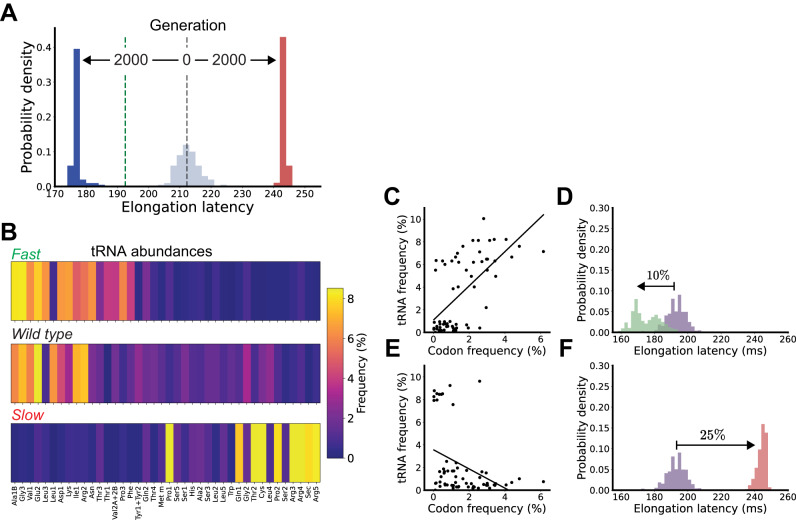
Routinizing the engineering of synthetic cells requires specifying beforehand how many of each molecule are needed. Physics-based tools for estimating desired molecular abundances in whole-cell synthetic biology are missing. Here, we use a colloidal dynamics simulator to make predictions for how tRNA abundances impact protein synthesis rates. We use rational design and direct RNA synthesis to make 21 synthetic tRNA surrogates from scratch. We use evolutionary algorithms within a computer aided design framework to engineer translation systems predicted to work faster or slower depending on tRNA abundance differences. We build and test the so-specified synthetic systems and find qualitative agreement between expected and observed systems. First principles modeling combined with bottom-up experiments can help molecular-to-cellular scale synthetic biology realize design-build-work frameworks that transcend tinker-and-test.


Conflict of interest statement

A.J.M. and J.C. are founders of b.next, a synthetic biology company routinizing the engineering of cells. All other authors declare no competing interests.

Figures

Fig. 1
Fig. 1. Natural abundances of tRNA in wild-type E. coli should account for an 11% quickening of protein synthesis compared to random abundances.
A tRNA abundances (percentages, color bar) in wild-type E. coli compared to a representative random tRNA abundance distribution. tRNA are ordered based on decreasing frequency of cognate codons in the transcriptome. B Distribution for computed elongation latencies of randomly generated tRNA abundance distributions (gray; average: black line) compared with the elongation latency of the wild-type E. coli tRNA abundance distribution (green line). Source data are provided via a Zenodo repository (10.5281/zenodo.7953836).
Fig. 2
Fig. 2. Most rationally engineered tRNA abundance distributions should hinder protein synthesis.
For each tRNA abundance distribution (AE): Left: relative tRNA abundances (percentages, color bar). tRNA are ordered based on decreasing frequency of cognate codons in the E. coli transcriptome. Middle: the fraction of cognate tRNA per codon (each codon is represented by its relative usage in the transcriptome). Right: the per-transcript elongation latency distribution (purple; average, black line) vs. that of wild-type E. coli (average, gray line; percentage change in elongation). Source data are provided via a Zenodo repository (10.5281/zenodo.7953836).
Fig. 3
Fig. 3. Computer-aided design of tRNA abundances enables a broad dynamic range of specifiable translation elongation rates.
A Iterative selection of tRNA abundance distributions by CD-CAD enables either faster (blue) or slower (red) elongation compared to the initially random population that seeds the genetic algorithm (gray). Each distribution represents the expected average transcriptome-wide elongation latencies among individual tRNA distributions competing in the genetic algorithm (Methods); average elongation latencies computed with the wild-type tRNA distribution (green dashed line) and the uniform tRNA distribution (black dashed line). B tRNA abundance distributions produced by CD-CAD that enable the fastest or slowest elongation compared to wild-type E. coli (color bar, percentages). C The fraction of cognate tRNA per codon (each codon represented by its relative usage in the transcriptome) for the tRNA distribution that enables the fastest elongation. D Per-transcript elongation latency distribution for the tRNA abundance distribution that enables the fastest elongation (green) vs. the wild-type abundance distribution (purple). E, F Same as (C, D) but for the tRNA abundance distribution produced by CD-CAD that enables the slowest elongation (red). Source data are provided via a Zenodo repository (10.5281/zenodo.7953836).
Fig. 4
Fig. 4. Computer-aided design of tRNA abundances for quantitative control of synthetic organisms encoded by fail-safe genomes.
A Computationally designed fail-safe E. coli engineered to have only 20 sense codons (adapted from Calles et al. under a Creative Commons CC BY license); white boxes represent sense codons. B Reduced tRNA abundance distributions produced by CD-CAD that enable the fastest elongation or slowest elongation compared to the wild-type distribution (color bar, percentages). C The fraction of cognate tRNA per codon, with each codon represented by its relative usage in the transcriptome, for the reduced tRNA abundance distribution that enables the fastest elongation. D Per-transcript elongation latency distribution for the reduced tRNA abundance distribution that enables the fastest elongation (green) vs. wild-type (purple). E, F are the same as (C, D) but for the reduced tRNA abundance distribution that enables the slowest elongation (red). Source data are provided via a Zenodo repository (10.5281/zenodo.7953836).
Fig. 5
Fig. 5. Experimental construction and validation of CAD-engineered tRNA abundances in a synthetic system expressing a fail-safe encoded gene.
A Schematic overview of TINA with CD-CAD. We designed synthetic tRNA sequences that we sourced via direct RNA synthesis. We used CD-CAD to design tRNA abundance distributions and combined our synthetic tRNA as specified. We built in vitro translation systems by supplementing PUREΔtRNA with synthetic tRNA distributions plus synthetic initiator tRNA. Colors and color bars represent concentration of each tRNA species per reaction mixture. Icons adapted with permission from The Noun Project under a Creative Commons CC BY license. B CD-CAD specified tRNA distributions optimized for faster (synFast, above) and slower (synSlow, below) translation of RED20-encoded GFP. Color bars represent concentration of each tRNA species per reaction mixture. (C–K) Experimental data from tRNA batch #1 (CE, n = 3 technical replicates), tRNA batch #2 (FH, n = 4 technical replicates), and tRNA batch #3 (IK, n = 5 technical replicates). Protein expression for three tRNA distributions is measured and analyzed: synFast (green), synSlow (orange), and uniform (blue, IK only) along with a negative control, PUREΔtRNA (black, labeled as (-)). Colors are used consistently across (CK). Traces of GFP fluorescence over time (C, F, I), numerically computed derivatives of these traces (D, G, J) and calculated protein synthesis rates (E, H, K). In (C, F, I), solid lines represent the mean trace across replicates for each distribution. Shaded regions represent the 95% confidence interval in the estimate of the mean across replicates within each condition. Dashed lines represent the mean of traces individually smoothed with a Gaussian filter (see “Methods”). In (D, G, J), solid lines represent the mean of smoothed derivatives across replicates for each distribution. Shaded regions represent the 95% confidence interval in the estimate of the mean. In (E, H, K), error bars represent 95% confidence interval in the estimate of the mean and colors bars are mean values; colored dashed vertical lines are CD-CAD predicted rates. Solid black lines with labels show statistical significance (n.s. is not significant, *p < 0.05, **p < 0.01); one-sided Kolmogorov–Smirnov (KS) tests used for comparing synFast to all others, and a two-sided KS test used for comparing synSlow to Uniform. Source data are provided via a Zenodo repository (10.5281/zenodo.7953836).

References

    1. Smith HO, Hutchison CA, Pfannkoch C, Venter JC. Generating a synthetic genome by whole genome assembly: φX174 bacteriophage from synthetic oligonucleotides. Proc. Natl Acad. Sci. USA. 2003;100:15440–15445. doi: 10.1073/pnas.2237126100. - DOI - PMC - PubMed
    1. Chan LY, Kosuri S, Endy D. Refactoring bacteriophage T7. Mol. Syst. Biol. 2005;1:2005.0018. doi: 10.1038/msb4100025. - DOI - PMC - PubMed
    1. Hutchison, C. A. et al. Design and synthesis of a minimal bacterial genome. Science351, aad6253 (2016). - PubMed
    1. Szymanski E, Calvert J. Designing with living systems in the synthetic yeast project. Nat. Commun. 2018;9:2950. doi: 10.1038/s41467-018-05332-z. - DOI - PMC - PubMed
    1. Jaschke PR, Dotson GA, Hung KS, Liu D, Endy D. Definitive demonstration by synthesis of genome annotation completeness. Proc. Natl Acad. Sci. USA. 2019;116:24206–24213. doi: 10.1073/pnas.1905990116. - DOI - PMC - PubMed

Publication types