. 2023 Aug;55(8):1311-1323.
doi: 10.1038/s41588-023-01460-5. Epub 2023 Jul 31.

SF3B1 hotspot mutations confer sensitivity to PARP inhibition by eliciting a defective replication stress response

Affiliations

SF3B1 hotspot mutations confer sensitivity to PARP inhibition by eliciting a defective replication stress response

Philip Bland et al. Nat Genet. 2023 Aug.

Abstract

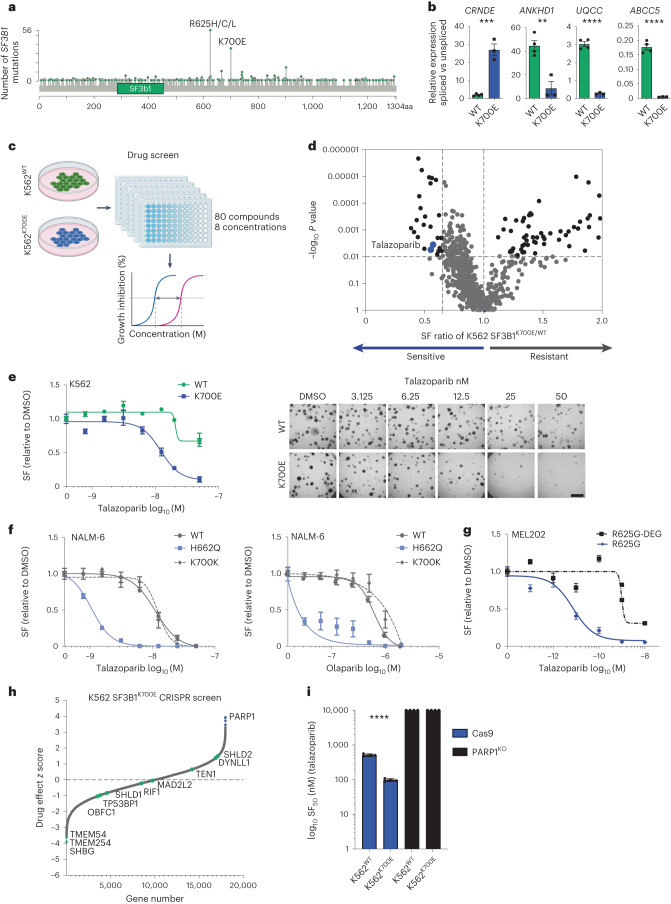
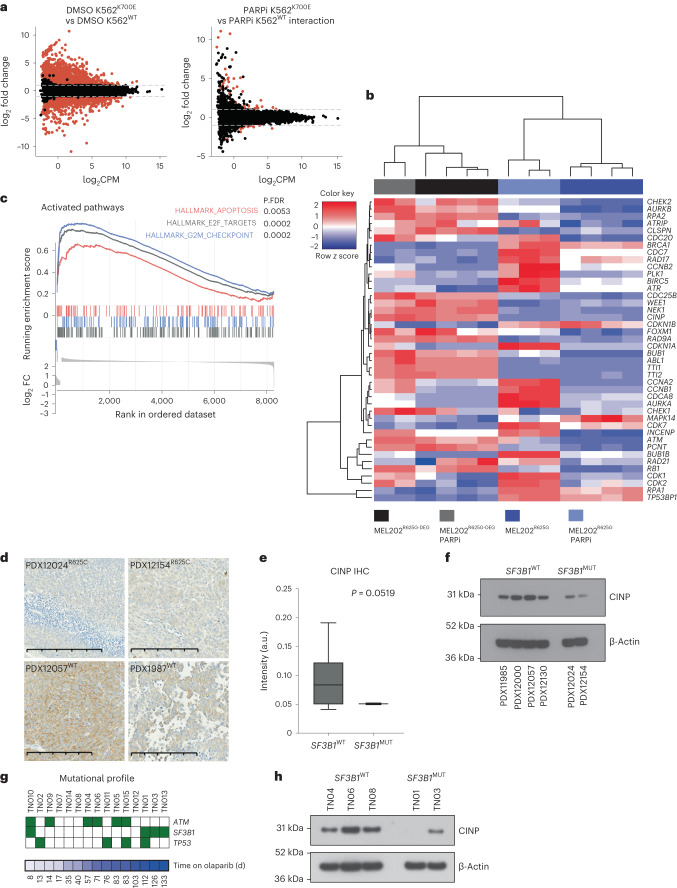
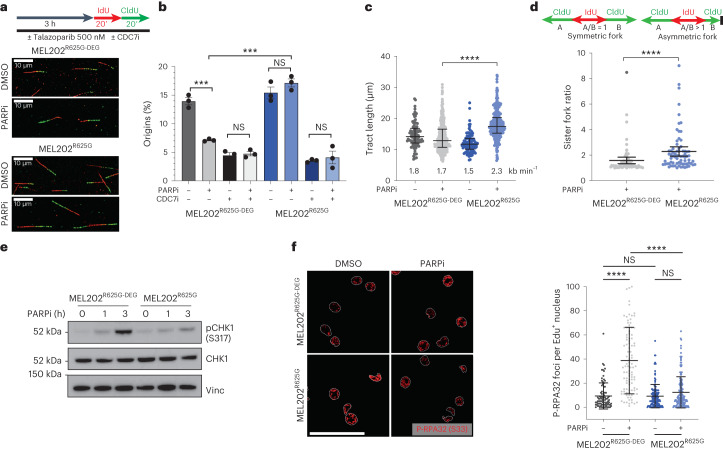
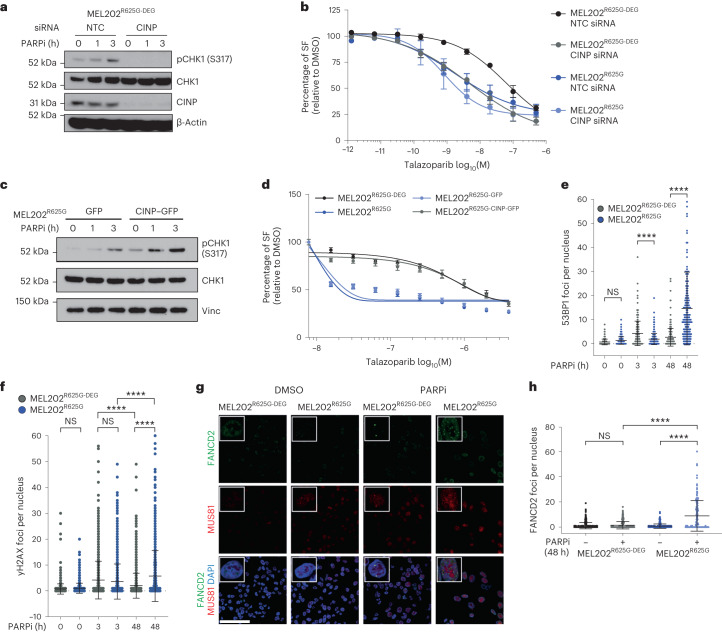
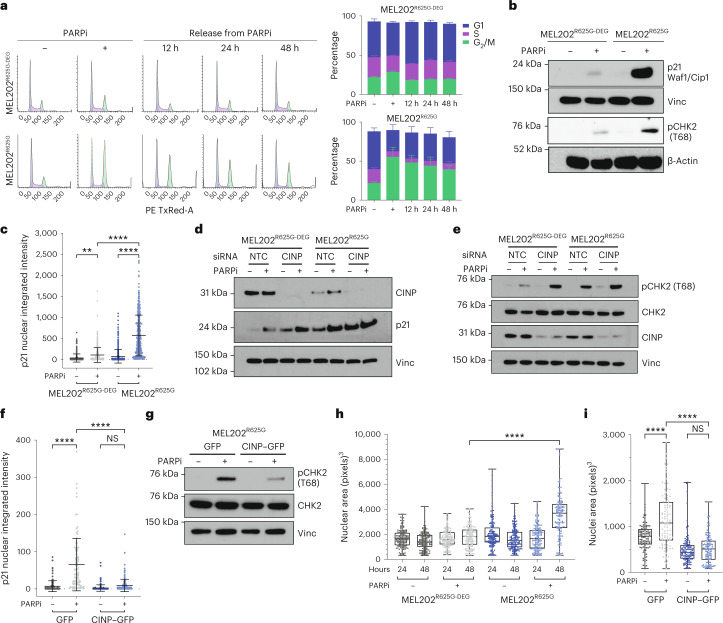
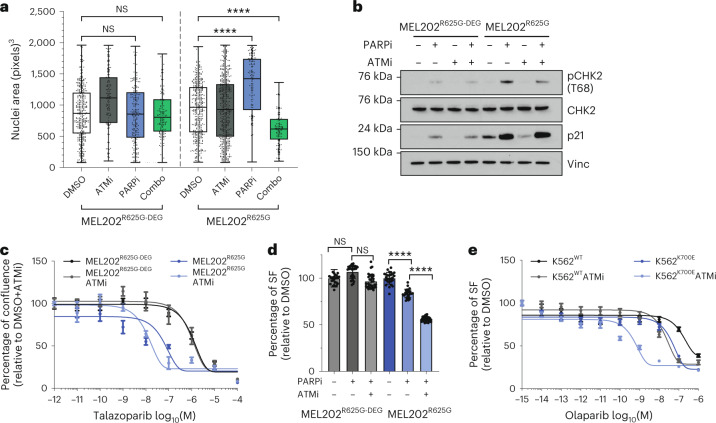
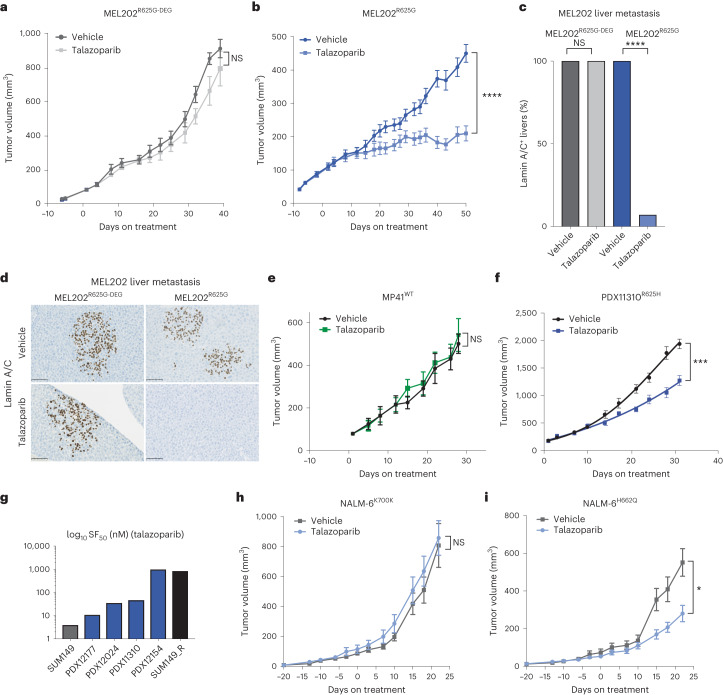
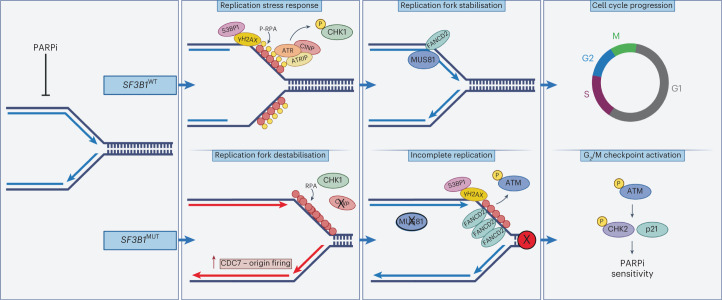
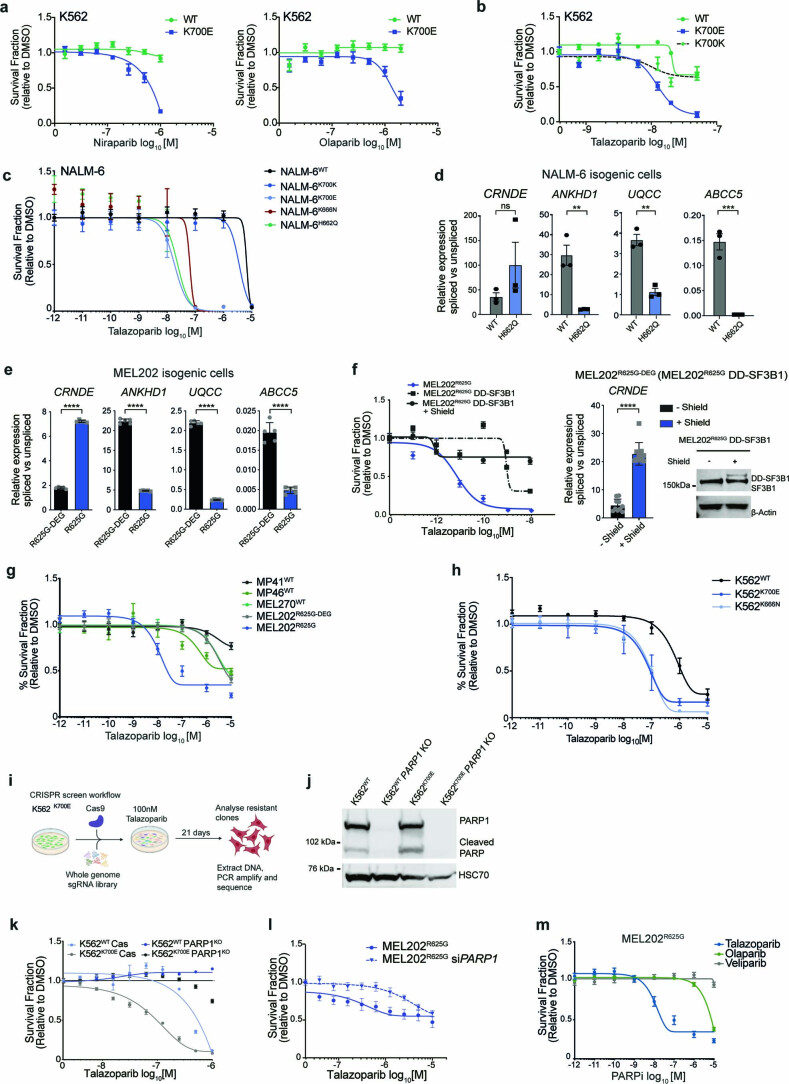
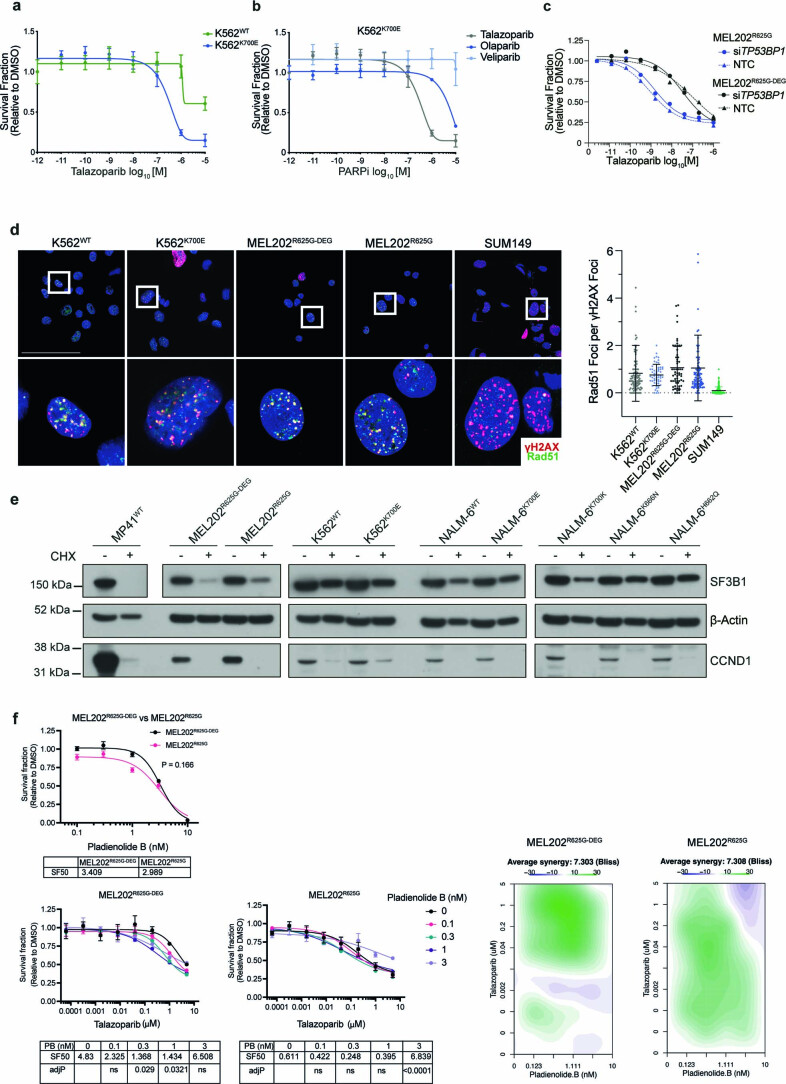
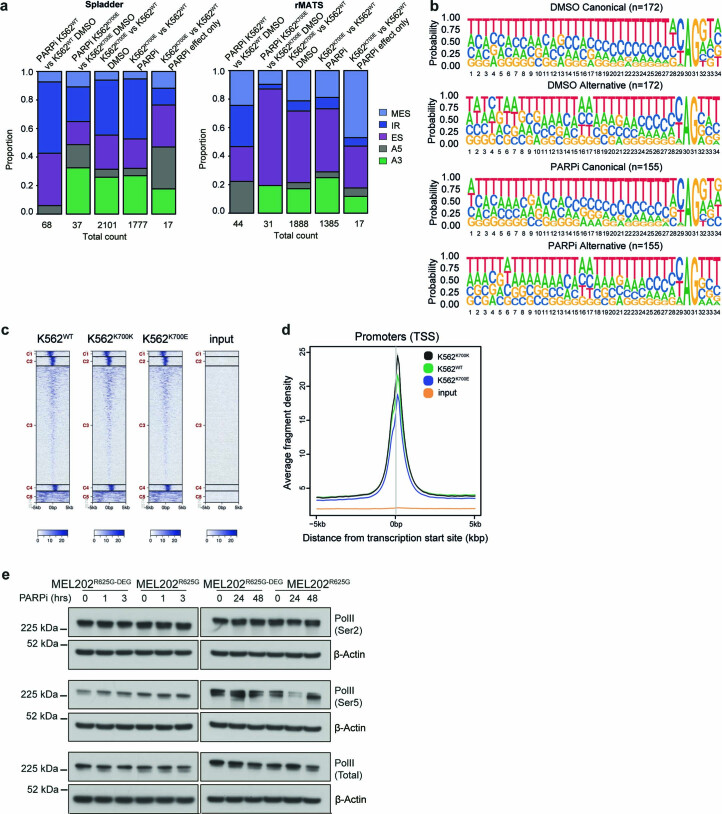
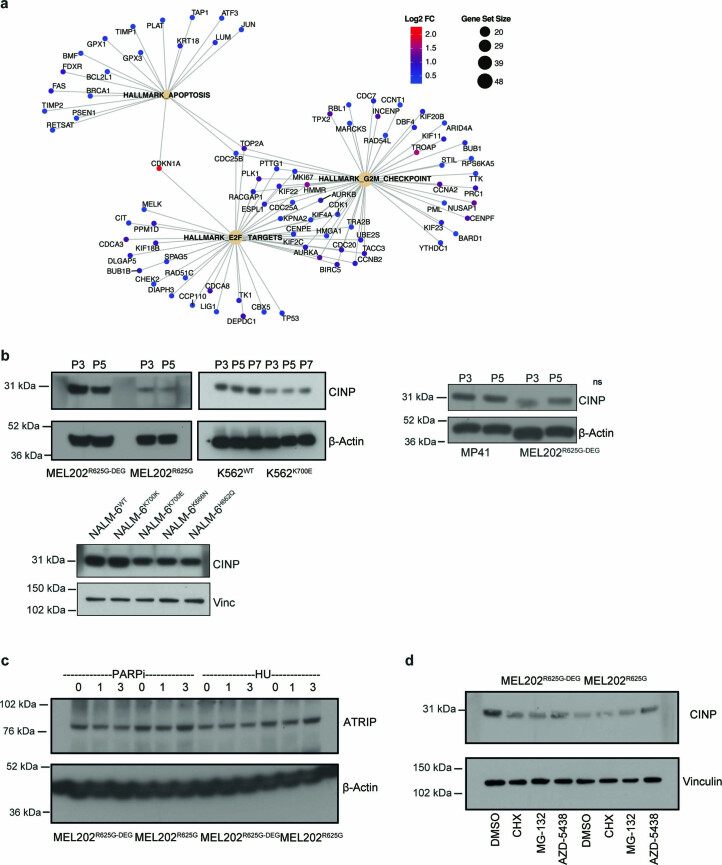
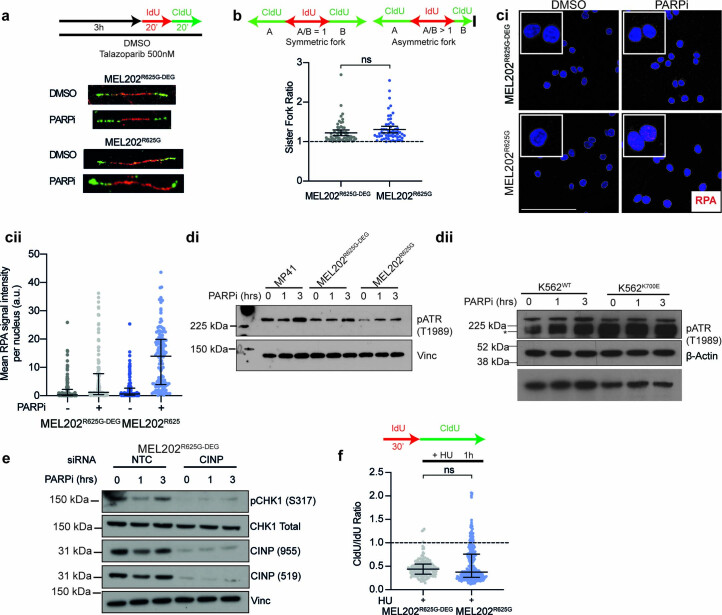
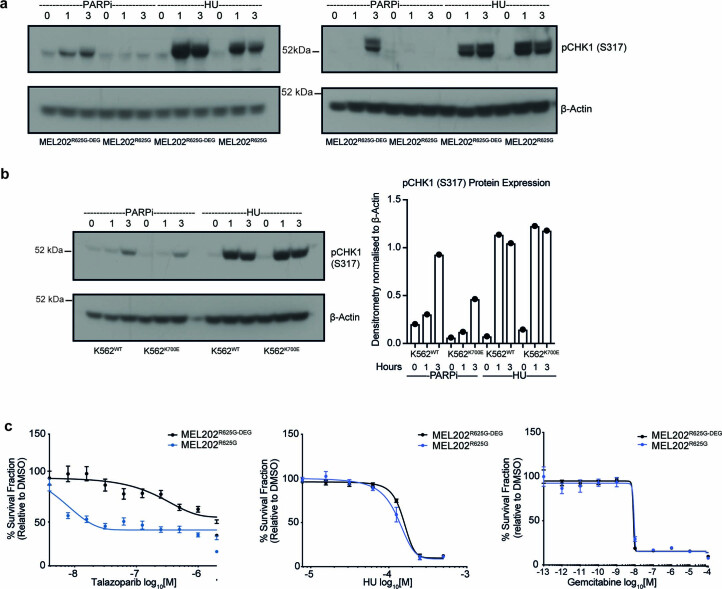
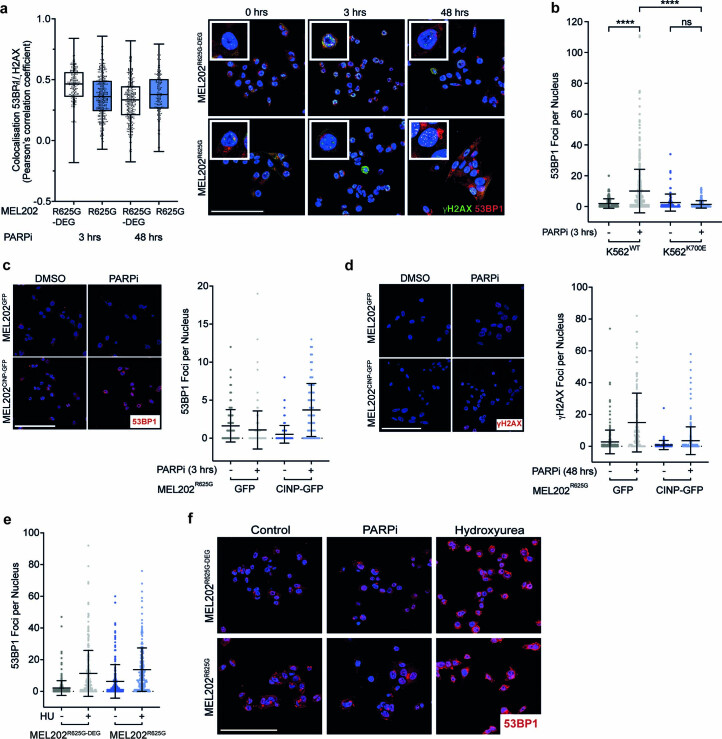
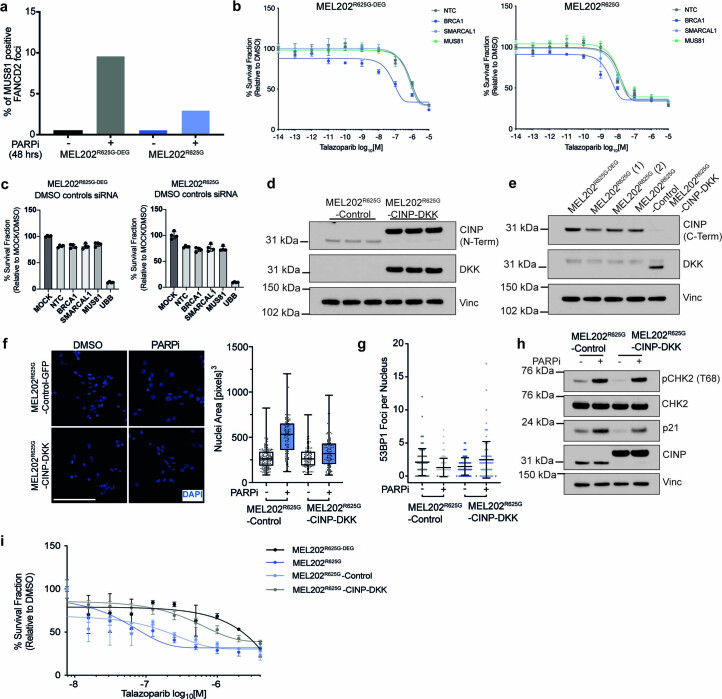
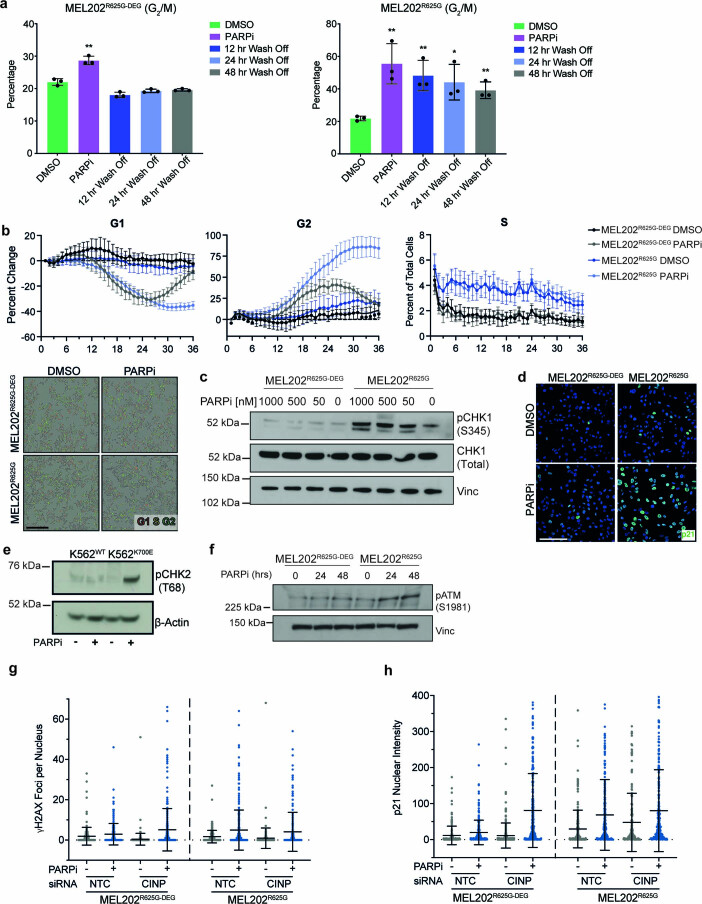
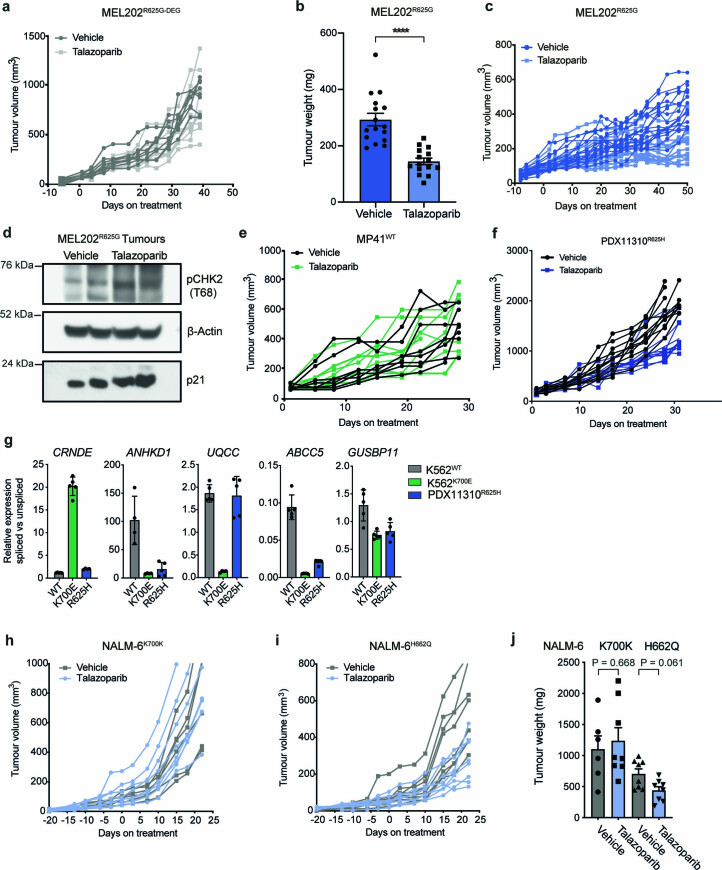
SF3B1 hotspot mutations are associated with a poor prognosis in several tumor types and lead to global disruption of canonical splicing. Through synthetic lethal drug screens, we identify that SF3B1 mutant (SF3B1MUT) cells are selectively sensitive to poly (ADP-ribose) polymerase inhibitors (PARPi), independent of hotspot mutation and tumor site. SF3B1MUT cells display a defective response to PARPi-induced replication stress that occurs via downregulation of the cyclin-dependent kinase 2 interacting protein (CINP), leading to increased replication fork origin firing and loss of phosphorylated CHK1 (pCHK1; S317) induction. This results in subsequent failure to resolve DNA replication intermediates and G2/M cell cycle arrest. These defects are rescued through CINP overexpression, or further targeted by a combination of ataxia-telangiectasia mutated and PARP inhibition. In vivo, PARPi produce profound antitumor effects in multiple SF3B1MUT cancer models and eliminate distant metastases. These data provide the rationale for testing the clinical efficacy of PARPi in a biomarker-driven, homologous recombination proficient, patient population.


Conflict of interest statement

W.N. is a named inventor on a patent describing the use of EXD2 inhibitors and stands to gain from their development as part of the ICR ‘Rewards to Inventors’ scheme, and was a consultant for MNM Bioscience. C.J.L. makes the following disclosures: receives and/or has received research funding from AstraZeneca, Merck KGaA, and Artios; received consultancy from SAB membership or honoraria payments from Syncona, Sun Pharma, Gerson Lehrman Group, Merck KGaA, Vertex, AstraZeneca, Tango, 3rd Rock, Ono Pharma, Artios, Abingworth, Tesselate and Dark Blue Therapeutics; has stock in Tango, Ovibio, Enedra Tx., Hysplex and Tesselate. C.J.L. is also a named inventor on patents describing the use of DNA repair inhibitors and stands to gain from their development and use as part of the ICR ‘Rewards to Inventors’ scheme and also reports benefits from this scheme associated with patents for PARPi paid into CJL’s personal account and research accounts at the Institute of Cancer Research. R.N. receives and/or has received academic research funding from Pfizer in the form of the Breast Cancer Now Catalyst academic grant scheme. AstraZeneca partially supported the PiCCLe clinical trial (supplied by Olaparib; this study is published). The remaining authors declare no conflicts of interest.

Figures

Fig. 1
Fig. 1. SF3B1 hotspot mutations lead to PARPi sensitivity in isogenic models.
a, Lollipop plot of the number of SF3B1 mutations in TCGA (pan-cancer cohort and MSK IMPACT clinical sequencing study (n = 21,912). Data from cBioportal. b, qRT–PCR of differentially spliced exons of selected indicator genes in the myeloid leukemia isogenic cell lines (K562) that express wild-type (WT) or mutant (K700E) SF3B1 (n = 3 independent biological replicates). Data are mean ± s.e.m., unpaired two-tailed t-test; CRNDE, P = 0.0003; ANKHD1, P = 0.0036; UQCC, P < 0.0001 and ABCC5, P < 0.0001. c, Schematic of small-molecule inhibitor screening pipeline. d, Volcano plot of compound selectivity from the small-molecule inhibitor library screen in K562 cell lines (−log10 P < 0.01 unpaired two-tailed t-test and surviving fraction (SF) ratio K562 SF3B1K700E/SF3B1WT < 0.6). Blue dots indicate two independent concentrations of the PARPi talazoparib. e, Fourteen-day clonogenic dose–response curves and representative images of K562 isogenic cells harboring the K700E SF3B1 hotspot variant and wild-type cells following exposure with the PARPi talazoparib (scale bar = 4 mm). f, Fourteen-day clonogenic dose–response curves of NALM-6 isogenic cells with the H662Q SF3B1 hotspot variant, K700K silent variant and wild-type cells following exposure with talazoparib and olaparib (n = 3 independent biological replicates, error bars show ± s.e.m.) g, Fourteen-day clonogenic dose–response curves of uveal melanoma MEL202R625G cells with the endogenous R625G SF3B1 hotspot variant, and revertant MEL202R625G-DEG cells following exposure with talazoparib. Data are mean normalized to DMSO control from n = 3 independent biological experiments, error bars show ± s.e.m (eg). h, Waterfall plot of whole-genome CRISPR screen in K562 SF3B1K700E cells, depicting hits (blue) from n = 3 independent biological replicate experiments. Genes known to cause resistance to PARPi in homologous recombination-deficient cells are highlighted. i, Bar plot depicting the SF50 (concentration of drug that allows 50% cell survival) values of K562 SF3B1 wild-type and K700E cells with Cas (control) or CRISPR PARP1KO under talazoparib exposure (n = 3 independent biological repeats). Error bars show mean ± s.e.m. Unpaired two-tailed t-test, Cas9 wild-type versus K700E. *P < 0.05, **P < 0.01, ***P < 0.001, ****P < 0.0001 (b,i). SF, surviving fraction. Source data
Fig. 2
Fig. 2. SF3B1MUT cells show transcriptional dysregulation and the induction of G2/M checkpoint proteins when exposed to PARPi.
a, MA plots highlighting the significantly differentially expressed genes between the highlighted comparisons in the K562 RNA-sequencing data (DMSO K562K700E versus DMSO K562WT changes just due to the SF3B1 mutation and PARPi K562K700E versus PARPi K562WT interaction; changes due to the effect of PARPi only accounting for the genotype-specific effects). Significantly differentially expressed genes are depicted in red (FDR < 0.01, |LFC | > 1). b, Heatmap representing mean-centered, hierarchical clustering of proteins and samples mapping to the ATR pathway from the total-MS/MS. c, Gene set enrichment plot from GSEA analysis of total-MS/MS of MEL202R625G and MEL202R625G-DEG isogenic cell lines after DMSO or 50 nM talazoparib exposure for 48 h. P values shown are FDR corrected. d, Representative micrographs of CINP IHC in SF3B1MUT and SF3B1WT PDX models.Scale bar, 200 μm. e, Box and whiskers plot of the digital quantification of CINP IHC across SF3B1MUT (n = 3) and SF3B1WT (n = 8) PDX models (P = 0.0519, Welch’s unpaired two-tailed t-test). f, Western blot of CINP from SF3B1MUT and SF3B1WT PDX lysates and β-actin loading control. g, Heatmap depicting the distribution of genetic alterations in CLL driver genes: ATM, SF3B1 and TP53 aligned according to time on olaparib treatment. Presence of mutations is highlighted by green shaded boxes. Modified from ref. . h, Western blot of CINP expression in SF3B1WT and SF3B1K700E patients enrolled in the PiCCLe trial collected at baseline and exposed to PARPi for 48 h in vitro before lysis and western blot analysis. P values shown are calculated with chi-square test (d). IHC, immunohistochemistry. Source data
Fig. 3
Fig. 3. SF3B1MUT cells elicit a defective replication stress response following PARPi exposure.
a, Experimental setup of fiber assay. Cells were pre-incubated with 500 nM talazoparib for 3 h, followed by sequential labeling with 25 μM IdU (red) and 125 μM CldU (green). Representative immunofluorescence images of individual fibers highlighting the differences in tract length. b, Bar plot showing percentage of newly firing origins from IdU and CldU labeled DNA fibers after 3 h 500 nM talazoparib or DMSO or combination 500 nM talazoparib and 20 μM CDC7i XL413. A minimum of 400 replication structures were scored across n = 3 biologically independent experiments and the percentage of origins was calculated in each of the replicate experiments. ***P = 0.0005 and ***P = 0.0002 (left to right), unpaired two-tailed t-test. c, Scatterplot of fork speed (tract length). d, Schematic of scoring and scatterplot of sister fork ratio. Fork symmetry was analyzed by calculating the ratio of the leftward and rightward tracts emanating by sister forks emerging from the same replication origin; A/B ratio >1 indicates fork asymmetry and increased fork stalling. Data are mean of n = 3 biological replicates, error bars show ±s.e.m. P value determined by unpaired two-tailed t-test. e, Western blot of CHK1 phosphorylation at serine 317 (pCHK1 (S317)), and total CHK1 expression in MEL202 isogenic cells, after 0, 1 and 3 h of 500 nM talazoparib exposure. Images are representative of n = 3 biological replicates. f, Representative immunofluorescence images (left) and scatterplot (right) of pRPA32 (S33) foci in MEL202 isogenic cells following 3 h of 500 nM talazoparib or DMSO exposure. Data are from n = 2 biological replicates, error bars show ± s.d. of foci in individual nuclei. Scale bar, 50 μm P values determined by unpaired two-tailed t-test. ***P < 0.001, ****P < 0.0001.  NS, not significant. Source data
Fig. 4
Fig. 4. A defective replication stress response leads to PARPi sensitivity in SF3B1MUT cells.
a, Western blot of pCHK1 (S317), total CHK1 and CINP expression in MEL202R625G-DEG cells after non-targeting control (NTC) or CINP siRNA-mediated gene silencing, with 0, 1 or 3 h of 500 nM talazoparib exposure. Images are representative of n = 3 biological replicates. b, Talazoparib dose–response curves showing the SF, relative to DMSO, of MEL202 isogenic cells after NTC or CINP siRNA-mediated gene silencing. Data are mean of three replicates, error bars show ±s.e.m. c, Western blot of pCHK1 (S317) and total CHK1 expression in MEL202R625G cells expressing control–GFP or CINP–GFP, following 0, 1 and 3 h of 500 nM talazoparib exposure. Images are representative of two biological replicates. d, Talazoparib dose–response curves showing the SF, relative to DMSO, of MEL202 isogenic cells, and MEL202R625G cells expressing control–GFP or CINP–GFP. Data are mean of n = 3 biological replicates, error bars show ±s.e.m. e,f, Scatterplots showing the number of 53BP1 (e) and γH2AX (f) foci per nucleus in MEL202 isogenic cells after 0, 3 h (500 nM) and 48 h (50 nM) talazoparib exposure. Data are representative of n = 3 biological replicates, error bars show ±s.d. g,h, Representative immunofluorescence images (g) of FANCD2 and MUS81 foci and scatterplot of FANCD2 foci (h) in MEL202 isogenic cells after 48 h DMSO or (50 nM) talazoparib exposure. Scale bar, 100 μm. Data are representative of n = 3 biological replicates, error bars show ±s.d. of individual nuclei assessed. P values are calculated by one-way ANOVA (e, f and h), ****P < 0.0001. NTC, nontargeting control; NS, not significant. Source data
Fig. 5
Fig. 5. PARP inhibition leads to G2/M checkpoint stalling in SF3B1MUT cells.
a, Flow cytometry histograms of propidium iodide staining and stacked bar plots, showing the cell cycle profile of MEL202 isogenic cells after 48 h of 50 nM talazoparib exposure, and 12, 24 and 48 h after subsequent talazoparib removal. Data are mean of n = 3 biological replicates, error bars show ±s.e.m. b, Western blot of p21Waf1/Cip1 and CHK2 phosphorylation (threonine68 (pCHK2 (T68)) in MEL202 isogenic cells after 48 h of 50 nM talazoparib or DMSO exposure. Images are representative of n = 3 biological replicates. c, Scatterplot quantification of nuclear intensity of p21 in MEL202 isogenic cells after 48 h of 50 nM talazoparib or DMSO exposure. Data representative of n = 4 biological replicates, error bars show ±s.d. **P = 0.0021, ****P < 0.0001, one-way ANOVA. d, Western blot showing expression of CINP and p21 in MEL202 isogenic cells after NTC or CINP gene silencing 48 h after 50 nM talazoparib exposure. Data are representative of n = 2 biological replicates. e, Western blot of pCHK2 (T68) and CINP expression in MEL202 isogenic cells after NTC or CINP gene silencing and 48 h of 50 nM talazoparib or DMSO exposure. Images are representative of n = 3 biological replicates. f, Scatterplot showing the nuclear intensity of p21 in MEL202R625G cells expressing control–GFP or CINP–GFP, after 48 h of 50 nM talazoparib or DMSO exposure. Data are representative of n = 2 biological replicates, error bars show ±s.d. ****P < 0.0001, one-way ANOVA. g, Western blot of pCHK2 (T68) and total CHK2 expression in MEL202R625G cells expressing control–GFP or CINP–GFP, after 48 h of 50 nM talazoparib or DMSO exposure. Images are representative of n = 2 biological replicates. h, Box and whiskers plot showing nuclear area of MEL202 isogenic cells after 24 h and 48 h of 50 nM talazoparib or DMSO exposure. Data are mean of three biological replicates, error bars show ±s.e.m. i, Box and whiskers plot depicting nuclear area of MEL202R625G cells expressing control–GFP or CINP–GFP, after 48 h of 50 nM talazoparib or DMSO exposure. Data are mean of n = 3 biological replicates, error bars show minimum to maximum nuclear area. ****P < 0.0001, one-way ANOVA (h and i). Source data
Fig. 6
Fig. 6. PARPi and ATMi combination treatment lower the G2/M checkpoint.
a,b, Box and whiskers plot showing nuclear area (a), and western blot of pCHK2 (T68), total CHK2 and p21 expression in MEL202 isogenic cells after 48 h of exposure with 400 nM ATMi (KU-55933), 50 nM talazoparib, combination exposure or DMSO (b). n = 3 independent biological replicates, error bars show minimum to maximum nuclear area. ****P < 0.0001, one-way ANOVA. c, Talazoparib dose–response curves of MEL202 isogenic cells treated with DMSO or ATMi KU-55933. Data are mean of n = 3 biological replicates, error bars show ±s.e.m. d, Column bar graph showing the relative survival of MEL202 isogenic cells after days of exposure with 50 nM talazoparib, combination with ATMi AZD0156 or DMSO. Data are mean of n = 3 biological replicates, error bars show ±s.e.m. e, Dose–response curves of K562 isogenic cells exposed to olaparib in combination with DMSO or ATMi AZD0156. Data are mean of n = 3 replicates, error bars show ±s.e.m. ****P < 0.0001, unpaired two-tailed t-test. Source data
Fig. 7
Fig. 7. PARP inhibition suppresses SF3B1MUT tumor growth and metastasis in vivo.
a, Chart depicting tumor volume of the therapeutic response to talazoparib treatment in NSG-nude mice bearing MEL202R625G-DEG xenograft tumors over time (0.33 mg kg−1). Day 0 represents the first day of treatment. Tumors, vehicle n = 8, talazoparib n = 9. NS, P = 0.1825, two-way ANOVA. b, Chart depicting tumor volume of the therapeutic response to talazoparib treatment in NSG-nude mice bearing SF3B1MUT MEL202R625G xenograft tumors over time, (0.33 mg kg−1). Day 0 represents the first day of treatment. Tumors, vehicle n = 16, talazoparib n = 15. ****P < 0.0001, two-way ANOVA. c, Bar plot of number of mice with or without human lamin A/C positive cells in liver sections, representing liver metastasis of all MEL202R625G-DEG and MEL202R625G subcutaneous tumors under talazoparib treatment. ****P < 0.0001, unpaired two-tailed t-test. d, Representative images of immunohistochemical assay of mouse livers from the MEL202R625G-DEG and MEL202R625G cells grown in vivo. Scale bar, 100 μm. e,f, Chart depicting tumor volume of the therapeutic response to talazoparib treatment in NSG-nude mice bearing SF3B1WT and SF3B1MUT patient-derived xenograft tumors MP41WT (e) and PDX11310R625H (f) over time, (0.33 mg kg−1). Day 0 represents the first day of treatment. MP41WT tumors, vehicle n = 9, talazoparib n = 9. NS, P = 0.6536, two-way ANOVA. PDX11310R625H tumors, vehicle n = 10, talazoparib n = 10. ***P = 0.0005, two-way ANOVA. g, Bar plot of SF50 concentrations of talazoparib efficacy in a series of SF3B1MUT patient-derived organoids (R625C (PDX12177, PDX12024 and PDX12154), R625H (PDX11310) grown ex vivo. Three-dimensional cultures of the BRCA1MUT SUM149 and revertant SUM149 cell lines were used as controls of PARPi sensitivity, respectively. Data are mean of n = 1 biological replicate and n = 6 technical replicates, error bars show ±s.e.m. h,i, Growth charts depicting tumor volume of the therapeutic response to talazoparib treatment of NALM-6K700K SF3B1WT tumors and NALM-6H662Q SF3B1MUT tumors over time in CB-17 mice (0.33 mg kg−1). NALM-6K700K SF3B1WT tumors, vehicle n = 6, talazoparib n = 8. NS, P = 0.4356, two-way ANOVA. NALM-6H662Q SF3B1MUT tumors, vehicle n = 8, talazoparib n = 8. *P = 0.0388, two-way ANOVA. Source data
Fig. 8
Fig. 8. Graphical schematic of the mechanism of PARPi sensitivity in SF3B1MUT cells.
When exposed to PARPi, SF3B1MUT cells show an impaired replication stress response (lack of pCHK1 (S317), pATR and pRPA32) due to reduced CINP protein expression. This leads to increased origin firing, unchecked fork progression and unresolved replication intermediates via the lack of MUS81-positive FANCD2 foci. This results in ATM activation and the induction of pCHK2 (T68), stalling SF3B1MUT cells at the G2/M checkpoint.
Extended Data Fig. 1
Extended Data Fig. 1. SF3B1 hotspot mutations induce mis-splicing and PARPi sensitivity.
a, b, 14 day clonogenic dose–response curves of K562 SF3B1WT, SF3B1K700K (silent mutation) and SF3B1K700E isogenic cells following exposure with distinct PARP inhibitors. Data are mean ± s.e.m, (n = 3 independent biological replicates). c, 14 day (3D viability) talazoparib dose–response curves of NALM6WT, NALM6K700K and SF3B1MUT NALM6K700E, NALM6K666N and NALM6H662Q cell lines grown as spheroids. Data are mean ± s.e.m, (n = 3 independent biological replicates). d, Representative qRT-PCR of differentially spliced exons of indicator genes in the NALM-6WT and NALM-6H662Q isogenic lines. Data are mean of n = 3 biological replicates, ± s.d. (unpaired two-tailed t-test (NS P = 0.2426, **P = 0.0058, **P = 0.0015, ***P = 0.0009)). e, Representative qRT-PCR of differentially spliced exons of indicator genes in the MEL202R625G-DEG and MEL202R625G cells. Data are mean of n = 5 biological replicates, ± s.d. (unpaired two-tailed t-test (****P < 0.0001)). f, 14 day clonogenic dose–response for the isogenic MEL202R625G-DEG and MEL202R625G cells exposed to talazoparib and revertant MEL202R625G-DEG cells labeled with a degron tag (MEL202R625G DD-SF3B1) +/- Shield-1 compound to stabilize expression of the mutant allele. Data are normalized to DMSO control and presented as mean ± s.e.m. (n = 3 biological replicates). qRT-PCR of differentially spliced exon of CRNDE in the MEL202R625G-DEG +/- shield compound (n = 3 biological replicates, ****P < 0.0001, unpaired two-tail t-test). Western blot analysis of MEL202R625G-DEG (MEL202R625G DD-SF3B1) showing protectable mutant allele upon shield compound treatment. g, 5-day viability dose–response curves of wild-type uveal melanoma cell lines MP41, MP46, MEL270 and MEL202. Data are mean ± s.e.m. (n = 3 biological replicates). h, 14 day (3D viability) dose–response curves of K562WT, K562K700E and K562K666N spheroids exposed to talazoparib. Data are mean ± s.d. (n = 3 independent biological replicates). i, Schematic of CRISPR screen workflow. j, Western blot of PARP1, cleaved PARP1 and HSC70 in K562WT and K562K700E cells with Cas or PARP1 KO. k-l, Talazoparib dose-response curves showing the survival fraction of K562 isogenic cells +/- PARP1 CRISPR knockout (KO) (k), MEL202R625G cells +/- PARPi siRNA (l). Data are mean of n = 3 biological replicates, ± s.e.m. m, 5 day dose–response curve of MEL202R625G cells exposed to talazoparib, olaparib and veliparib. Data are mean ± s.e.m. (n = 3 biological replicates). Source data
Extended Data Fig. 2
Extended Data Fig. 2. SF3B1 hotspot mutations induce PARPi sensitivity.
a, 5 day dose–response curve of K562WT and K562K700E cells treated with talazoparib (n = 3 biological replicates). Data are presented as mean ± s.e.m. b, 5 day dose–response curve of K562R625G cells exposed to talazoparib, olaparib and veliparib indicating sensitivity to more potent PARP trapping agents. (n = 3 biological replicates). Data are presented as mean ± s.e.m. c, 5 day dose–response curve of MEL202R625G cells exposed to talazoparib MEL202 isogenic cells +/- TP53BP1 siRNA gene silencing. Data are presented as mean ± s.e.m. (n = 3 technical replicates). d, Representative immunofluorescence images and corresponding scatter plot graph showing the number of RAD51 foci per γH2AX foci in K562 and MEL202 isogenic cell lines and SUM149 BRCA1MUT cells after 10 Gy irradiation. Data are presented as mean ± s.e.m. (n = 1 biological replicate). e, Western blot of SF3B1 protein expression in UM MP41WT cells, MEL202, K562 and NALM-6 isogenic cell lines exposed to 50 mg/ml cycloheximide (CHX) for 48 hours. CCND1 is used as a control for protein degradation, due to a relative short half-life. f, Dose–response curves of MEL202R625G-DEG and MEL202R625G cells exposed to Pladienolide B as single agent (a) or in combination with talazoparib (b). SF50 values of combinations at different Pladienolide B concentrations are shown. Data are presented as mean, ± s.d. of n = 3 technical replicates. (c) Heatmaps showing BLISS synergy scores based on the survival fraction, relative to DMSO, of MEL202 isogenic cells after 5 days of exposure to talazoparib in combination with Pladienolide B. P values from one way ANOVA with Tukey’s multiple comparison test. Source data
Extended Data Fig. 3
Extended Data Fig. 3. SF3B1 mutant cells show transcriptional dysregulation following PARPi exposure.
a, Frequency plot of proportion of PSI events of aberrant splicing calculated from total RNA-sequencing (n = 3 biological replicates) of K562WT versus K562K700E, with and without PARPi (a, Spladder and b, rMATS). Multiple skipped exons (MES), retained intron (IR), skipped exon (ES), alternative 5’ splice site (A5) and alternative 3’ splice site (A3) events with an FDR < 0.1. b, Splice site motif analysis of aberrant A3 events depicting canonical and alternative branch point usage in K562K700E versus K562WT cells +/- talazoparib detected from total RNA sequencing. AG represents the 3’ss and the upstream adenines (A) represent the branch points. Related to Fig. 2a. c, Heatmap depicting the distribution of the overall binding of RNA Pol II in K562WT, K562K700K control and K562K700E cells. d, Frequency plot of RNA Pol II binding at transcription start sites in the K562WT, K562K700K control and K562K700E cells. (n = 1 biological replicate). e, Western blot of Ser5 (initiation), Ser2 (elongation) and total RNA Pol II in MEL202R625G-DEG and MEL202R625G cells exposed to short term (0, 1, 3 hours) and long term (0, 24 and 48 hours) talazoparib alongside β-Actin loading control (n = 1 biological replicate). Source data
Extended Data Fig. 4
Extended Data Fig. 4. G2/M checkpoint protein expression in SF3B1 mutant cells under PARPi.
a, Schematic showing the log2FC of protein expression in the gene sets ‘HALLMARK_APOPTOSIS’, ‘HALLMARK_E2F_TARGETS’, and ‘HALLMARK_G2M_CHECKPOINT’, and the overlapping genes in these gene sets. Data taken from the total-MS (mass spectrometry) in Fig. 2d. b, Western blot of CINP and β-Actin loading control in MEL202, K562 and NALM-6 SF3B1WT and SF3B1MUT isogenic cell line pairs under different cell passages (‘P’). c, Western blot of total ATRIP and β-Actin loading control in MEL202, SF3B1WT and SF3B1MUT isogenic cell lines +/- PARPi talazoparib or hydroxyurea (HU) for indicated times (hours) (n = 1 biological replicate). d, Western blot of CINP expression in MEL202R625G-DEG and MEL202R625G cells and vinculin loading control after 6 hours exposure to DMSO, cycloheximide (CHX, 10 μM), MG-132 (20 μM) and AZD-5438 (5 μM) (CDK2i) (n = 1 biological replicates). Source data
Extended Data Fig. 5
Extended Data Fig. 5. SF3B1 mutant cells elicit a defective RS response under PARPi.
a, Experimental set up of fiber assay and representative immunofluorescence images of IdU and CldU labeled DNA fibers after 3 hours 500 nM talazoparib or DMSO exposure. b, Schematic of analysis and scatterplot of quantification of sister fork ratio taken from DNA fiber analysis of MEL202 isogenic cells exposed to DMSO. Data are mean of n = 3 biological replicates, error bars show ± s.e.m. (unpaired two-tailed t-test (NS P = 0.1337)). c, Representative immunofluorescence images (ci) and scatterplot (cii) of RPA foci in MEL202 isogenic cells following 3 hours of 500 nM talazoparib or DMSO exposure. Data are from n = 2 biological replicates, error bars show ± s.d. of foci in individual nuclei. Scale bar = 100 μm. d, Western blot of pATR (T1989) in MP41WT and MEL202 isogenic cells (di) and K562 isogenic cells (dii) at 0, 1, or 3 hours of 500 nM talazoparib exposure. e, Western blot of pCHK1 (S317), total CHK1, and CINP expression using two different CINP antibodies in MEL202R625G-DEG cells after non-targeting control (NTC) or CINP siRNA gene mediated silencing, at 0, 1, or 3 hours of 500 nM talazoparib exposure (n = 1 biological replicate). f, Scatterplot of CldU/IdU ratio taken from DNA fiber analysis of MEL202 isogenic cells exposed to 100 μM hydroxyurea (HU). Data are mean of n = 3 biological replicates, error bars show ± s.e.m. (unpaired two-tailed t-test (NS P = 0.458). Source data
Extended Data Fig. 6
Extended Data Fig. 6. SF3B1 mutant cells elicit a replication stress response upon hydroxyurea exposure.
a, b, Western blots of pCHK1 (S317) expression in MEL202 isogenic (a) and K562 isogenic cells (b) after 0, 1, and 3 hours of 500 nM talazoparib or 100 μM hydroxyurea (HU) exposure, and column bar graph showing relative pCHK1 (S317) expression relative to β-Actin loading control. Images are representative of n = 2 biological replicates. c, Talazoparib, HU, and gemcitabine dose-response curves showing the survival fraction, relative to DMSO, of MEL202 isogenic cells. Data are mean of at least n = 2 biological replicates, error bars show ± s.d. Source data
Extended Data Fig. 7
Extended Data Fig. 7. SF3B1 mutant cells have a defective replication stress regulatory response upon PARPi exposure.
a, Box and whiskers plot and representative images showing the colocalization of 53BP1 and γH2AX in MEL202 isogenic cells after 3 hours of 500 nM, or 48 hours of 50 nM, talazoparib exposure. Colocalization based on the Pearson’s correlation coefficient of the 53BP1 and γH2AX fluorescence intensity per nuclei (n > 220 cells from n = 1 biological replicate) Scale bar = 100 μm, error bars show ± s.d. b, Scatterplot showing the number of 53BP1 foci per nucleus in K562 isogenic cells after 3 hours of 500 nM talazoparib or DMSO exposure. Data are mean of n = 3 biological replicates, error bars show ± s.d. (unpaired two-tailed t-test (****P < 0.0001, NS P = 0.238)). c-d, Representative immunofluorescence images and scatter plot quantification of 53BP1 (c) and γH2AX (d) foci in MEL202R625G cells expressing control-GFP or CINP-GFP, treated with 3 hours of 500 nM (c) (n = >205 cells from n = 2 independent biological replicates) or 48 hours of 50 nM talazoparib (d) (n = >126 cells from n = 1 biological replicate). Error bars show ± s.d. e-f, Scatter plot quantification and representative immunofluorescence images of 53BP1 foci in MEL202 isogenic cells after 100 μM HU (n > 214 cells from n = 1 biological replicate), or DMSO exposure. Error bars show ± s.e.m, 500 nM talazoparib (n > 215 cells from n = 3 independent biological replicates). Source data
Extended Data Fig. 8
Extended Data Fig. 8. SF3B1 mutant cells fail to resolve replication intermediates under PARPi exposure.
a, Bar plot showing percentage of MUS81 positive FANCD2 foci in MEL202 isogenic cells after 48 hours of 50 nM talazoparib exposure (n = 3 independent biological replicates). b, Dose–response of talazoparib exposure after NTC, BRCA1, SMARCAL1 and MUS81 mediated gene silencing in MEL202R625G cells normalized to DMSO control (n = 1 biological replicate, error bars are ± s.d. of n = 4 technical replicates). c, Barplot showing cell survival relative to mock transfection of NTC, BRCA1, SMARCAL1 and MUS81 mediated gene silencing of MEL202R625G-DEG and MEL202R625G DMSO exposed cells from (b) (n = 1 biological replicate, error bars are ± s.d. of n = 4 technical replicates). d, Western blot showing CINP (N-terminal) and DKK tag expression in MEL202R625G cells expressing control-GFP or CINP-DKK (n = 1 biological replicate). e, Western blot showing CINP (C-terminal) and DKK tag expression in MEL202 isogenic cells, and MEL202R625G cells expressing control-GFP or CINP-DKK. f, Representative immunofluorescence images and corresponding box and whiskers plot showing the nuclear area of MEL202R625G cells expressing control-GFP or CINP-DKK after 48 hours of 50 nM talazoparib exposure (n = 1 biological replicate, error bars show minimum to maximum nuclear area of n > 125 individual nuclei assessed). Scale bar = 100 μm. g, Scatterplot showing the number of 53BP1 foci per nucleus in in MEL202R625G cells expressing control-GFP or CINP-DKK after 3 hours of 500 nM talazoparib or DMSO exposure (n = 1 biological replicate, error bars show ± s.d. of n > 81 individual nuclei assessed). h, Western blot showing pCHK2 (T68), total CHK2, p21, and CINP (N-terminal) expression in MEL202R625G cells expressing control-GFP or CINP-GFP, treated with 48 hours of 50 nM talazoparib (n = 1 biological replicate). i, Talazoparib 5-day dose-response curves of MEL202 isogenic cells, and MEL202R625G cells expressing control-GFP or CINP-DKK (n = 1 biological replicate). Data are presented as mean values +/- s.d. of n = 4 technical replicates. Source data
Extended Data Fig. 9
Extended Data Fig. 9. The induction of the G2/M checkpoint in SF3B1 mutant cells.
a, Column bar graphs showing the increase in percentage of MEL202R625G-DEG and MEL202R625G isogenic cells in G2/M phase after 48 hours of 50 nM talazoparib exposure, and 12, 24, and 48 hours after talazoparib removal. Data are mean of n = 3 biological replicates, error bars show ± s.e.m. (unpaired two-tailed t-test (MEL202R625G-DEG **P = 0.0022 and MEL202R625G **P = 0.0094, **P = 0.0084, *P = 0.0249, **P = 0.0049)). b, Time-course assessment of the proportion of MEL202R625G-DEG and MEL202R625G cells in each of G1 (red) and G2 (green) phase of the cell cycle over 36 hours treated with DMSO or 50 nM talazoparib plotted relative to time 0. S phase is determined by spectral overlap (red and green) and is plotted as percent of total number of cells. Representative micrographs at 36 hours are shown. Data is representative of n = 2 biological replicates (Scale bar = 400 μm). c, Western blot of pCHK1 (S345) and total CHK1 expression in MEL202R625G-DEG and MEL202 isogenic cells after 48 hours of 1000 nM, 500 nM, 50 nM, or 0 nM talazoparib exposure. d, Representative immunofluorescence images to corresponding Fig. 5c showing the nuclear intensity of p21 in MEL202R625G cells, after 48 hours of 50 nM talazoparib or DMSO exposure. e, Western blot of pCHK2 (T68) expression in K562 isogenic cells after 48 hours of 50 nM talazoparib or DMSO exposure. Data are representative of n = 2 biological replicates. f, Western blot of pATM (S1981) expression in MEL202 isogenic cells after 24 or 48 hours of 50 nM talazoparib or DMSO exposure. Images are representative of two biological replicates. g-h, Scatter plot quantification of γH2AX (g) and p21 (h) in MEL202 isogenic cells after NTC or CINP gene silencing after 48 hours 50 nM talazoparib exposure. Data are of n = 1 biological replicate, error bars show ± s.d. Source data
Extended Data Fig. 10
Extended Data Fig. 10. PARPi suppresses SF3B1 mutant tumor growth in vivo.
a, Chart depicting individual tumor volumes of the therapeutic response to talazoparib treatment in NSG-Nude mice bearing MEL202R625G-DEG xenograft tumors over time, (0.33 mg/kg). Day 0 represents the first day of treatment, (Fig. 5a). b, Bar plot of tumor weights from MEL202R625G subcutaneous tumors under treatment. At the experimental end-point, tumors were resected and weighed ex vivo (unpaired two-tailed t-test, ****P < 0.0001). c, Chart depicting individual tumor volumes of the therapeutic response to talazoparib treatment in NSG-Nude mice bearing SF3B1 mutant MEL202R625G xenograft tumors over time, (0.33 mg/kg). Day 0 represents the first day of treatment, (Fig. 5b). d, Western blot of CHK2 phosphorylation at threonine 68 (pCHK2 (T68)) in two MEL202R625G xenograft tumors at end-point treatment with either vehicle control or talazoparib. e, f, Charts depicting individual tumor volumes of the therapeutic response to talazoparib treatment in NOD-SCID mice bearing SF3B1WT PDX MP41 (e) and SF3B1R625H PDX11310 patient derived xenograft (f) tumors over time, (0.33 mg/kg). Day 0 represents the first day of treatment. g, qRT-PCR of differentially spliced exons of indicator genes in the PDX11310 in vivo model. Data are mean of n = 3 biological replicates, error bars show ± s.e.m. h, i, Charts depicting individual tumor volumes of the therapeutic response to talazoparib treatment in CB-17 mice bearing the SF3B1MUT NALM6H662Q (i) and NALM6K700K (h) leukemia xenograft tumors over time, (0.33 mg/kg). Day 0 represents the first day of treatment. j, Bar plot of tumor weights from NALM-6 subcutaneous tumors under treatment, at the experimental end-point, tumors weighed ex vivo. P values shown are calculated using an unpaired two-tailed t-test. Source data

References

    1. Darman RB, et al. Cancer-associated SF3B1 hotspot mutations induce cryptic 3′ splice site selection through use of a different branch point. Cell Rep. 2015;13:1033–1045. doi: 10.1016/j.celrep.2015.09.053. - DOI - PubMed
    1. Seiler M, et al. Somatic mutational landscape of splicing factor genes and their functional consequences across 33 cancer types. Cell Rep. 2018;23:282–296. doi: 10.1016/j.celrep.2018.01.088. - DOI - PMC - PubMed
    1. Armenia J, et al. The long tail of oncogenic drivers in prostate cancer. Nat. Genet. 2018;50:645–651. doi: 10.1038/s41588-018-0078-z. - DOI - PMC - PubMed
    1. Biankin AV, et al. Pancreatic cancer genomes reveal aberrations in axon guidance pathway genes. Nature. 2012;491:399–405. doi: 10.1038/nature11547. - DOI - PMC - PubMed
    1. Harbour JW, et al. Recurrent mutations at codon 625 of the splicing factor SF3B1 in uveal melanoma. Nat. Genet. 2013;45:133–135. doi: 10.1038/ng.2523. - DOI - PMC - PubMed

Publication types

MeSH terms