. 2023 Jul 31;80(8):236.
doi: 10.1007/s00018-023-04893-7.

An impaired splicing program underlies differentiation defects in hSOD1G93A neural progenitor cells

Affiliations

An impaired splicing program underlies differentiation defects in hSOD1G93A neural progenitor cells

Veronica Verdile et al. Cell Mol Life Sci. .

Abstract

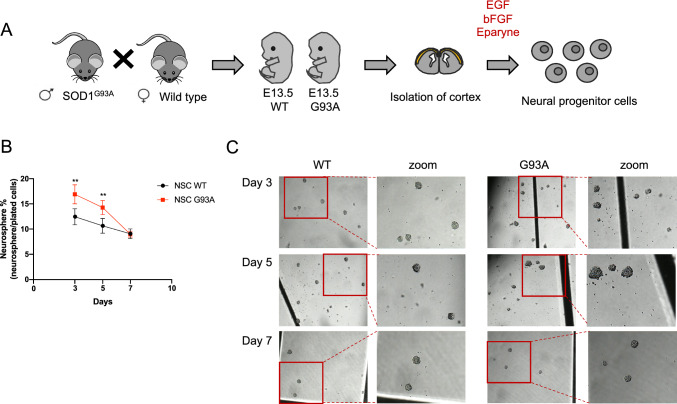
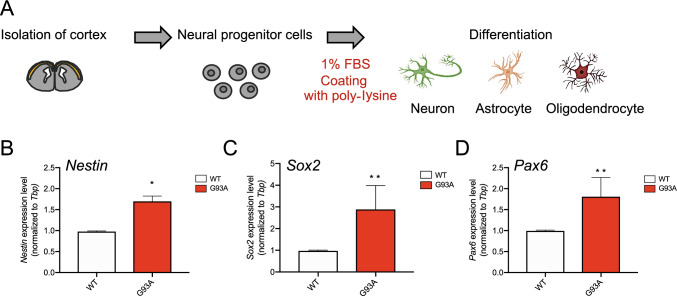
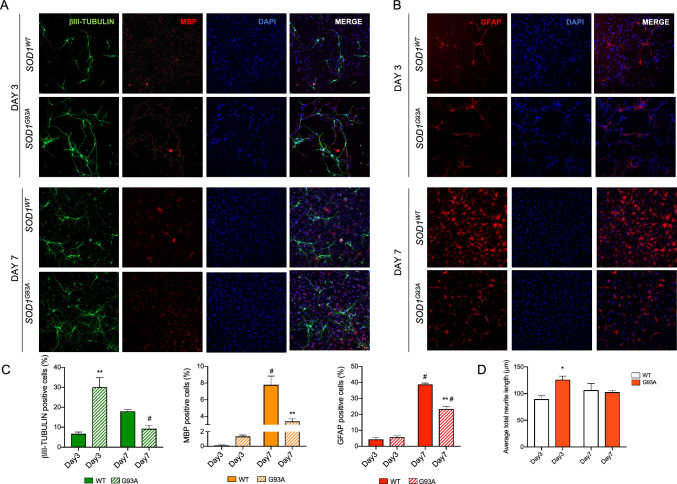
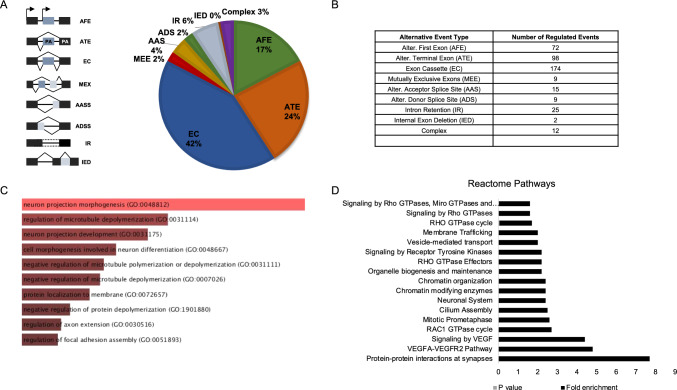
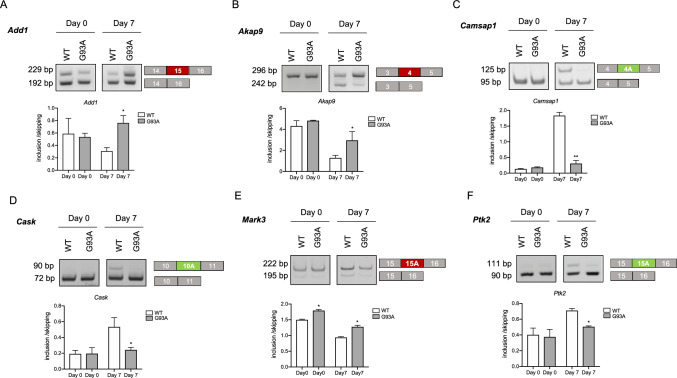
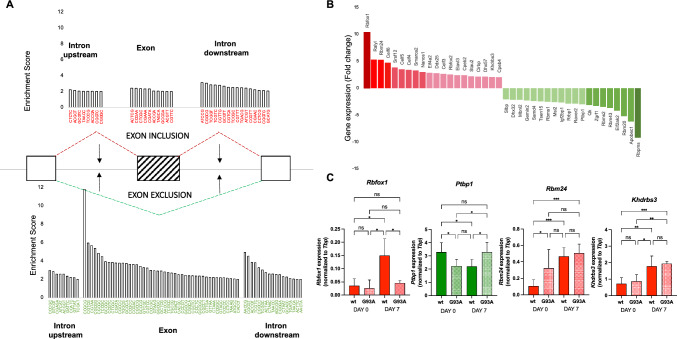
Amyotrophic lateral sclerosis (ALS) is an adult devastating neurodegenerative disease characterized by the loss of upper and lower motor neurons (MNs), resulting in progressive paralysis and death. Genetic animal models of ALS have highlighted dysregulation of synaptic structure and function as a pathogenic feature of ALS-onset and progression. Alternative pre-mRNA splicing (AS), which allows expansion of the coding power of genomes by generating multiple transcript isoforms from each gene, is widely associated with synapse formation and functional specification. Deciphering the link between aberrant splicing regulation and pathogenic features of ALS could pave the ground for novel therapeutic opportunities. Herein, we found that neural progenitor cells (NPCs) derived from the hSOD1G93A mouse model of ALS displayed increased proliferation and propensity to differentiate into neurons. In parallel, hSOD1G93A NPCs showed impaired splicing patterns in synaptic genes, which could contribute to the observed phenotype. Remarkably, master splicing regulators of the switch from stemness to neural differentiation are de-regulated in hSOD1G93A NPCs, thus impacting the differentiation program. Our data indicate that hSOD1G93A mutation impacts on neurogenesis by increasing the NPC pool in the developing mouse cortex and affecting their intrinsic properties, through the establishment of a specific splicing program.

Keywords: ALS; Alternative splicing; Neural progenitor cells.


Conflict of interest statement

The authors have no relevant financial or non-financial interests to disclose.

Figures

Fig. 1
Fig. 1
hSOD1G93A neural progenitor cells (NPCs) display an initial boost of clonogenicity. A Representative scheme of the isolation and culture of the neural progenitor cells (NPCs). B Clonogenic assay of NPC SOD1WT and hSOD1G93A. Clonogenicity was expressed as the percentage of the neurospheres obtained from the plated NSC at each passage (n = 4; mean ± SD; **P ≤ 0.01). C Representative bright field images of neurospheres obtained from NPCs hSOD1WT and hSOD1G93A cultured in proliferating condition for 3, 5 and 7 days
Fig. 2
Fig. 2
hSOD1G93A impacts stemness markers in NPCs. A Representative scheme of experimental design to differentiate NPCs. B–D The graphs show the results of RT-qPCR analysis of the stemness markers Nestin, Sox2 and Pax6 in proliferating (day 0) NPCs hSOD1WT and hSOD1G93A, normalized for levels of the housekeeping gene Tbp. Values are the mean ± SD of three independent experiments, considering the hSOD1WT condition as 1. Statistical analysis was performed by Student’s t test, P values: *P ≤ 0.05; ***P ≤ 0.001
Fig. 3
Fig. 3
hSOD1G93A neural progenitor cells display early differentiation. A–B Representative images of hSOD1G93A and hSOD1WT NPCs, cultured for 3 and 7 days in differentiating condition. Scale bar = 50 μm. A Cells were stained with anti-βIII tubulin (green), anti-MBP (red), and DAPI (blue). B Cells were stained with anti-GFAP (red) and DAPI (blue). C Bar graph representing the percentage of βIII-tubulin, MBP- and GFAP-positive cells. Data represent mean ± SD of 3 independent experiments. Statistical analysis was performed by one-way ANOVA, with P value ≤ 0.05, and with Bonferroni post hoc test (P value ≤ 0.05; *comparison within the group, # comparison between groups). D hSOD1G93A affects neuronal differentiation in NPCs. Bar graph represents the average of total neurite length per cell (μm). P values were determined by Student’s t test *P ≤ 0.05 (n = 3; mean ± SD)
Fig. 4
Fig. 4
Alternative splicing shapes neuronal differentiation. A Pie chart representing distribution of regulated splicing events among different splicing patterns in NPCs and neurons obtained by analyzing the GSE96950 dataset. B Table representing the type of alternative splicing event and number of regulated events in NPCs vs neurons. C Bar graph showing the enrichment score of the gene ontology functional clusters enriched in splicing-regulated genes obtained with the EnrichR tool (https://maayanlab.cloud/Enrichr/). D Bar graph represent the enrichment score of Reactome pathways from the splicing-regulated genes
Fig. 5
Fig. 5
hSOD1G93A mutation modulates alternative splicing of synaptic-related genes in NPCs. A–F Representative images of the PCR analyses for the indicated splicing events (Add1, Akap9, Camsap1, Cask, Mark3, Ptk2) differentially regulated between proliferating (day 0) and differentiated (day 7) hSOD1G93A and SOD1 WT NPCs. Schematic representation for each event analyzed is depicted on the right of the representative agarose gel. Red boxes indicate the upregulated exon, green boxes indicate downregulated exon, gray boxes indicate the constitutive exon in hSOD1G93A compared with control cells. The graphs show the densitometric analysis of the ratio between isoforms with included and skipped exons. Statistical analysis was performed by one-way ANOVA with Bonferroni post hoc test (P value: * < 0.05; P value: ** < 0.01)
Fig. 6
Fig. 6
Specific cis-acting elements feature neuron signature. A Schematic representation of predicted RBPs binding cis-acting elements within or nearby (± 250 bp in the surrounding introns) neuron-sensitive cassette exons. The scheme also reports pentamer enrichments within regulated exons. For the conserved and enriched pentamers, see also Supplementary Tables 5, 6. B Expression profile of RBPs from the transcriptome analysis. Bar graphs represent gene expression fold changes of neurons versus NPCs. In red are represented RBPs upregulated at least 2.0 versus control. In green are represented RBPs downregulated at least 2.0 vs control. See also Supplementary Table 4. C The graphs show the results of RT-qPCR analysis of the Rbfox1, Ptbp1, Rbm24 and Khdrbs3 transcripts in proliferating (day 0) and differentiating (day 7) NPCs hSOD1WT and hSOD1G93A normalized for the expression of Tbp housekeeping gene. Values are the mean ± SD of three independent experiments. Statistical analysis was performed by one-way ANOVA with Bonferroni post hoc test. P values: *P ≤ 0.05; **P ≤ 0.01; ***P ≤ 0.001

Similar articles

Cited by

References

    1. Amendola J, Durand J. Morphological differences between wild-type and transgenic superoxide dismutase 1 lumbar motoneurons in postnatal mice. J Comp Neurol. 2008;511:329–341. doi: 10.1002/cne.21818. - DOI - PubMed
    1. Atasoy D, Schoch S, Ho A, Nadasy KA, Liu X, Zhang W, Mukherjee K, Nosyreva ED, Fernandez-Chacon R, Missler M, Kavalali ET, Südhof TC. Deletion of CASK in mice is lethal and impairs synaptic function. Proc Natl Acad Sci USA. 2007;104:2525–2530. doi: 10.1073/pnas.0611003104. - DOI - PMC - PubMed
    1. Avossa D, Grandolfo M, Mazzarol F, Zatta M, Ballerini L. Early signs of motoneuron vulnerability in a disease model system: characterization of transverse slice cultures of spinal cord isolated from embryonic ALS mice. Neuroscience. 2006;138:1179–1194. doi: 10.1016/j.neuroscience.2005.12.009. - DOI - PubMed
    1. Baralle FE, Giudice J. Alternative splicing as a regulator of development and tissue identity. Nat Rev Mol Cell Biol. 2017;18:437–451. doi: 10.1038/nrm.2017.27. - DOI - PMC - PubMed
    1. Barbosa-Morais NL, Irimia M, Pan Q, Xiong HY, Gueroussov S, Lee LJ, Slobodeniuc V, Kutter C, Watt S, Colak R, Kim T, Misquitta-Ali CM, Wilson MD, Kim PM, Odom DT, Frey BJ, Blencowe BJ. The evolutionary landscape of alternative splicing in vertebrate species. Science. 2012;338:1587–1593. doi: 10.1126/science.1230612. - DOI - PubMed

MeSH terms