. 2023 Nov;18(11):1311-1318.
doi: 10.1038/s41565-023-01468-2. Epub 2023 Jul 31.

Isothermal self-assembly of multicomponent and evolutive DNA nanostructures

Affiliations

Isothermal self-assembly of multicomponent and evolutive DNA nanostructures

Caroline Rossi-Gendron et al. Nat Nanotechnol. 2023 Nov.

Abstract

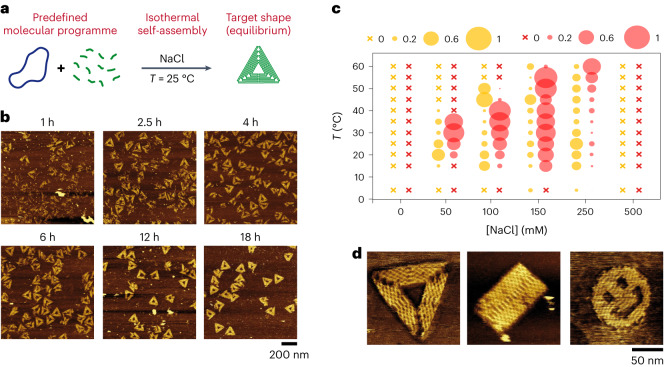
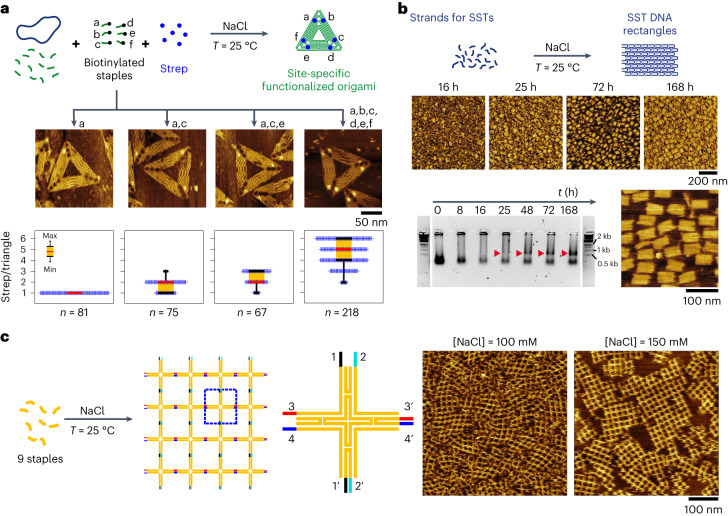
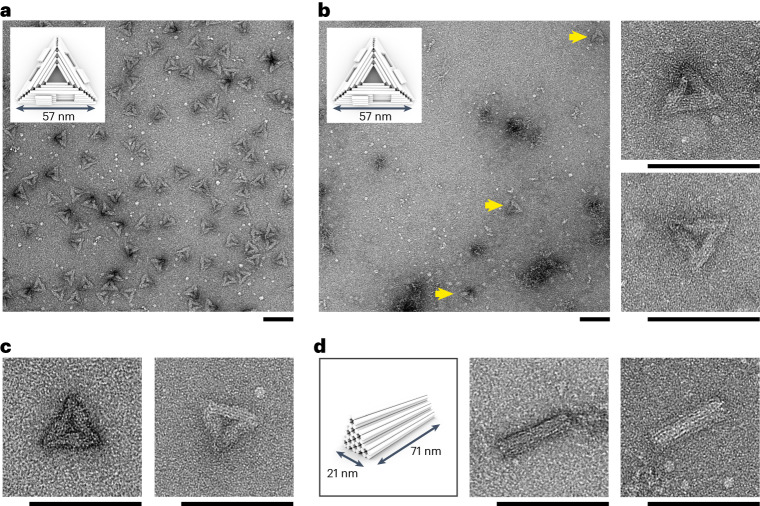
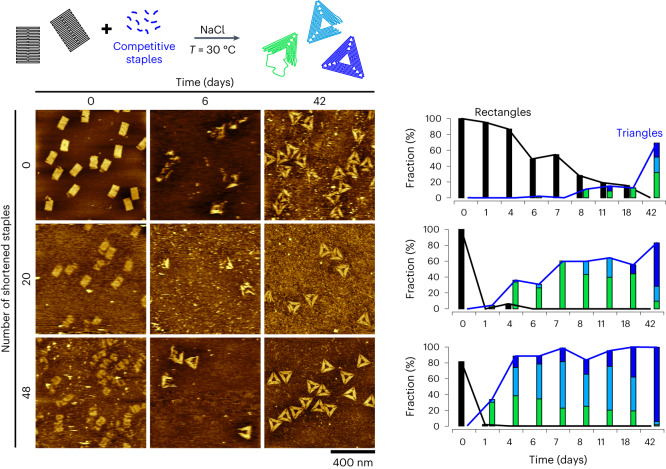
Thermal annealing is usually needed to direct the assembly of multiple complementary DNA strands into desired entities. We show that, with a magnesium-free buffer containing NaCl, complex cocktails of DNA strands and proteins can self-assemble isothermally, at room or physiological temperature, into user-defined nanostructures, such as DNA origamis, single-stranded tile assemblies and nanogrids. In situ, time-resolved observation reveals that this self-assembly is thermodynamically controlled, proceeds through multiple folding pathways and leads to highly reconfigurable nanostructures. It allows a given system to self-select its most stable shape in a large pool of competitive DNA strands. Strikingly, upon the appearance of a new energy minimum, DNA origamis isothermally shift from one initially stable shape to a radically different one, by massive exchange of their constitutive staple strands. This method expands the repertoire of shapes and functions attainable by isothermal self-assembly and creates a basis for adaptive nanomachines and nanostructure discovery by evolution.


Conflict of interest statement

The authors declare no competing interests.

Figures

Fig. 1
Fig. 1. Isothermal self-assembly of user-defined DNA origamis in a magnesium-free NaCl buffer.
a, An origami mix (M13 scaffold plus a 40× excess of desired staples) can spontaneously self-assemble at constant temperature into the target equilibrium shape (for example, a triangle) in TANa buffer. b, AFM observation of the isothermal origami formation at 25 °C in TANa ([NaCl] = 100 mM), for a set of staples coding for sharp triangles, as a function of incubation time. c, Fraction (bubble size) of partially folded (yellow) and fully folded (red) origamis after 24 h of isothermal self-assembly with a set of staples coding for sharp triangles, for various incubation temperatures (T) and NaCl concentrations. A cross symbol indicates a fraction of 0. For the sake of readability, the remaining fraction, which corresponds to non- or misfolded origamis, is not plotted in this graph but is displayed in Supplementary Fig. 3. All images used for these analyses are available in a citable public repository (doi: 10.5281/zenodo.7998757) and can be accessed directly at the following link: https://zenodo.org/record/7998757. The number n of analysed objects for each condition is given in Supplementary Table 1. d, Representative close-up AFM images of origamis obtained by isothermal assembly in TANa ([NaCl] = 100 mM) at 25 °C for staples coding for sharp triangles (left), tall rectangles (middle) and smileys (right). For all experiments: [M13] = 1 nM; each staple concentration is 40 nM; no staple purification was performed before AFM imaging. Source data
Fig. 2
Fig. 2. Expanded applicability of the isothermal self-assembly: protein functionalization, tile assembly and nanogrid formation at 25 °C in TANa buffer.
a, Top: self-assembly of an origami mix with staples coding for sharp triangles, including biotinylated staples at specific positions a–f, in the presence of 2 µM streptavidin (Strep). Middle: representative AFM images of the obtained origamis after 24 h of assembly in TANa ([NaCl] = 100 mM), as a function of the biotinylated staples used in the mix. Larger-scale images are given in Supplementary Fig. 16. Bottom: fraction (%) of streptavidin detected on origamis functionalized with 1 to 6 streptavidin proteins. The box plots display a box (orange) ranging from the first to third quartiles (black bars), with extrema indicated by shorter black bars and the median shown as a red bar. Each of the n counted streptavidins is represented by a cross. All images used for these analyses are available in a citable public repository (doi: 10.5281/zenodo.7998757) and can be accessed directly at the following link: https://zenodo.org/record/7998757. [M13] = 1 nM; each staple concentration is 40 nM. b, Top: self-assembly of SSTs into an R4 rectangle with 100 mM NaCl. Middle: AFM images as a function of self-assembly time. Bottom left: electrophoresis gel of the self-assembling mixture as a function of time, with ladders shown on extreme left and right. Red arrowheads indicate the bands of fully formed R4 rectangles. Bottom right, AFM image of R4 rectangle after 63 h of self-assembly and purification by gel electrophoresis. c, Self-assembly of nine oligonuclotides (1 µM each) forming extended DNA nanogrids with representative AFM images after 24 h assembly with [NaCl] = 100 mM (left) or 150 mM (right). Larger-scale images are given in Supplementary Fig. 17. Source data
Fig. 3
Fig. 3. Isothermal self-assembly of elaborate 3D structures at room or body temperature leads to well-shaped 3D origamis at low yield.
ad, Negative-stain TEM images of the structures obtained by thermal annealing (a) or isothermal assembly (bd) and after removal of excess staples by gel electrophoresis. a, T1 triangular structures (scheme in inset) obtained by 41 h of thermal annealing in an optimized Mg buffer (5 mM Tris–HCl, pH 8.0, 1 mM EDTA, 18 mM MgCl2). bd, Structures obtained by isothermal self-assembly (no thermal pretreatment) in TANa buffer: T1 triangular structures (scheme in inset) indicated by yellow arrows and obtained with [NaCl] = 100 mM at 25 °C for 48 h (b); T1 triangular structures obtained with [NaCl] = 200 mM at 25 °C (left) and with [NaCl] = 100 mM at 37 °C (right) for 72 h (c); Tb ‘Toblerone’-like structures (left, scheme) obtained with [NaCl] = 100 mM at 25 °C for 48 h (middle) and with [NaCl] = 200 mM at 25 °C for 48 h (d). Scale bars, 100 nm. Source data
Fig. 4
Fig. 4. In situ visualization of the isothermal folding reveals the multiple folding pathways of a process under thermodynamic control.
a, Cholesterol-modified Λ-shaped origamis were initially adsorbed on a supported lipid bilayer and carried an unfolded M13 fragment to be folded into a third sharp triangle side. The image is a snapshot obtained after 237 min of real-time AFM observation at 25 °C in TANa buffer ([NaCl] = 100 mM) supplemented with 1 mM EDTA, where t = 0 corresponds to the addition of staples programming the folding of the M13 fragment (Supplementary Movie 1). Circles indicate characteristic examples of (1) complete origami folding from initially adsorbed state (white), (2) complete origami folding in bulk prior to adsorption (blue), (3) adsorption of origamis followed by folding (yellow). bd, Detailed evolution of the folding process of the three individual origamis indicated by white circles B (b), C (c) and D (d) in a evidencing three characteristic folding pathways from the initial Λ shape to the fully folded sharp triangle. Images are extracted from Supplementary Movies 2–4. e, Schematic diagram showing at least three folding pathways. [M13] = 1 nM; each staple concentration is 40 nM.
Fig. 5
Fig. 5. Evolution under thermal equilibrium: morphological transformation by massive strand displacement at constant temperature.
Top: schematic principle of the experiment: tall rectangle origamis in the presence of their excess staple (40×) are mixed with a 10-fold larger excess of a competitive set of staples coding for sharp triangles in TANa buffer. The origamis progressively evolve into sharp triangles at constant temperature (30 °C). Bottom left: representative AFM images of the structures evolving in time when the initial set of staples for tall rectangles contained 0, 20 or 48 shortened staples. Bottom right: fraction of detected objects with a partial or fully folded rectangular shape (black) or a triangular shape with one (green), two (light blue) or three (dark blue) well-formed corners, after an increasing incubation time, with 0 (top), 20 (middle) or 48 (bottom) shortened staples in the rectangle. The remaining fraction of each histogram, which corresponds to misshaped or ill-defined objects, is not plotted in this graph. The bars for triangular shapes are shown in a stacked manner; the black and blue lines indicate the cumulative fraction of rectangular and triangular shapes, respectively. All images used for these analyses are available in a citable public repository (doi: 10.5281/zenodo.7998757) and can be accessed directly at the following link: https://zenodo.org/record/7998757. The number n of analysed objects for each condition is given in Supplementary Table 3. [M13] = 0.25 nM; each staple concentration is 10 nM (tall rectangle) or 100 nM (sharp triangle). Source data

Similar articles

Cited by

References

    1. Whitesides GM, Grzybowski B. Self-assembly at all scales. Science. 2002;295:2418–2421. - PubMed
    1. Seeman NC. Nucleic acid junctions and lattices. J. Theor. Biol. 1982;99:237–247. - PubMed
    1. Rothemund PWK. Folding DNA to create nanoscale shapes and patterns. Nature. 2006;440:297–302. - PubMed
    1. Wei B, Dai M, Yin P. Complex shapes self-assembled from single-stranded DNA tiles. Nature. 2012;485:623–626. - PMC - PubMed
    1. Wagenbauer KF, Sigl C, Dietz H. Gigadalton-scale shape-programmable DNA assemblies. Nature. 2017;552:78–83. - PubMed