. 2023 Sep;17(9):1504-1516.
doi: 10.1038/s41396-023-01462-5. Epub 2023 Jul 31.

Bacterial-fungal interactions promote parallel evolution of global transcriptional regulators in a widespread Staphylococcus species

Affiliations

Bacterial-fungal interactions promote parallel evolution of global transcriptional regulators in a widespread Staphylococcus species

Casey M Cosetta et al. ISME J. 2023 Sep.

Abstract

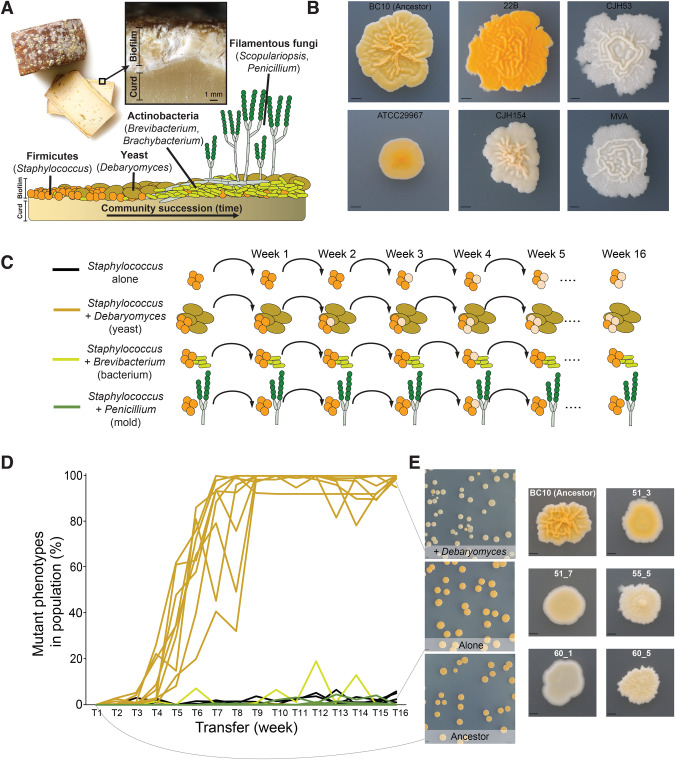
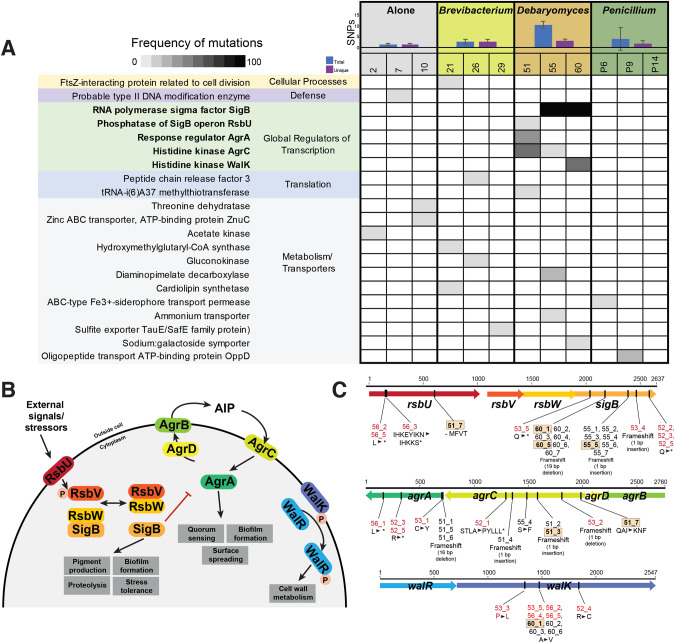
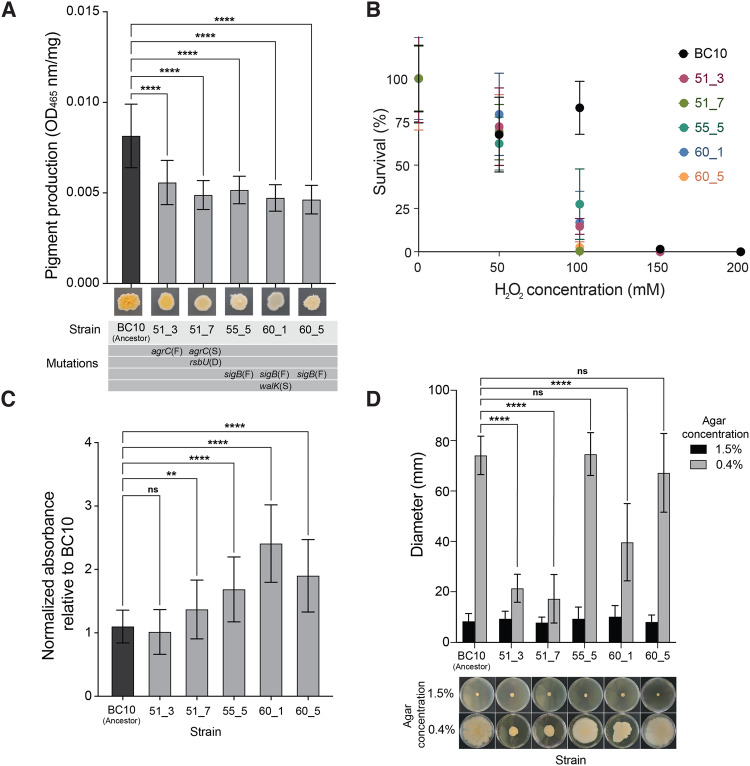
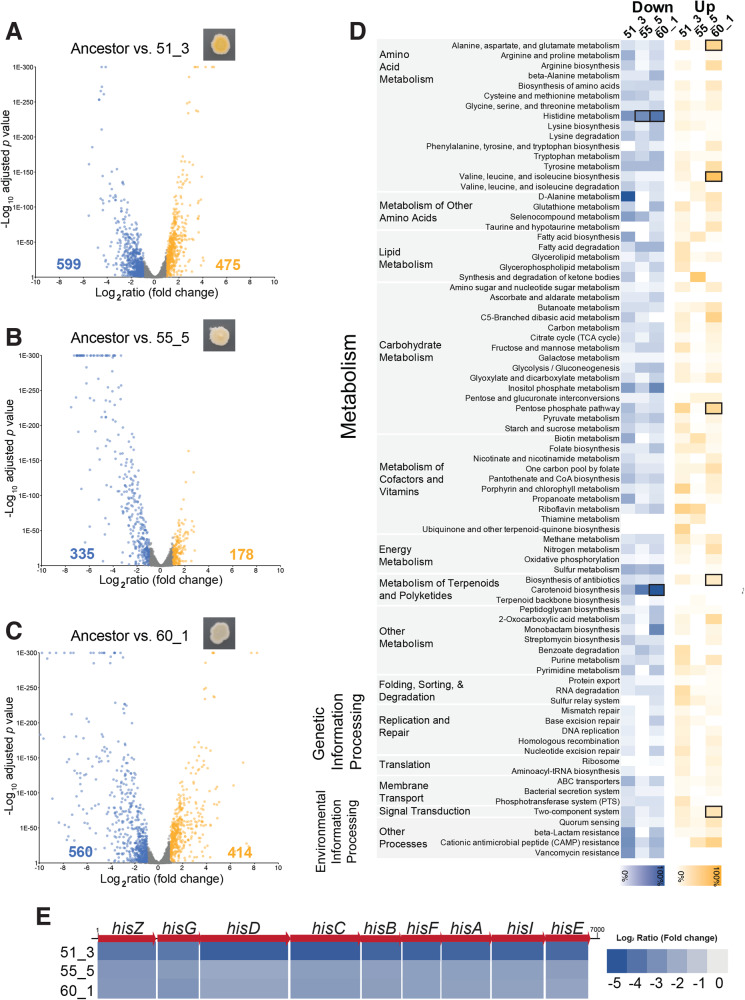
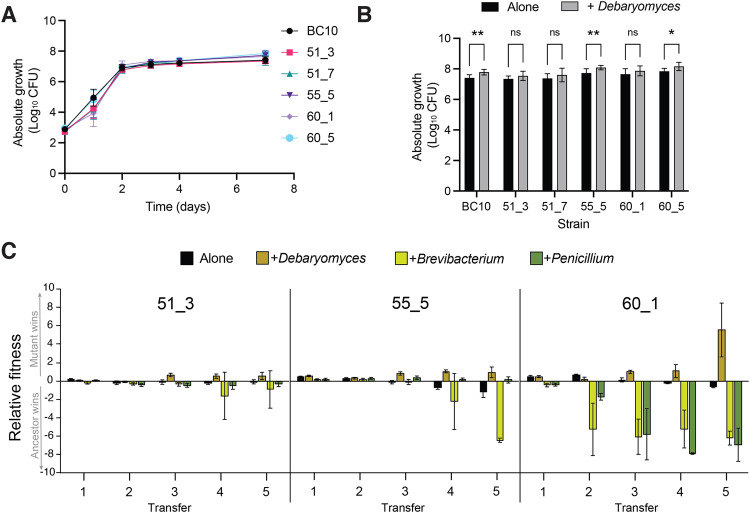
Experimental studies of microbial evolution have largely focused on monocultures of model organisms, but most microbes live in communities where interactions with other species may impact rates and modes of evolution. Using the cheese rind model microbial community, we determined how species interactions shape the evolution of the widespread food- and animal-associated bacterium Staphylococcus xylosus. We evolved S. xylosus for 450 generations alone or in co-culture with one of three microbes: the yeast Debaryomyces hansenii, the bacterium Brevibacterium aurantiacum, and the mold Penicillium solitum. We used the frequency of colony morphology mutants (pigment and colony texture phenotypes) and whole-genome sequencing of isolates to quantify phenotypic and genomic evolution. The yeast D. hansenii strongly promoted diversification of S. xylosus. By the end of the experiment, all populations co-cultured with the yeast were dominated by pigment and colony morphology mutant phenotypes. Populations of S. xylosus grown alone, with B. aurantiacum, or with P. solitum did not evolve novel phenotypic diversity. Whole-genome sequencing of individual mutant isolates across all four treatments identified numerous unique mutations in the operons for the SigB, Agr, and WalRK global regulators, but only in the D. hansenii treatment. Phenotyping and RNA-seq experiments highlighted altered pigment and biofilm production, spreading, stress tolerance, and metabolism of S. xylosus mutants. Fitness experiments revealed antagonistic pleiotropy, where beneficial mutations that evolved in the presence of the yeast had strong negative fitness effects in other biotic environments. This work demonstrates that bacterial-fungal interactions can have long-term evolutionary consequences within multispecies microbiomes by facilitating the evolution of strain diversity.


Conflict of interest statement

The authors declare no competing interests.

Figures

Fig. 1
Fig. 1. The yeast Debaryomyces hansenii causes phenotypic diversification of S. xylosus BC10 during experimental evolution.
A Overview of the cheese rind microbiome and the microbial species used in this manuscript including Staphylococcus xylosus, Debaryomyces hansenii, Brevibacterium aurantiacum, and Penicillium solitum. B Phenotypic variation across different isolates of Staphylococcus xylosus. All isolates are from cheese except for ATCC29967, the reference isolate for the species. BC10 is the strain used in this study. The scale bar represents 2.5 mm. C Overview of the experimental design used for the evolution study. D Frequency of phenotypic mutants in replicate populations across the four experimental treatments. Line colors correspond with the treatments indicated in C. Each line represents a replicate population, with ten replicates per treatment. One +Debaryomyces replicate became contaminated and had to be removed from the experiment. Mutant frequency was significantly higher in the +Debaryomyces treatment compared to the other three treatments at the final transfer (Kruskal–Wallis p < 0.0001, with Mann–Whitney post-hoc tests). E Examples of typical colony morphotypes within a population of Ancestor (the wild-type BC10), a population evolved Alone (without another microbial species), and a population in the +Debaryomyces treatment. Note the distinct difference in color in +Debaryomyces compared to the other two populations. More detailed examples of colony morphologies are shown on the right. 51_3, 51_7, 55_5, 60_1, and 60_5 were used for additional experiments in Figs. 3–5. The scale bar in the population photos on the left represents 5 mm and the scale bar in the closeup photos represents 1 mm.
Fig. 2
Fig. 2. Whole-genome sequencing identifies mutations in putative global regulators of S. xylosus BC10 in the +Debaryomyces treatment.
A Blue and purple bar graphs show number of SNPs (total in blue, number across unique genes in purple) detected across S. xylosus from three populations within each of the four biotic treatments (Alone, +Brevibacterium, +Debaryomyces, and +Penicillium). Shaded cells show frequency of non-synonymous mutations within a gene within a population (columns) based on sequencing 7 isolates per population. Only genes with a putative function assigned are shown. See Fig. S3 for a full table of all mutations, including those with unknown functions and those in the additional +Debaryomyces treatments that were sequenced. Numbers 1–10, 21–30, 51–60, and 61–70 are used to indicate unique populations. There were other experimental populations included in the initial experiment (31–40, 41–50), but they are excluded from this manuscript because the neighbor treatment went extinct. B Overview of the components of the three global regulatory systems where many mutations were detected in the +Debaryomyces treatment. These systems are poorly characterized in S. xylosus, so the potential structure and function of these systems is inferred from what is known in S. aureus. C Location and type of mutations observed in the sigB, agr, and walRK loci. Strains indicated in red font were from the additional +Debaryomyces treatments that were sequenced and are not included in (A), but are found in Fig. S3.
Fig. 3
Fig. 3. Phenotypic assays reveal biological impacts of global regulator mutations in evolved S. xylosus BC10.
A Pigment production in the ancestor and evolved strains of S. xylosus BC10. Bars represent means and error bars represent standard deviations. **** indicates p < 0.0001 based on ANOVA with Dunnett’s test. Data are from three independent experiments with six replicates of each treatment within each experiment. B Survival of the ancestor and evolved strains of S. xylosus BC10 across a range of H2O2 concentrations. Dots represent means and error bars represent standard deviations. At 100 mM, the S. xylosus BC10 ancestor had a higher survival compared to all evolved strains (two-way ANOVA, p < 0.0001). Data are from two independent experiments with eight replicates of each treatment within each experiment. C Biofilm production of ancestor and evolved strains of S. xylosus BC10. Bars represent means and error bars represent standard deviations. ** indicates p < 0.01 and **** indicates p < 0.0001 based on ANOVA with Dunnett’s test. ns indicates not significant. Data are from three independent experiments with nine replicates of each treatment within each experiment. D Spreading of ancestor and evolved strains of S. xylosus BC10. Photos at the bottom of the graph show representative plates from the 1.5% (low spreading) and 0.4% (high spreading) conditions. Bars represent means and error bars represent standard deviations. **** indicates p < 0.0001 based on ANOVA with Dunnett’s test. ns indicates not significant. Data are from three independent experiments with five replicates of each treatment within each experiment.
Fig. 4
Fig. 4. RNA sequencing highlights transcriptomic impacts of global regulator mutations in S. xylosus BC10.
Volcano plots showing changes in gene expression in mutant strain 51_3 (A), 55_5 (B), and 60_1 (C) compared to the ancestor BC10. Each dot represents a gene in the BC10 genome. Yellow dots are genes with significant increases in expression in the mutants. Blue dots are genes with significant decreases in expression compared to the ancestor. Numbers on the left and right of the x-axes indicate the number of genes that were significantly higher (yellow) or lower (blue) in expression for each mutant. D KOBAS pathway analysis of differentially expressed genes for each mutant. Blue or yellow shading indicates percent of genes in a pathway that were differentially expressed. Bold boxes indicate significant enrichment of a pathway based on a Fisher’s exact test with FDR correction. E Fold-change in expression of the nine genes in the his operon for histidine biosynthesis.
Fig. 5
Fig. 5. Growth and competition experiments reveal fitness of evolved S. xylosus mutants in different biotic environments.
A Growth of ancestor and evolved strains on cheese curd agar alone. Data represent mean CFUs at each time point and error bars are standard errors of the mean. Data are from three independent experiments with five replicates of each treatment within each experiment. B Growth of ancestor and evolved strains on cheese curd agar with and without the yeast D. hansenii after 7 days of growth. Data represent mean CFUs and error bars are one standard error of the mean. Data are from three independent experiments with five replicates of each treatment within each experiment. D. hansenii increased the growth of the isolates compared to growth alone (F5,161 = 3.4; p < 0.001). For post-hoc comparisons, ** = p < 0.005; * = p < 0.05. C Fitness of ancestor and mutant strains of S. xylosus when competed in initially identical ratios in different biotic environments. The ancestor:mutant mix was grown in four treatments and passaged five times to mimic the repeated cycles of growth in the evolution experiment. Relative fitness is expressed as log10((CFUs of mutant strain +1) ÷ (CFUs of ancestor strain +1)). A positive relative fitness means that the mutant strain reached a higher proportion of the total number of CFUs when competing with the ancestor. A negative fitness means the ancestor strain reached a higher proportion. Error bars represent one standard deviation of the mean with eight replicates of each treatment.

Comment in

Similar articles

Cited by

References

    1. Monk JM, Koza A, Campodonico MA, Machado D, Seoane JM, Palsson BO, et al. Multi-omics quantification of species variation of Escherichia coli links molecular features with strain phenotypes. Cell Syst. 2016;3:238–51. doi: 10.1016/j.cels.2016.08.013. - DOI - PMC - PubMed
    1. McCloskey D, Xu J, Schrübbers L, Christensen HB, Herrgård MJ. RapidRIP quantifies the intracellular metabolome of 7 industrial strains of E. coli. Metab Eng. 2018;47:383–92. doi: 10.1016/j.ymben.2018.04.009. - DOI - PubMed
    1. Garay-Arroyo A, Covarrubias AA, Clark I, Niño I, Gosset G, Martinez A. Response to different environmental stress conditions of industrial and laboratory Saccharomyces cerevisiae strains. Appl Microbiol Biotechnol. 2004;63:734–41. doi: 10.1007/s00253-003-1414-4. - DOI - PubMed
    1. Gallone B, Steensels J, Prahl T, Soriaga L, Saels V, Herrera-Malaver B, et al. Domestication and divergence of Saccharomyces cerevisiae beer yeasts. Cell. 2016;166:1397–410. doi: 10.1016/j.cell.2016.08.020. - DOI - PMC - PubMed
    1. Des Roches S, Post DM, Turley NE, Bailey JK, Hendry AP, Kinnison MT, et al. The ecological importance of intraspecific variation. Nat Ecol Evol. 2018;2:57–64. doi: 10.1038/s41559-017-0402-5. - DOI - PubMed

Publication types