. 2023 Sep;30(9):1265-1274.
doi: 10.1038/s41594-023-01044-1. Epub 2023 Jul 31.

Molecular basis for nuclear accumulation and targeting of the inhibitor of apoptosis BIRC2

Affiliations

Molecular basis for nuclear accumulation and targeting of the inhibitor of apoptosis BIRC2

Adam H Tencer et al. Nat Struct Mol Biol. 2023 Sep.

Abstract

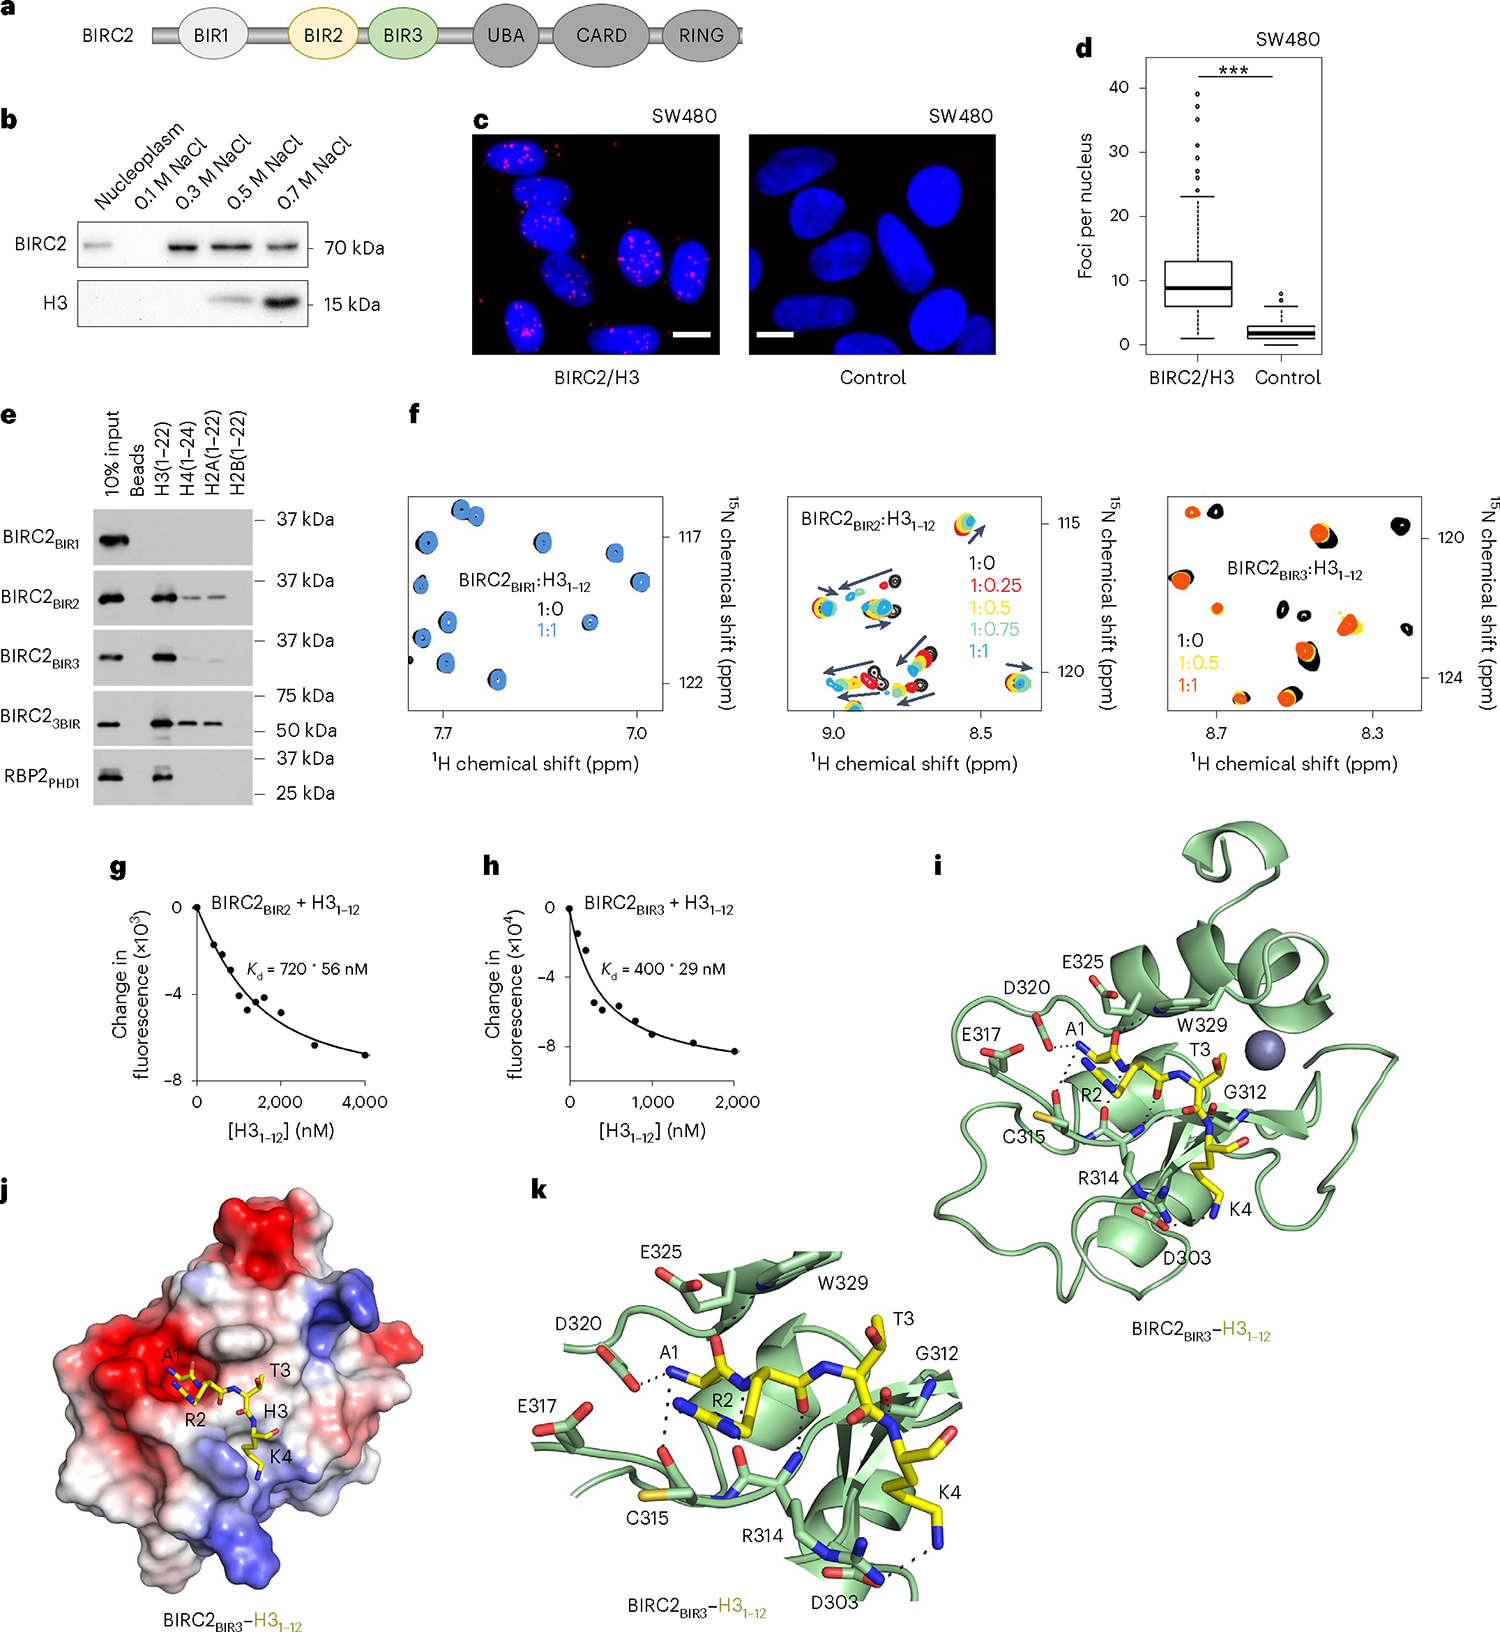
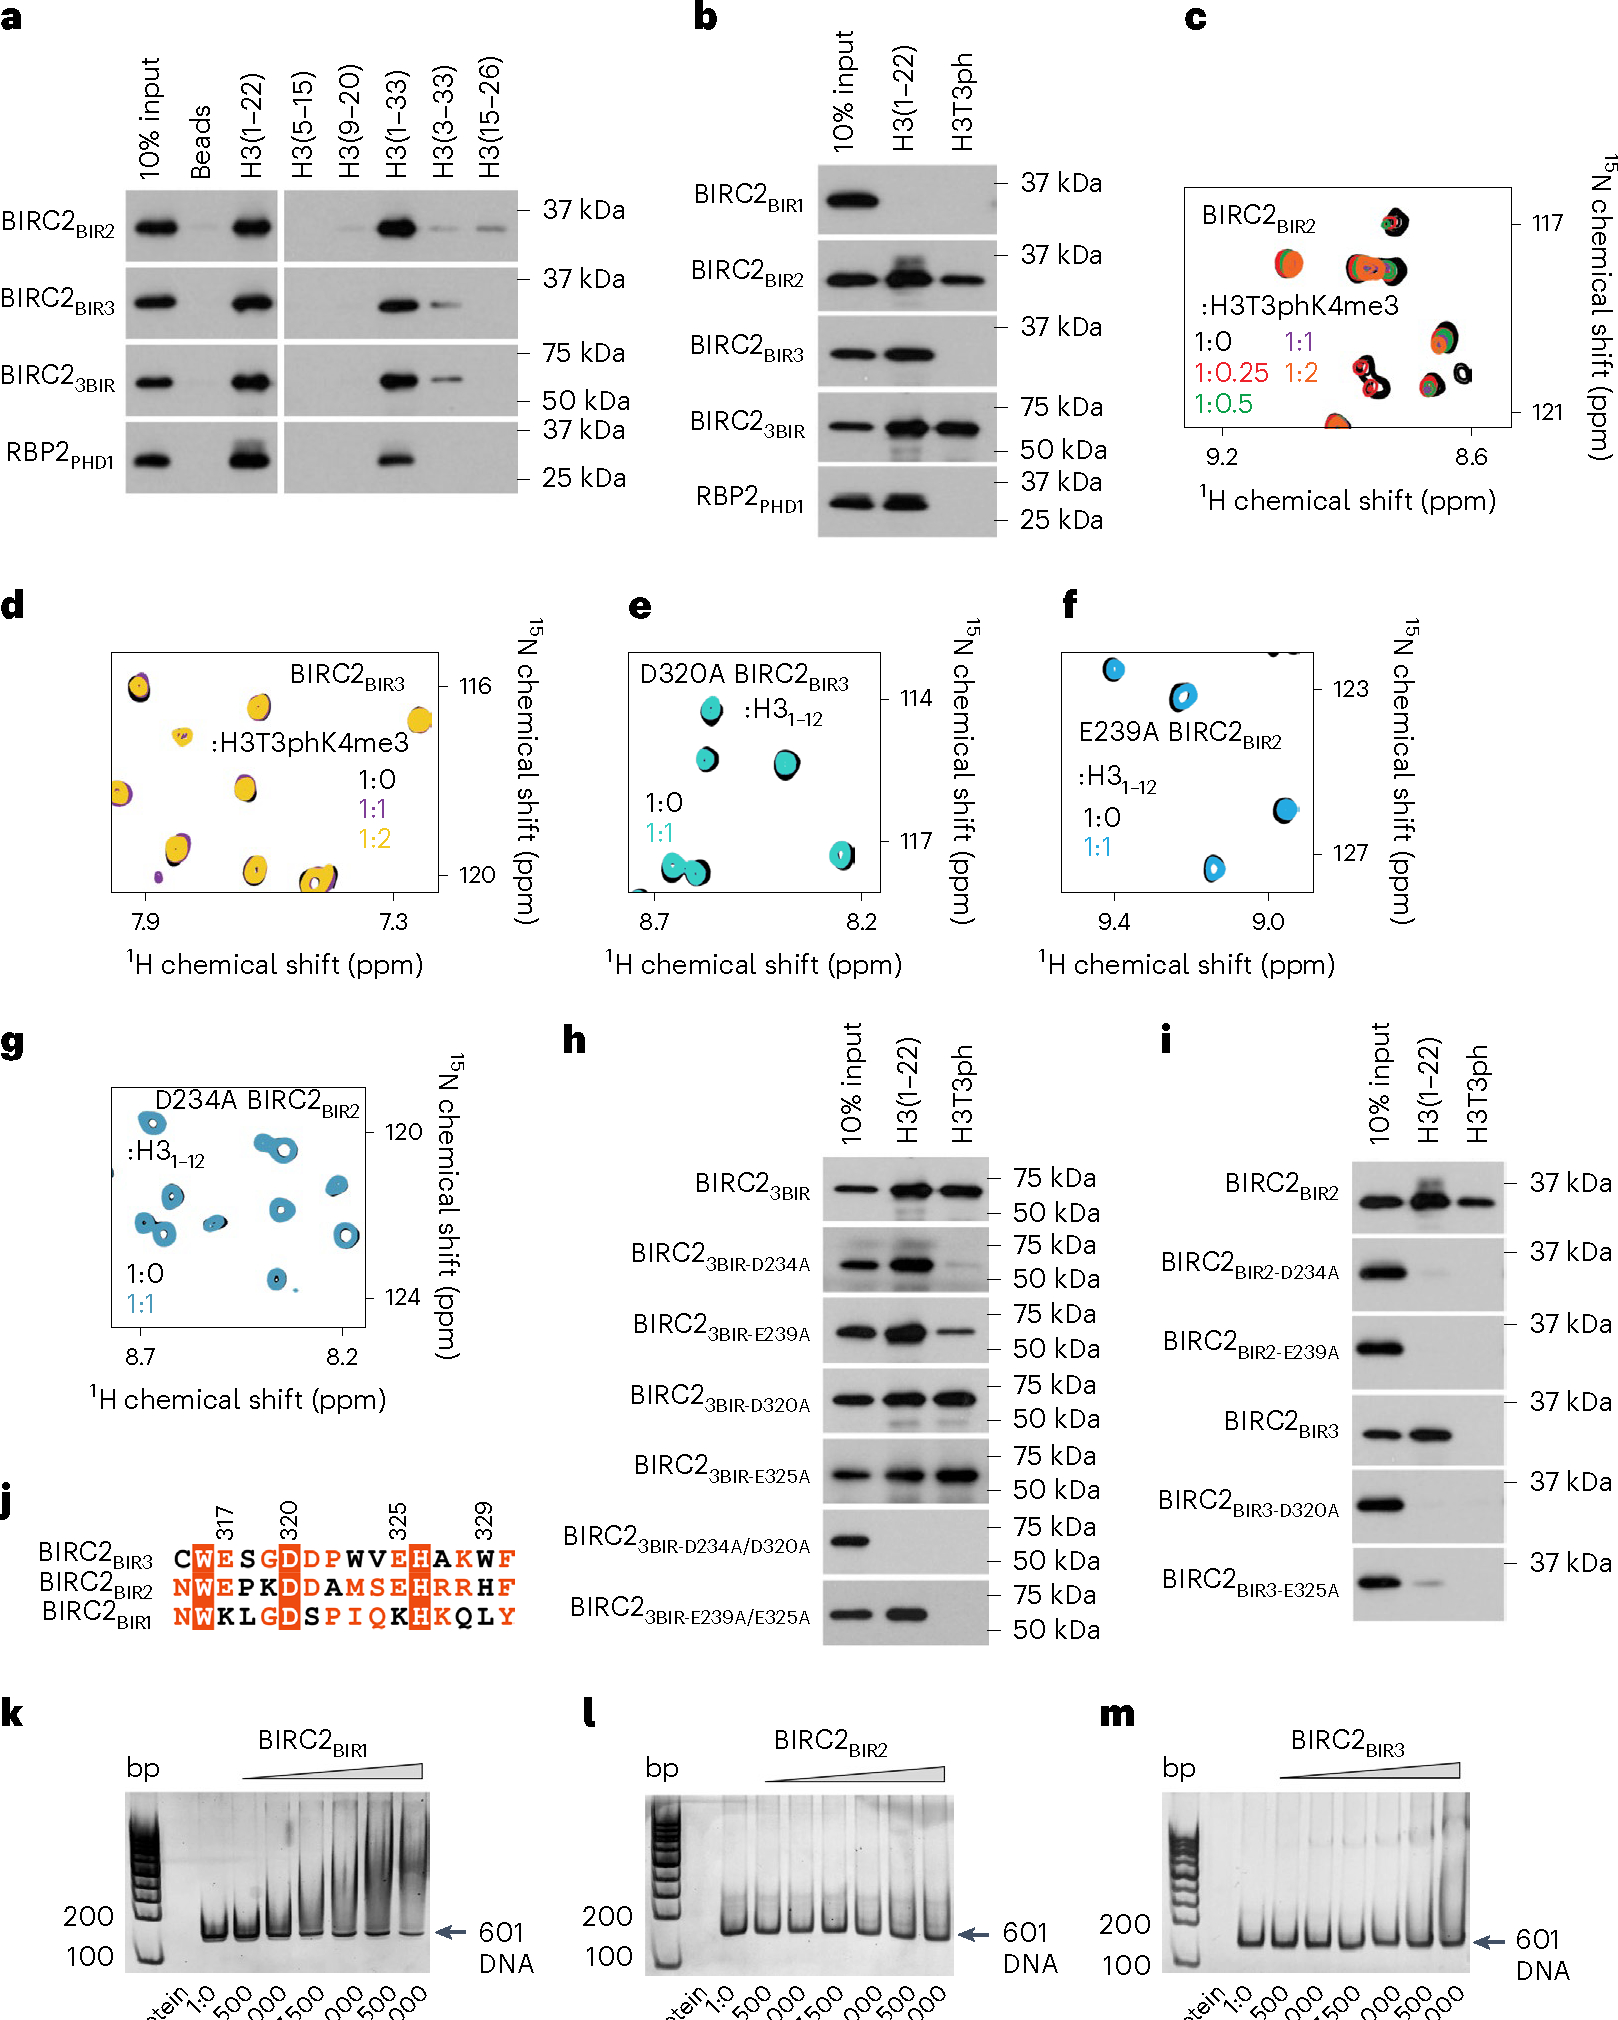
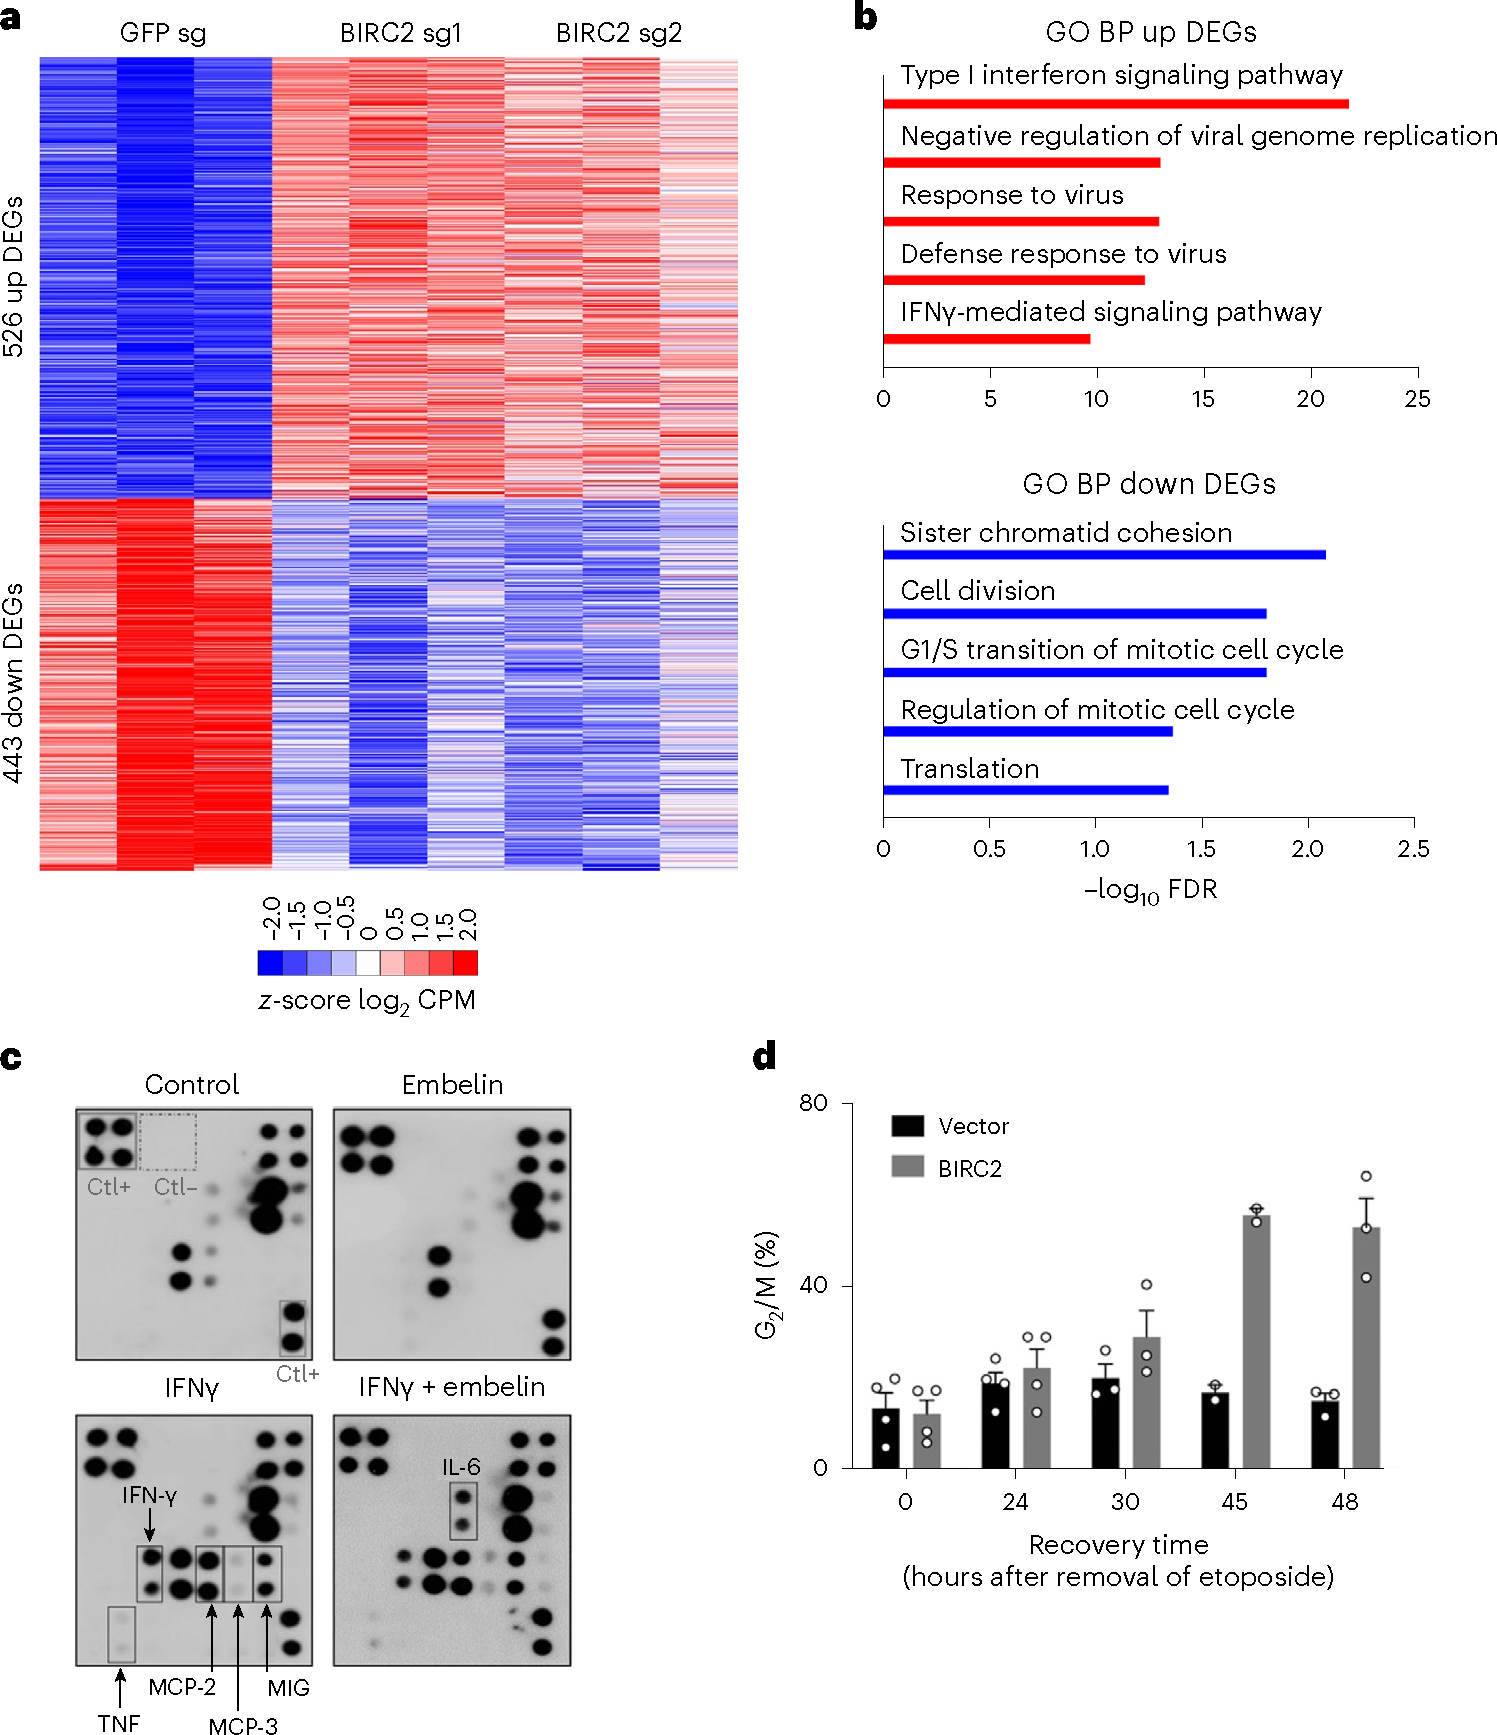
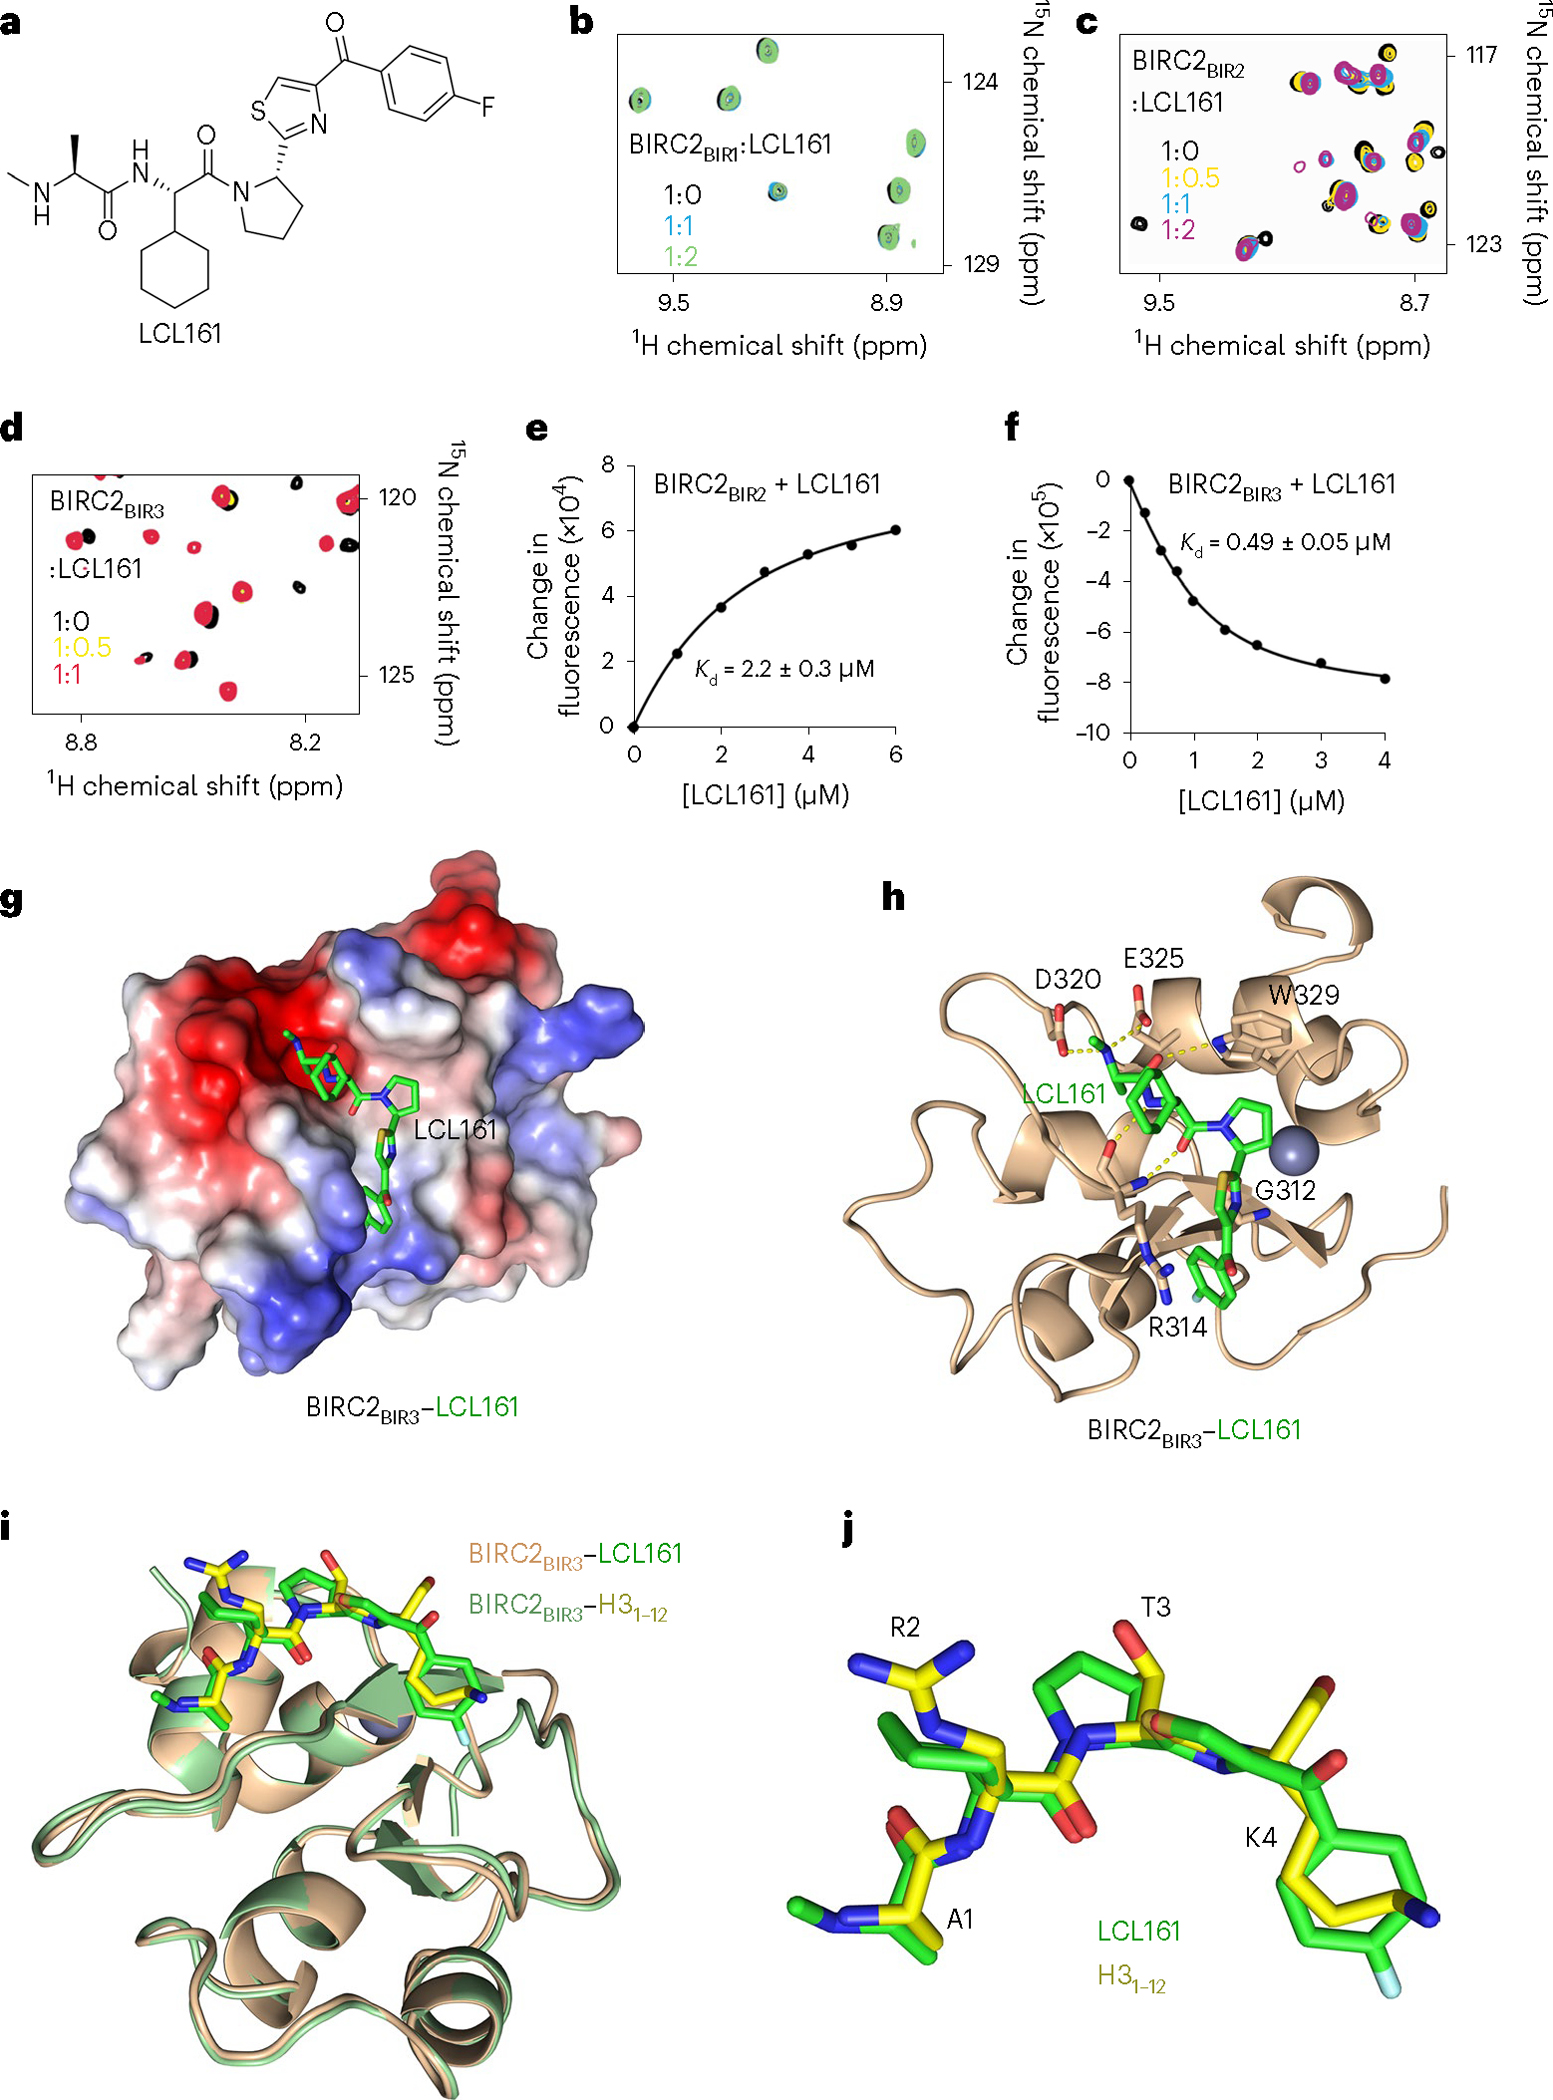
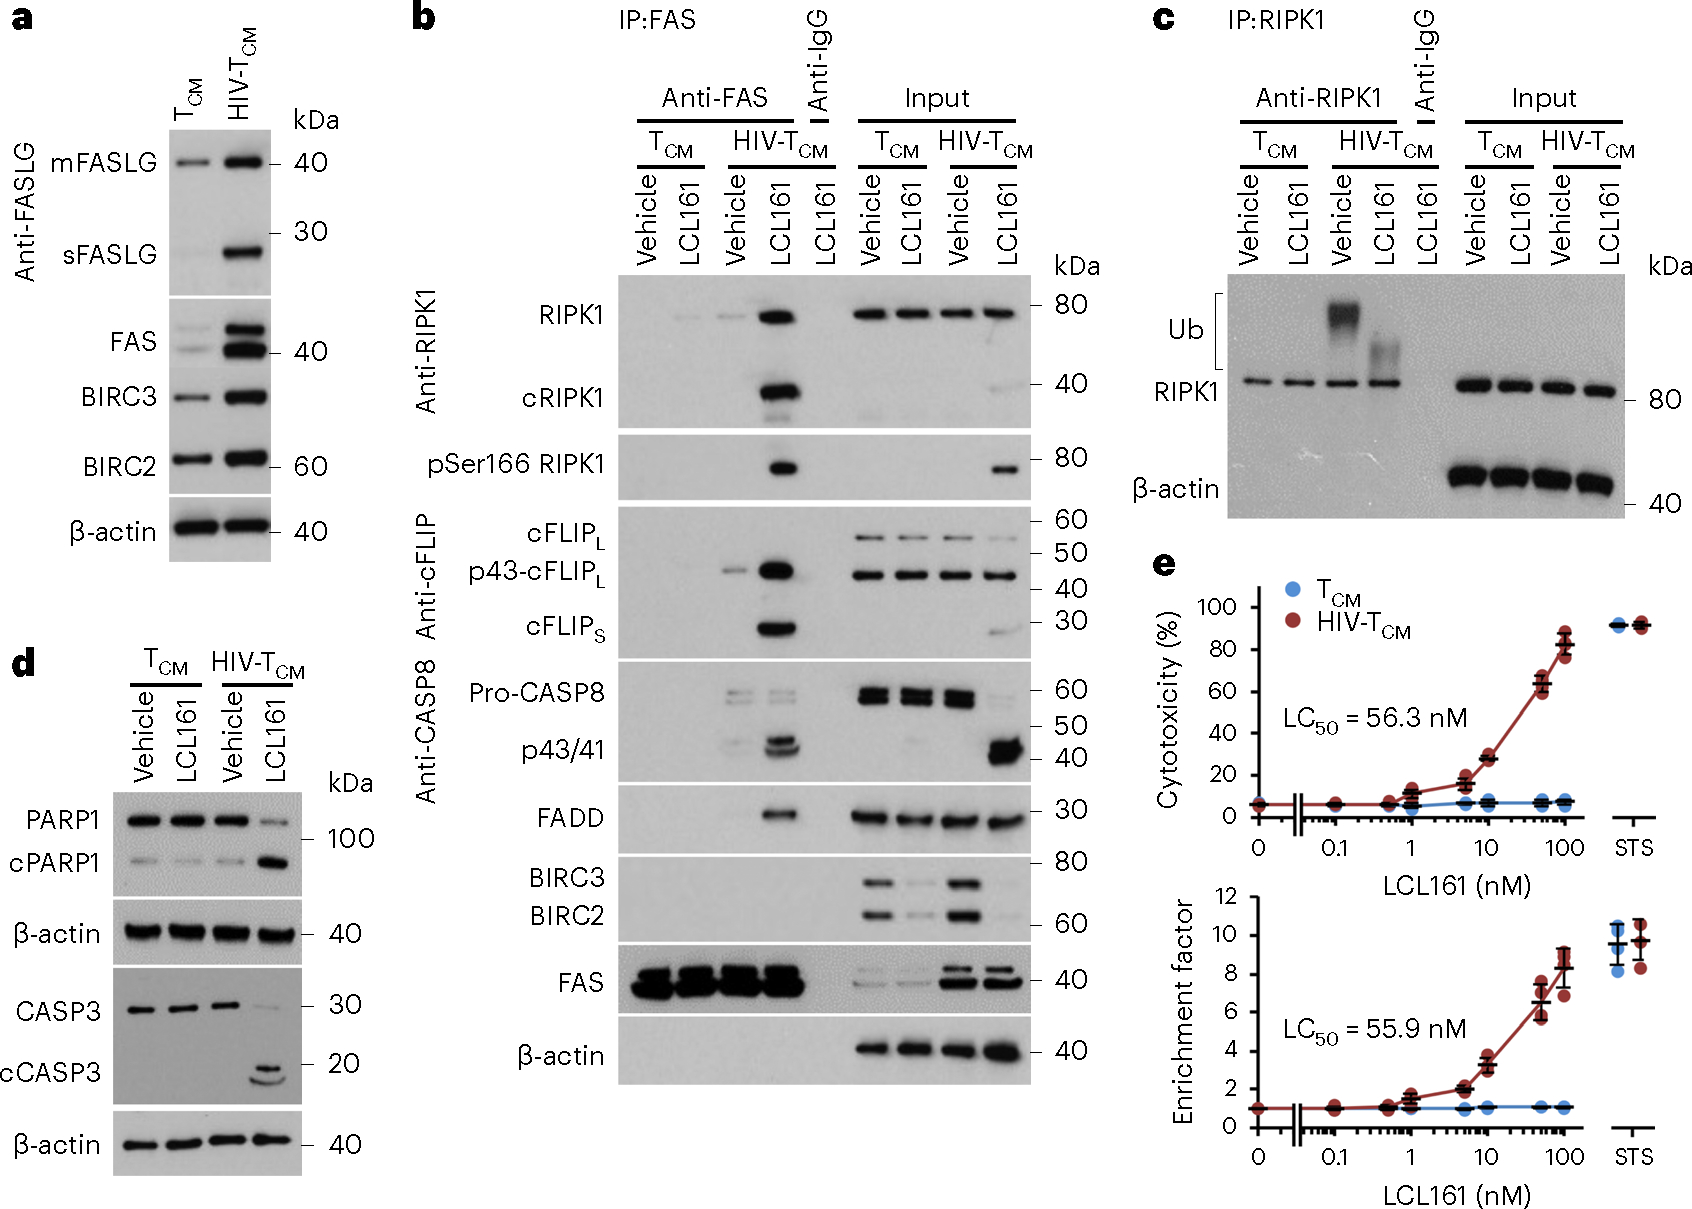
The inhibitor of apoptosis protein BIRC2 regulates fundamental cell death and survival signaling pathways. Here we show that BIRC2 accumulates in the nucleus via binding of its second and third BIR domains, BIRC2BIR2 and BIRC2BIR3, to the histone H3 tail and report the structure of the BIRC2BIR3-H3 complex. RNA-seq analysis reveals that the genes involved in interferon and defense response signaling and cell-cycle regulation are most affected by depletion of BIRC2. Overexpression of BIRC2 delays DNA damage repair and recovery of the cell-cycle progression. We describe the structural mechanism for targeting of BIRC2BIR3 by a potent but biochemically uncharacterized small molecule inhibitor LCL161 and demonstrate that LCL161 disrupts the association of endogenous BIRC2 with H3 and stimulates cell death in cancer cells. We further show that LCL161 mediates degradation of BIRC2 in human immunodeficiency virus type 1-infected human CD4+ T cells. Our findings provide mechanistic insights into the nuclear accumulation of and blocking BIRC2.


Conflict of interest statement

Competing interests

The authors declare no competing interests.

Figures

Fig. 1 |
Fig. 1 |. BIRC2 recognizes histone tails.
a, BIRC2 domain architecture. b, Western blot analysis of the salt gradient chromatin fractionation of SW480 nuclei. The experiment was performed independently three times. c, Representative images of PLA (red) between BIRC2 and H3 in SW480 cells. Nuclei are stained with DAPI (blue). Scale bars, 10 μm. d, Quantification of the PLA signal with at least 75 cells analyzed per condition. Statistical analysis is described in Statistics and reproducibility. Two-sided Wilcoxon tests. P < 2.2 × 10⁻¹⁶. e, Western blot analysis of pulldowns of the GST-tagged BIR domains of BIRC2 with the indicated histone peptides. RBP2-PHD, control. The experiment was performed independently three times. f, Superimposed 1H,15N HSQC spectra of 15N-labeled BIR domains of BIRC2, collected while the H31–12 peptide was titrated in the NMR samples. Spectra are color-coded according to the protein:peptide molar ratio. g,h, Representative binding curves used to determine Kd values by tryptophan fluorescence. Kd values were averaged over three separate experiments, with error calculated as s.d. between the runs. i, Ribbon diagram of BIRC2BIR3 (green) in complex with the H3 peptide (yellow). Dashed lines represent hydrogen bonds. The zinc ion is shown as a gray sphere. j, Electrostatic surface potential of BIRC2BIR3 is colored blue and red for positive charge and negative charge, respectively. The bound H3 peptide is shown as yellow sticks. k, Ribbon diagram of the BIRC2BIR3 (green) in complex with the H3 peptide (yellow). Dashed lines represent hydrogen bonds.
Fig. 2 |
Fig. 2 |. BIRs mediate histone and DNA binding functions of BIRC2.
a,b, Western blot analysis of pulldowns of the GST-tagged BIR domains of BIRC2 with the indicated histone peptides. RBP2-PHD, control. The experiments were performed independently three times. c,d, Overlays of 1H,15N HSQC spectra of the BIR domains of BIRC2 collected before (black) and after addition of the indicated peptides. Spectra are color-coded according to the protein:peptide molar ratio. eg, Overlays of 1H,15N HSQC spectra of the mutated BIRC2 BIR domains collected before (black) and after addition of the indicated peptides. Spectra are color-coded according to the protein:peptide molar ratio. h,i, Western blot analysis of pulldowns of the GST-tagged mutated BIRC2 BIR domains with the indicated histone peptides. The experiments were performed independently twice. j, Alignment of a fragment of the amino acid sequences of the BIRC2 BIR domains. Identical residues are highlighted by red boxes and moderately conserved residues are colored red. BIRC2BIR3 residues are labeled. km, EMSAs of 147 bp 601 DNA in the presence of increasing amounts of the indicated BIR domains of BIRC2. DNA:protein ratio is shown below gel images.
Fig. 3 |
Fig. 3 |. BIRC2 mediates cell defense and cell-cycle signaling.
a, Heatmap of common DEGs in MCF7 cells treated with BIRC2 sgRNAs (sg1 and sg2) or the control GFP sgRNA. Genes are shown as z-score log2CPM (counts per million reads mapped). Upregulated genes are shown in red and downregulated genes in blue. Adjusted P values for DEGs were calculated by two-sided Exact test model. b, Top-ranked GO biological process terms of up (red) and down (blue) regulated genes of DEGs as in a in BIRC2-knockout cells. The full lists are shown in Supplementary Tables 1 and 2. c, Cytokine antibody array with supernatants derived from human macrophages obtained by ex vivo differentiation of normal blood monocytes and stimulated with IFNγ for 24 h in the presence of 10 μM embelin or vehicle as control. d, HeLa cells transfected with either BIRC2-encoding or empty vector were untreated or treated with etoposide, then washed and incubated in a drug-free medium. Percentage of cells in G2/M. Data represent mean ± s.e.m. from at least three independent biological replicates (two for 45 h).
Fig. 4 |
Fig. 4 |. LCL161 binds to BIRC2BIR2 and BIRC2BIR3.
a, Chemical structure of LCL161. b–d, Superimposed 1H,15N HSQC spectra of 15N-labeled BIRC2BIR1, BIRC2BIR2 and BIRC2BIR3, collected while LCL161 was titrated in the NMR samples. Spectra are color-coded according to the protein:inhibitor molar ratio. e,f, Representative binding curves used to determine Kd values by tryptophan fluorescence. The Kd values were averaged over three separate experiments, with error calculated as s.d. between the runs. g, Electrostatic surface potential of BIRC2BIR3 is colored blue and red for the positive charge and the negative charge, respectively. The bound LCL161 compound is shown as green sticks. h, A ribbon diagram of the BIRC2BIR3 (wheat) in complex with LCL161 (green). Dashed lines represent hydrogen bonds. The zinc ion is shown as a gray sphere. i, Structural overlay of BIRC2BIR3 bound to LCL161 (green) and the H3 peptide (yellow). j, Superimposed LCL161 (green) and the H3 peptide (yellow) bound to BIRC2BIR3.
Fig. 5 |
Fig. 5 |. LCL161 disrupts binding of BIRC2 to H3 and induces cell death.
a, Representative images of the PLA (red) between BIRC2 and H3 in SW480 cells treated with or without 10 μM LCL161 for 1 h. Nuclei are stained with DAPI (blue). Scale bars, 10 μm. The experiment was performed independently three times. b, Quantification of the PLA signal with at least 75 cells analyzed per condition. Statistical analysis is described in Statistics and reproducibility. Two-sided Wilcoxon tests. P < 2.2 × 10⁻¹⁶. c, Western blot analysis of peptide pulldowns of GST-tagged BIRC2BIR3 with the H3 peptide (amino acids 1–22) in the presence of increasing concentrations of LCL161. The experiment was performed independently three times. d, Western blot analysis of BIRC2 in SW480 cells treated with or without 10 μM LCL161 for 1 h. β-actin was used as loading control. The experiment was performed independently three times. e, Western blot analysis of BIRC2 in human macrophages obtained by ex vivo differentiation of normal blood monocytes and stimulated or nonstimulated with IFNγ for 24 h in the presence or absence of 10 μM LCL161. β-actin was used as loading control. The experiment was performed independently three times. f,g, RT–qPCR analysis of IL6 (f) and RANTES (g) mRNA expression levels in human macrophages stimulated or nonstimulated with IFNγ for 24 h in the presence or absence of 10 μM LCL161. Data represent mean ± s.e.m. of at least three independent experiments. Paired two-sided t-test. h,i, MTT assay showing survival of mouse MEF (h) or human glioma LN18 cells (i) incubated for 24 h in medium containing the indicated concentrations of LCL161 and/or TNF. Data represent mean ± s.e.m. from three independent biological replicates.
Fig. 6 |
Fig. 6 |. LCL161 mediates BIRCs degradation in HIV-1-infected CD4+ T cells.
a, Representative western blots of FAS, membrane-bound FASLG (mFASLG), soluble FASLG (sFASLG), BIRC2 and BIRC3 in uninfected CD4+ T cells (TCM) and HIV-1-infected CD4+ T cells (HIV-TCM); n = 4. b, TCM and HIV-TCM were treated with 100 nM LCL161 for 4 h. FAS was immunoprecipitated using anti-FAS with a mouse IgG1 (anti-IgG as a negative control). Immunoprecipitates and cell lysates were analyzed by western blot using the indicated antibodies; n = 4. c, TCM and HIV-TCM were treated with 100 nM LCL161 for 5 min. RIPK1 was immunoprecipitated using anti-RIPK1 with a rabbit IgG (anti-IgG) as a negative control, and endogenous RIPK1 ubiquitination detected by western blotting using an RIPK1 antibody. n = 4. d, TCM and HIV-TCM were treated with 100 nM LCL161 for 4 h. Cell lysates were analyzed by western blot using the indicated antibodies; n = 4. e, TCM and HIV-TCM were treated with LCL161 or 2 μM STS for 4 h. Top, aliquots of supernatants were tested spectrophotometrically for LDH as a measure of cell death. Bottom, cells were harvested and cytoplasmic fractions assayed for cytoplasmic histone-associated DNA fragments (mono- and oligonucleosomes) by ELISA (see Methods for calculation of enrichment factor); n = 4 biologically independent replicates. Data are presented as means of biologically independent replicates with grand mean values ± s.d.

References

    1. Gyrd-Hansen M & Meier P IAPs: from caspase inhibitors to modulators of NF-kappaB, inflammation and cancer. Nat. Rev. Cancer 10, 561–574 (2010). - PubMed
    1. Estornes Y & Bertrand MJ IAPs, regulators of innate immunity and inflammation. Semin. Cell Dev. Biol. 39, 106–114 (2015). - PubMed
    1. Mehrotra S et al. IAP regulation of metastasis. Cancer Cell 17, 53–64 (2010). - PMC - PubMed
    1. Swingler S, Mann AM, Zhou J, Swingler C & Stevenson M Apoptotic killing of HIV-1-infected macrophages is subverted by the viral envelope glycoprotein. PLoS Pathog. 3, 1281–1290 (2007). - PMC - PubMed
    1. Wang X, Ragupathy V, Zhao J & Hewlett I Molecules from apoptotic pathways modulate HIV-1 replication in Jurkat cells. Biochem. Biophys. Res. Commun. 414, 20–24 (2011). - PubMed

Publication types

MeSH terms