. 2023 Sep;4(9):1292-1308.
doi: 10.1038/s43018-023-00610-2. Epub 2023 Jul 31.

Interleukin 17 signaling supports clinical benefit of dual CTLA-4 and PD-1 checkpoint inhibition in melanoma

Affiliations

Interleukin 17 signaling supports clinical benefit of dual CTLA-4 and PD-1 checkpoint inhibition in melanoma

Renáta Váraljai et al. Nat Cancer. 2023 Sep.

Erratum in

Abstract

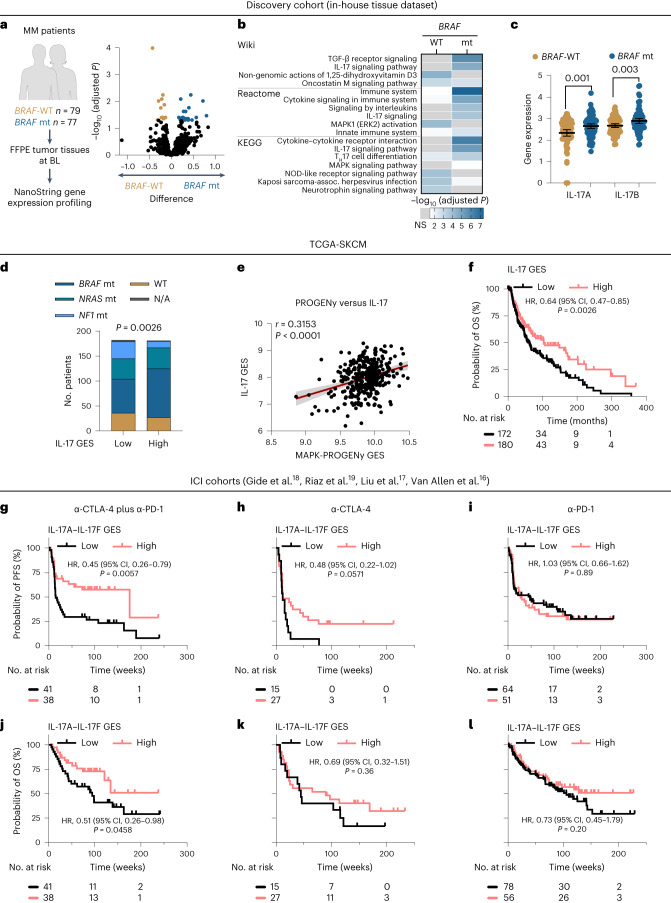
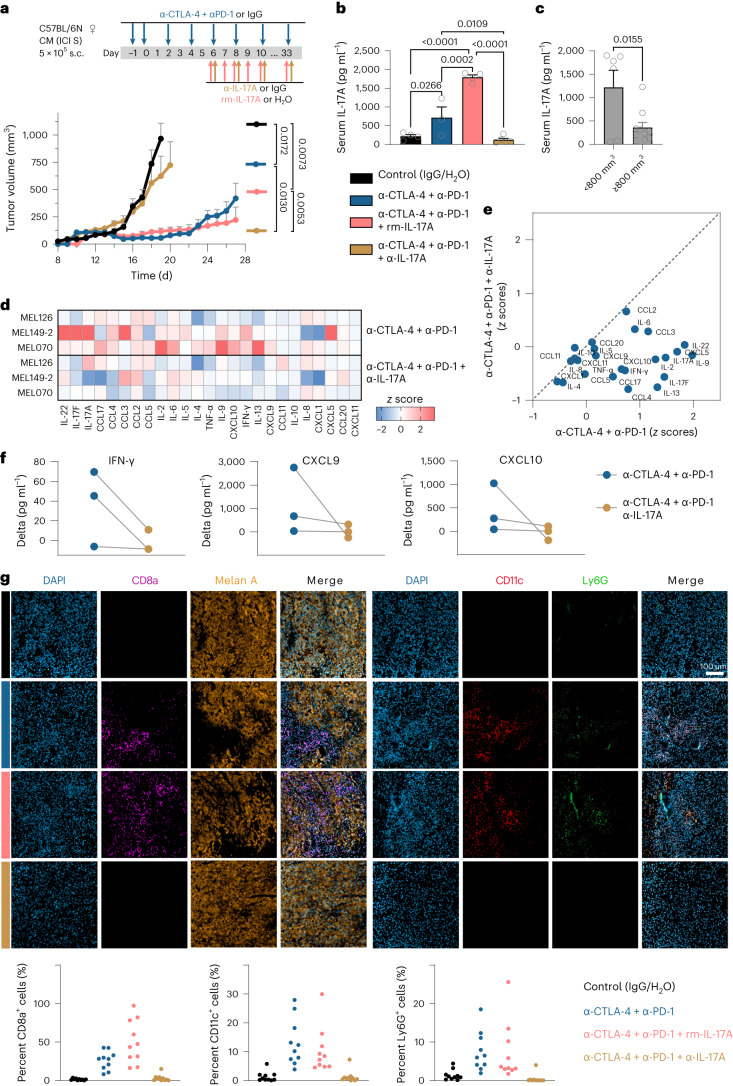
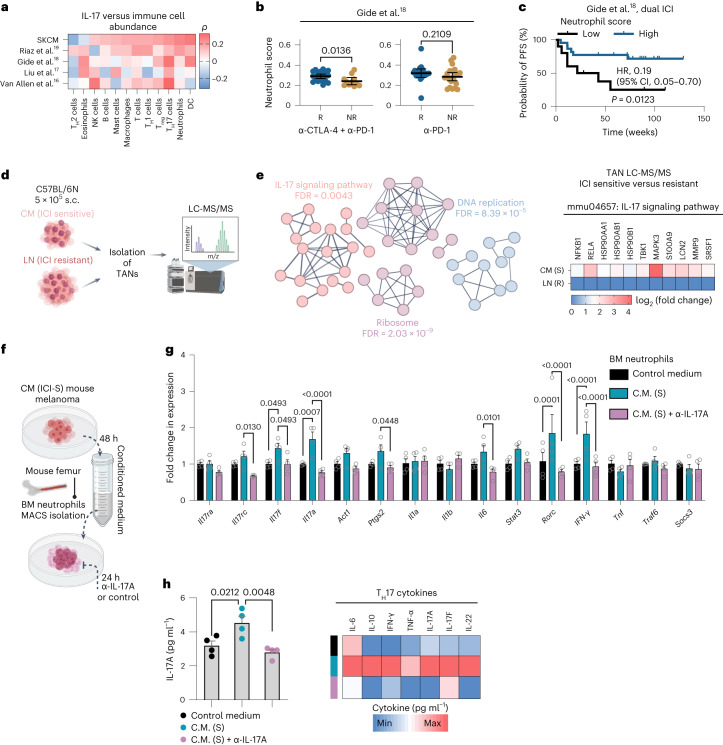
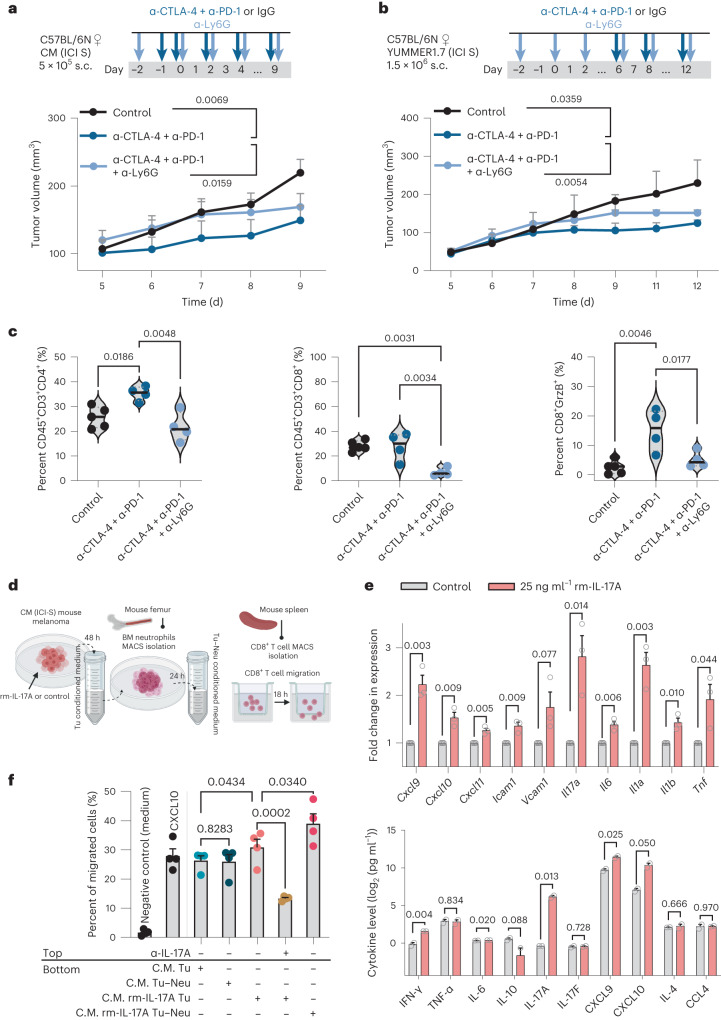
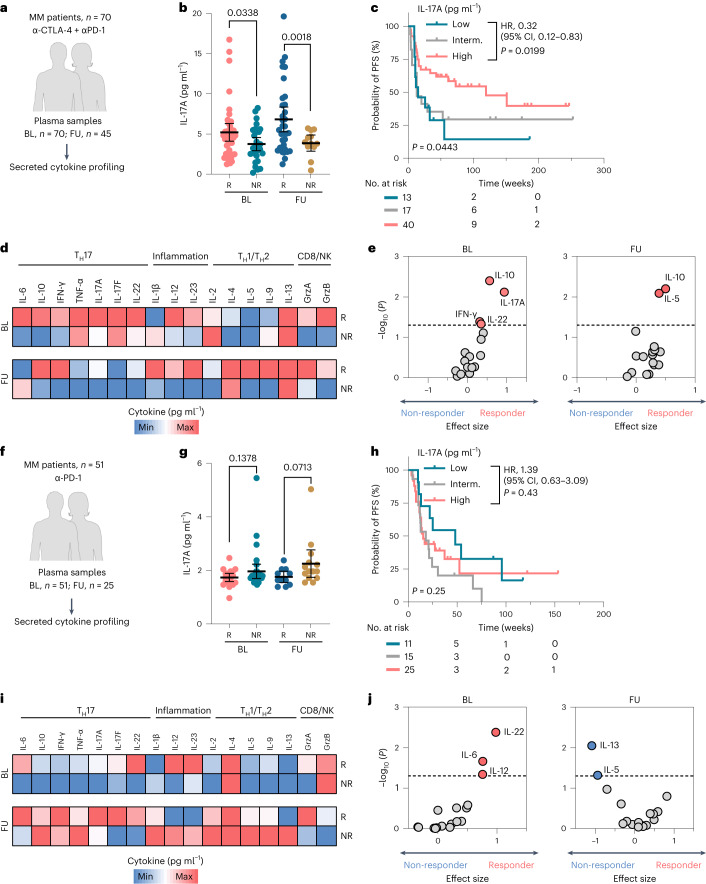
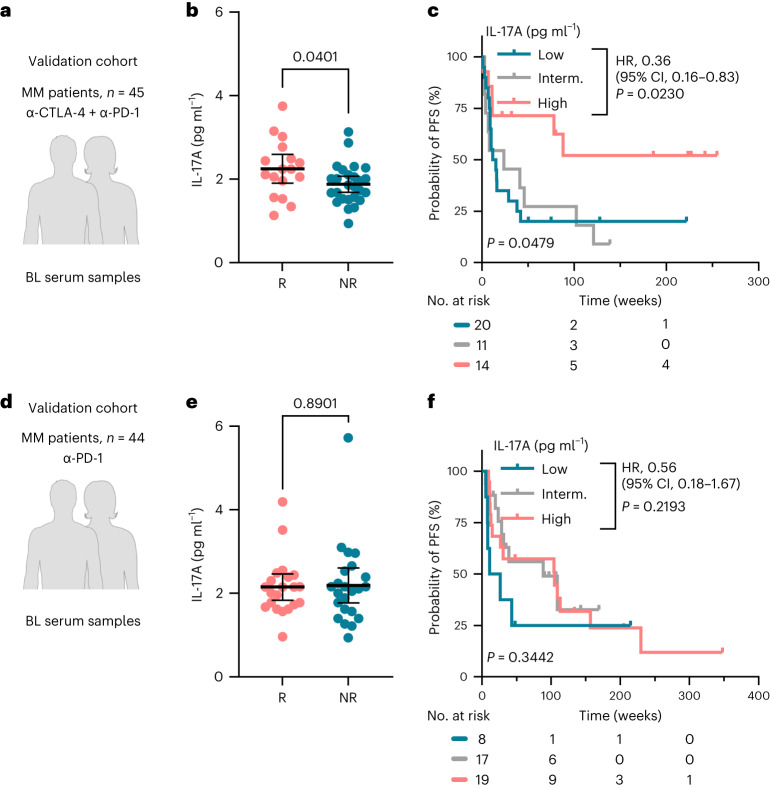
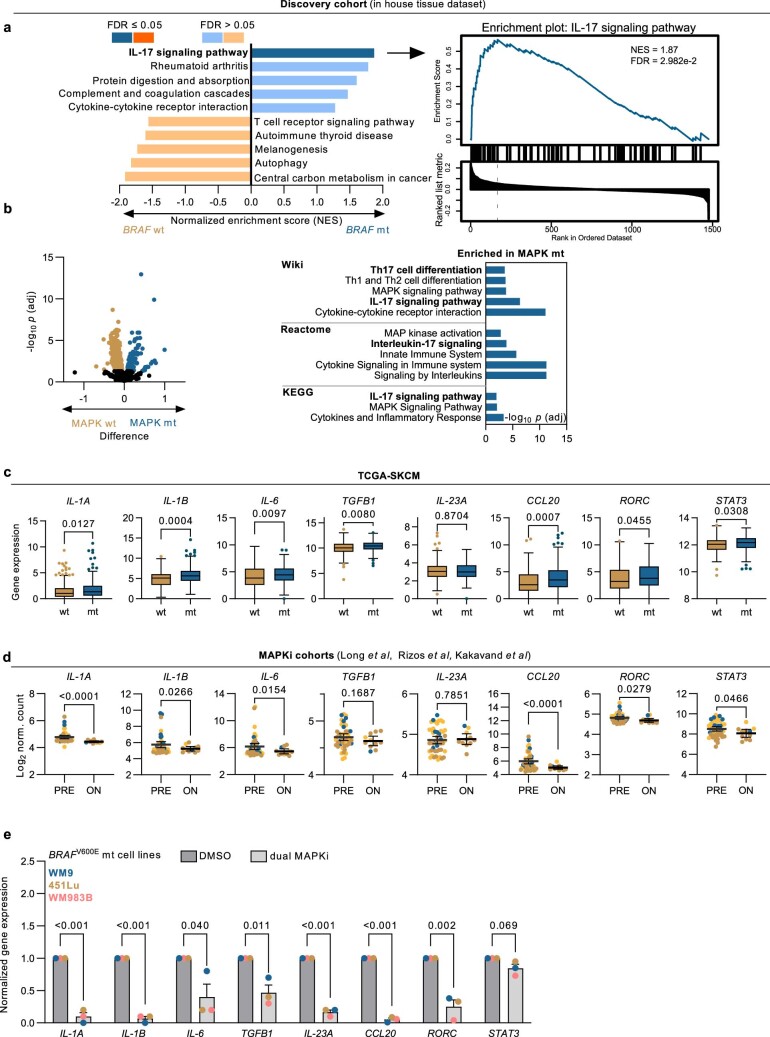
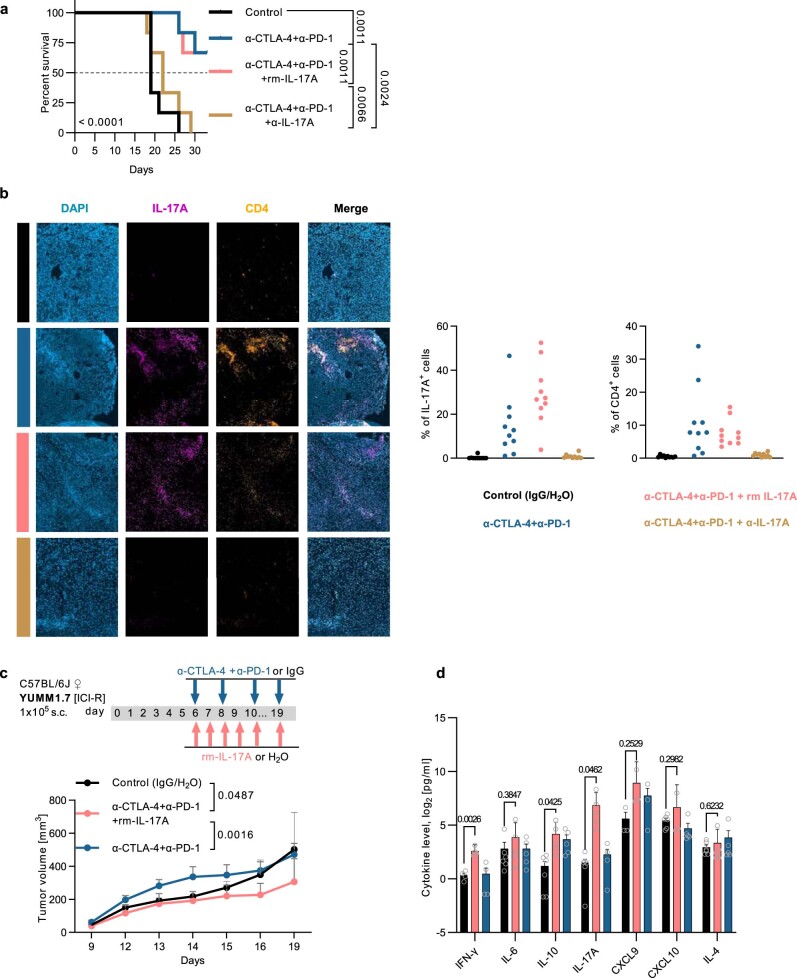
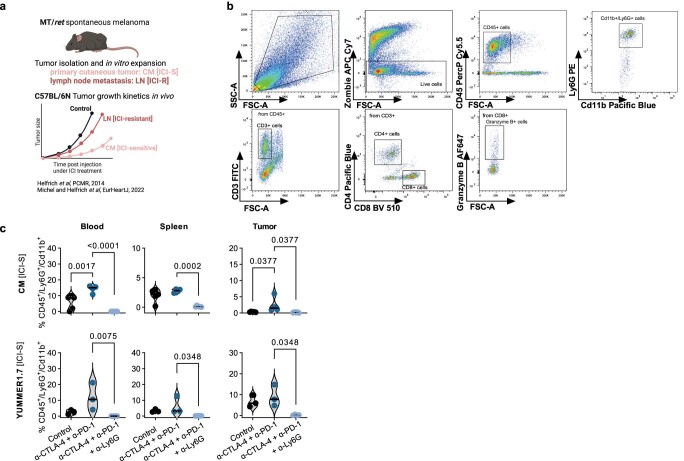
Recent studies suggest that BRAFV600-mutated melanomas in particular respond to dual anti-programmed cell death protein 1 (PD-1) and anti-cytotoxic T lymphocyte-associated protein 4 (CTLA-4) immune checkpoint inhibition (ICI). Here we identified an over-representation of interleukin (IL)-17-type 17 helper T (TH17) gene expression signatures (GES) in BRAFV600-mutated tumors. Moreover, high baseline IL-17 GES consistently predicted clinical responses in dual-ICI-treated patient cohorts but not in mono anti-CTLA-4 or anti-PD-1 ICI cohorts. High IL-17 GES corresponded to tumor infiltration with T cells and neutrophils. Accordingly, high neutrophil infiltration correlated with clinical response specifically to dual ICI, and tumor-associated neutrophils also showed strong IL-17-TH17 pathway activity and T cell activation capacity. Both the blockade of IL-17A and the depletion of neutrophils impaired dual-ICI response and decreased T cell activation. Finally, high IL-17A levels in the blood of patients with melanoma indicated a higher global TH17 cytokine profile preceding clinical response to dual ICI but not to anti-PD-1 monotherapy, suggesting a future role as a biomarker for patient stratification.


Conflict of interest statement

D.S. served as a consultant and/or has received honoraria from Array, Roche, Bristol Myers Squibb, Merck Sharp & Dohme, Nektar, NeraCare, Novartis, Pierre Fabre, Philogen, Pfizer, Sandoz, Sun Pharma and Sanofi; research funding to their institution from Novartis, Amgen, Roche, MSD and Array; and travel support from Merck Sharp & Dohme, Bristol Myers Squibb, Pierre Fabre, Sun Pharma, Sanofi and Novartis, outside the submitted work. E.L. served as a consultant and/or has received honoraria from Bristol Myers Squibb, Merck Sharp & Dohme, Novartis, Pierre Fabre, Sanofi, Sun Pharma and Takeda and travel support from Bristol Myers Squibb, Pierre Fabre, Sun Pharma and Novartis, outside the submitted work. A.R. reports grants from Novartis, Bristol Myers Squibb and Adtec; personal fees from Novartis, Bristol Myers Squibb and Merck Sharp & Dohme; and nonfinancial support from Amgen, Roche, Merck Sharp & Dohme, Novartis, Bristol Myers Squibb and Teva, outside the submitted work. W.P.F. reports fees from Calyx (consultant), RadioMedix (image review), Bayer (speaker bureau) and Parexel (image review), outside the submitted work. J.M.P. served as a consultant and/or has received honoraria from Bristol Myers Squibb, Novartis and Sanofi and has received travel support from Bristol Myers Squibb, Novartis and Therakos, outside the submitted work. L.J.A. received honoraria from Novartis, Sun Pharma and Bristol Myers Squibb and travel support from Sun Pharma, Takeda and Sanofi, outside the submitted work. S.U. declares research support from Bristol Myers Squibb and Merck Serono; speaker and advisory board honoraria from Bristol Myers Squibb, Merck Sharp & Dohme, Merck Serono, Novartis and Roche and travel support from Bristol Myers Squibb, Merck Sharp & Dohme and Pierre Fabre, outside the submitted work. W.S. reports grants from medi, grants and personal fees from Novartis and Almirall and personal fees from Amgen, AbbVie, Janssen, Boehringer Ingelheim, Bristol Myers Squibb, Lilly, UCB Novartis, Pfizer, LEO Pharma and Sanofi Genzyme, outside the submitted work. J.C.B. reports employment with Novartis and ownership of Novartis stock. D.G. reports employment with Novartis. J.U. is on the advisory board or has received honoraria and travel support from Amgen, Bristol Myers Squibb, GSK, Immunocore, Leo Pharma, Merck Sharp & Dohme, Novartis, Pierre Fabre, Roche and Sanofi, outside the submitted work. L.Z. declares speaker and advisory board honoraria from Bristol Myers Squibb, Merck Sharp & Dohme, Novartis, Pierre Fabre, Sanofi, Sun Pharma, research support from Novartis and travel support from Merck Sharp & Dohme, Bristol Myers Squibb, Pierre Fabre, Sanofi, Sun Pharma and Novartis, outside the submitted work. H.C.R. received consulting and lecture fees from AbbVie, AstraZeneca, Roche, Bristol Myers Squibb, Vertex, SinABiomedics and Merck. H.C.R. received research funding from AstraZeneca and Gilead Pharmaceuticals. H.C.R. is a cofounder of CDL Therapeutics. D.S.T. reports grants from Bristol Myers Squibb and Asher Biotherapeutics and speaker honoraria from Boehringer Ingelheim and served as a consultant for Ysios Capital and iTEOS, outside the submitted work. T.A. reports personal fees from CeCaVa, institutional grants and personal fees from Novartis, institutional grants from NeraCare, personal fees and travel grants from BMS, personal fees from Pierre Fabre, institutional grants from Sanofi, institutional grants from SkylineDx and institutional grants from iFIT, outside the submitted work. All other authors declare no competing interest.

Figures

Fig. 1
Fig. 1. IL-17 pathway genes are associated with improved response to dual ICI.
a, Left, schematic representation of the discovery cohort. Right, volcano plot showing the difference in BRAF-WT (n = 79 V600-negative samples)- and BRAF-mutant (n = 77 V600-positive samples)-associated gene expression (log2 (values)) and q values (−log10 (adjusted P values) from multiple unpaired t-tests with Benjamini, Krieger and Yekutieli test correction) in the discovery cohort. Each dot represents a gene; significant differentially expressed genes (q < 0.05) are shown in a color-coded manner. b, Heatmap showing enrichment scores (−log10 (adjusted P values), Benjamini–Hochberg-corrected FDR) of functional pathways in Wiki, Reactome and KEGG pathway databases. c, Scatter dot plots showing gene expression of IL17A and IL17B (n = 79 BRAF-WT, n = 77 BRAF-mutant tumors). Dots represent biologically independent patient samples. Mean ± 95% CIs are plotted; P values are from the unpaired t-test. d, Stacked bar plot showing the number of patients according to IL-17 signaling GES (according to KEGG hsa04657; cut point at median) and mutational subgroups in the TCGA-SKCM cohort (n = 363 tumor tissues). The P value is from the χ2 test. e, Scatterplot showing the correlation between IL-17 and the PROGENy MAPK activation GES in the TCGA-SKCM cohort (n = 363 tumor tissues). The line is from linear regression ±95% CI bands. f, Kaplan–Meier plot for OS according to the IL-17 signaling GES (KEGG hsa04657) in the TCGA-SKCM cohort. gl, Kaplan–Meier plots for PFS (gi) and OS (jl) according to the IL-17 family GES (‘IL-17A–IL-17F GES’, IL-17 family cytokines containing the six structurally related cytokines) in patients treated with dual-ICI (g,j), mono anti-CTLA-4 (h,k) and mono anti-PD-1 (i,l) therapy. gl, HR and 95% CIs are reported for high-expression groups. P values were calculated with the log-rank test. Categorization into ‘high’ versus ‘low’ was done according to an optimal cut point. All P values are two tailed. mt, mutant; FFPE, formalin fixed, paraffin embedded; BL, baseline; NS, not significant; NOD, nucleotide-binding oligomerization domain; assoc., associated; α, anti; N/A, not available. Source data
Fig. 2
Fig. 2. IL-17A supports anti-tumor effects of dual ICI.
a, Tumor growth kinetics of transplanted CM (BRAF-WT ICI-sensitive) melanoma tumors treated with immunoglobulin G (IgG) or H2O (control, n = 6), anti-CTLA-4 + anti-PD-1 (n = 6), anti-CTLA-4 + anti-PD-1 + rm-IL-17A (n = 6) and anti-CTLA-4 + anti-PD-1 + α-IL-17A (n = 6) antibodies according to the depicted treatment schedule. Data points show mean + s.e.m. until the day when the first mice were eliminated from each group; P values are from one-way ANOVA with Tukey’s multiple-comparison test. b, Serum IL-17A levels from the endpoint measurement (day 33) by ELISA. Shown are mean + s.e.m. of n = 3–5 biologically independent samples per group; P values are from one-way ANOVA with Holm–Sidak’s multiple-comparison test. c, Corresponding serum IL-17A levels in mice grouped according to final tumor volume (n = 6 (<800 mm3) versus n = 10 (≥800 mm3) biologically independent samples). The bar plot shows mean + s.e.m., and the P value is from an unpaired t-test. d,e, Heatmap (d) and corresponding xy plot (e) with z scores representing the normalized delta (stimulated − unstimulated condition) values of soluble mediators secreted by PDTFs from n = 3 human melanoma tumors treated ex vivo with anti-CTLA-4 + anti-PD-1 or with anti-CTLA-4 + anti-PD-1 + α-IL-17A antibodies. f, Delta values of IFN-γ, CXCL10 and CXCL9 secreted by PDTFs upon either anti-CTLA-4 + anti-PD-1 or anti-CTLA-4 + anti-PD-1 + α-IL-17A ex vivo treatment. g, Representative immunostaining images of CM tumors (day 9) showing melanoma (melan A) and immune cell markers (CD8a, CD11c, Ly6G). Scatter dot plots show the relative contribution of immune cells (n = 5 random fields per whole-tumor area, normalized to 4,6-diamidino-2-phenylindole (DAPI) values; n = 2 biologically independent tumors per group). All P values are two tailed. S, sensitive; s.c., subcutaneous; ♀, female; MEL, melanoma; CCL, C–C motif chemokine ligand; TNF, tumor necrosis factor. Source data
Fig. 3
Fig. 3. The IL-17 signaling-associated cellular microenvironment in melanomas treated with ICI.
a, Heatmap showing Spearman’s correlation between immune cell types (following the Bindea et al. algorithm) and IL-17A–IL-17F GES in tumor samples in bulk RNA-seq cohorts. b, Scatter dot plots showing estimated neutrophil cell enrichment in baseline tissue samples of therapy responders (n = 21) versus non-responders (n = 11) treated with dual ICI (left) and therapy responders (n = 19) versus non-responders (n = 22) treated with anti-PD-1 monotherapy (right) in the Gide et al. dataset. P values are from unpaired t-tests, and mean ± 95% CIs are plotted. Each dot represents a biologically independent sample. c, Kaplan–Meier plot for PFS according to baseline neutrophil cell enrichment levels (n = 10, ‘low’; n = 22, ‘high’, according to an optimal cut point) in the dual-ICI group of Gide et al.. HRs and 95% CIs are reported for high-expression groups, and the P value is from the log-rank test. d,e, Schematic workflow (d) for LC-MS/MS analysis (e). LC/MS/MS icon created by BioRender.com. Search Tool for the Retrieval of Interacting Genes/Proteins (STRING) analysis showing the top significantly enriched cellular pathways in TANs derived from CM tumors. The corresponding heatmap shows fold change in protein expression of IL-17 signaling pathway (according to KEGG mmu04657) components. f, Schematic workflow for naive BM neutrophil isolation and in vitro analysis. g, Quantitative PCR (qPCR) analysis of key IL-17 signaling components in untreated versus α-IL-17A-treated (5 µg ml−1) naive BM neutrophils cultured for 24 h in conditioned medium derived from CM mouse melanoma. Regular growth medium (no exposure to tumor cells) was used as a control. Bar plots represent mean + s.e.m. from n = 4 biologically independent samples; P values are from two-way ANOVA with Holm–Sidak’s multiple-comparison test. Shown is one representative of three independently performed experiments. h, Corresponding IL-17A (left, bar plot) and TH17 cytokine levels (right, heatmap) in the supernatants of BM neutrophils from g. The bar plot shows mean + s.e.m.; dots represent individual biological replicates. P values are from one-way ANOVA with Sidak’s multiple-comparison test. C.M., conditioned medium; R, responder; NR, non-responder; DC, dendritic cell; MACS, magnetic-activated cell sorting; max, maximum; min, minimum; TH, helper T cell; Treg, regulatory T cell. Source data
Fig. 4
Fig. 4. The IL-17-associated presence of neutrophils plays a role in the anti-tumor response to dual ICI.
Tumor growth kinetics of CM (BRAF-WT ICI-sensitive) (a) and YUMMER1.7 (BRAF-mutant ICI-sensitive) (b) tumors treated with IgG or H2O (control, CM, n = 5; YUMMER1.7, n = 4), anti-CTLA-4 + anti-PD-1 antibodies (CM, n = 4; YUMMER1.7, n = 4) or anti-CTLA-4 + anti-PD-1 + anti-Ly6G antibodies (CM, n = 5; YUMMER1.7, n = 4) according to the depicted treatment schedule. Data points show mean + s.e.m.; P values are from one-way ANOVA with Holm–Sidak’s multiple-comparison test. c, Violin plots showing tumor immune cell frequencies by flow cytometry from a (CM model). P values are from one-way ANOVA with Holm–Sidak’s multiple-comparison test. d, Schematic workflow for in vitro culture, isolation of BM neutrophils and splenic CD8+ T cells followed by the migration assay. e, Top, qPCR analysis of transcripts encoding T cell chemokines, adhesion molecules and TH17 signaling components in the control or rm-IL-17A-treated CM mouse cell line. Bar plots represent mean + s.e.m. from n = 3 biological replicates; P values are from the unpaired t-test. Shown is one representative of two independently performed experiments. Bottom, corresponding cytokine and chemokine levels in cell culture supernatants of CM cells treated with rm-IL-17A. Data points show mean + s.e.m. from n = 2 biologically independent samples; P values are from the unpaired t-test. f, Bar plot showing the percentage of migrated CD8+ T cells in the Boyden chamber assay. The different medium conditions used as chemoattractant in the bottom chamber are depicted below the horizontal line. Serum-free medium was used as the negative control, and recombinant mouse CXCL10 (200 ng ml−1) was used as the positive control. α-IL-17A (5 µg ml−1) was added to the top chamber (depicted above the horizontal line) as indicated. Individual data points represent n = 3–4 biological replicates per group; P values are from one-way ANOVA with Sidak’s multiple-comparison test. Shown is one representative of three independently performed experiments. All P values are two tailed. Tu, tumor; Neu, neutrophil; Grz, granzyme. Source data
Fig. 5
Fig. 5. IL-17A–TH17 profiling for response prediction in ICI-treated patients with melanoma.
a, Dual-ICI-treated melanoma patient cohort (first-line anti-CTLA-4 and anti-PD-1 therapy, n = 70). b, Plasma IL-17A levels as measured by ELISA in correlation to the best clinical response in samples collected at therapy baseline (n = 41 responders versus n = 29 non-responders) and at early follow-up (n = 33 responders versus n = 12 non-responders) visits. c, Kaplan–Meier plot for PFS according to the baseline IL-17A concentration. d, Heatmaps representing the median cytokine concentrations as quantified by multiplex cytokine array for responding versus non-responding patients. e, Corresponding volcano plot showing the effect size (Hedge’s g) and −log10 (P values) (Mann–Whitney U-test) for each cytokine for responding versus non-responding patients. f, Mono anti-PD-1-treated melanoma patient cohort (first-line anti-PD-1 therapy, n = 51). g, Plasma IL-17A levels as measured by ELISA in correlation to the best clinical response in samples collected at baseline (n = 19 responders versus n = 32 non-responders) and at early follow-up (n = 11 responders versus n = 14 non-responders) visits. h, Kaplan–Meier plot for PFS according to the baseline IL-17A concentration. i, Heatmaps representing median cytokine concentrations as quantified by multiplex cytokine array for responding versus non-responding patients. j, Corresponding volcano plot showing the effect size (Hedge’s g) and −log10 (P values) (Mann–Whitney U-test) for each cytokine for responding versus non-responding patients. P values are from the unpaired t-test with Welch’s correction, and mean ± 95% CIs are plotted in b,g. Each dot represents a biologically independent sample. Categorization into ‘high’ versus ‘low’ according to the X-tile-determined cut-point value was carried out separately within each dataset. HRs and 95% CIs are reported for ‘IL-17A high’, and P values are from the log-rank test in c,h. Significant predictors of response or non-response are shown above the dashed line (P < 0.05) in baseline or follow-up plasma samples in e,j. All P values are two tailed. FU, follow-up; responder, complete and partial responses; non-responder, progressive disease, mixed response; interm., intermediate. Source data
Fig. 6
Fig. 6. Validation cohort.
a, Dual-ICI-treated melanoma validation cohort (anti-CTLA-4 and anti-PD-1 antibodies, n = 45). b, Serum IL-17A levels as measured by ELISA in correlation to the best clinical response (n = 17 responders versus n = 26 non-responders) in samples collected at therapy baseline. c, Kaplan–Meier plot for PFS according to the baseline IL-17A concentration. d, Mono anti-PD-1-treated melanoma validation cohort (anti-PD-1 therapy, n = 44). e, Serum IL-17A levels as measured by ELISA in correlation to the best clinical response (n = 21 responders versus n = 23 non-responders) in samples collected at therapy baseline. f, Kaplan–Meier plot for PFS according to the baseline IL-17A concentration. P values are from the unpaired t-test, and mean ± 95% CIs are plotted in b,e. Each dot represents a biologically independent sample. Categorization into ‘high’ versus ‘low’ according to the X-tile-determined cut-point value was carried out separately within each dataset. HRs and 95% CIs are reported for ‘IL-17A high’, and P values are from the log-rank test in c,f. All P values are two tailed. Responder, complete and partial response; non-responder, progressive disease, stable disease, mixed response. Source data
Extended Data Fig. 1
Extended Data Fig. 1. The association between the IL-17A signaling and MAPK pathways.
(a) Gene set enrichment analysis in the discovery cohort showing (left) the normalized enrichment scores in pathways according to significance level and the corresponding enrichment plot for IL-17 signaling pathway (right). (b) Volcano plot showing the difference in MAPK wt (n = 36 triple wt tumors) and MAPK mt (n = 120 tumors with BRAF/NRAS hotspot and NF1 mutated tumors) associated gene expression (log2 values) and q-values (-log10 adjusted p-values from multiple unpaired t-test with Benjamini, Krieger and Yekutieli test correction) in the discovery cohort. Each dot represents a gene; significant DEGs (q < 0.05) are shown in a color-coded manner (left). Bar plot showing the enrichment scores (-log10 adjusted p-values, Benjamini–Hochberg corrected FDR) of functional pathways as defined by the Wiki, Reactome, and KEGG pathway databases (right). (c) Box and whiskers plots for gene expression of Th17/IL-17-inducing genes in the TCGA-SKCM cohort grouped according to BRAF status (n = 197 wt and n = 166 mt biologically independent tumors). Boxplot show the median (line) and interquartile ranges (Tukey whiskers that extend to 1.5 × IQR); p-values represent Mann-Whitney U test. (d) Scatter dot plots for gene expression of Th17/IL-17-inducing genes in the MAPKi dataset (Long et al, Rizos et al, and Kakavand et al datasets: GSE61992, GSE50509, GSE99898 series combined) grouped according to sample collection time point (PRE: before, ON: during therapy). Dots represent biologically independent tissues (n = 47 ON, n = 11 PRE) and are color-coded according to dataset; shown is mean ± 95% CI; p – values are from unpaired t-test. (e) qPCR analysis of BRAF mt (WM9, WM983B, 451Lu) melanoma cells treated with 1 nM dabrafenib/0.2 nM trametinib vs. DMSO for 7 days. Bar plot shows mean ± SEM where single dots represent biologically independent cell lines; p-values are from unpaired t-test. Shown is one representative out of three independently performed experiments. All p-values are two-tailed. mt: mutant, wt: wild-type, GSEA: gene set enrichment analysis, FDR: false discovery rate, NES: normalized enrichment score, TCGA: The Cancer Genome Atlas, SKCM: Skin cutaneous melanoma, MAPKi: mitogen-activated protein kinase inhibitor, IQR: interquartile range. Source data
Extended Data Fig. 2
Extended Data Fig. 2. IL-17A supports anti-tumor effects of dual ICI in mouse melanoma.
(a) Kaplan Meier plot related to Fig. 2a, showing survival of mice. p-values are from log rank test. (b) Extended immunostaining panel related to Fig. 2e showing IL-17A and CD4 positivity in the CM (BRAF wt, ICI-sensitive) mouse model. Corresponding scatter dot plots of immunostaining quantification (n = 5 random fields/whole tumor area normalized to DAPI; n = 2 biologically independent tumors/group). (c) Tumor growth kinetics of YUMM1.7 (BRAF mt, ICI-resistant) melanoma treated with IgG/H2O (control, n = 5), α-CTLA-4 + α-PD-1 (n = 4), α-CTLA-4 + α-PD-1 plus rm-IL-17A (n = 4) according to treatment schedule as depicted. Data points show mean + SEM, and p-values are from 1-way ANOVA with Holm-Sidak’s multiple comparisons test. (d) Corresponding cytokine and chemokine concentrations as quantified by a multiplex cytokine array in endpoint serum samples (day 19). Bar plot shows n = 3 to 6 biologically independent samples/group. Data points show mean + SEM, and p-values are from unpaired t-test. All p-values are two-tailed. Source data
Extended Data Fig. 3
Extended Data Fig. 3. Experimental details of neutrophil in vivo experiments.
(a) Schematic workflow for LC-MS/MS analysis. (b) Flow cytometry gating strategy. (c) Violin plots show the distribution of Ly6G+ neutrophils in blood, spleen, and tumor tissues of mice from Fig. 4a,b. p-values are from 1-way ANOVA with Holm-Sidak’s multiple comparisons test (top panels, CM model) and from Kruskal-Wallis test with Dunn’s multiple comparisons test (bottom panels, YUMMER1.7 model). All p-values are two-tailed. LC-MS/MS: liquid chromatography-mass spectrometry/mass spectrometry. Source data

References

    1. Wolchok JD, et al. Long-term outcomes with nivolumab plus ipilimumab or nivolumab alone versus ipilimumab in patients with advanced melanoma. J. Clin. Oncol. 2022;40:127–137. doi: 10.1200/JCO.21.02229. - DOI - PMC - PubMed
    1. Larkin J, et al. Five-year survival with combined nivolumab and ipilimumab in advanced melanoma. N. Engl. J. Med. 2019;381:1535–1546. doi: 10.1056/NEJMoa1910836. - DOI - PubMed
    1. Zimmer L, et al. Adjuvant nivolumab plus ipilimumab or nivolumab monotherapy versus placebo in patients with resected stage IV melanoma with no evidence of disease (IMMUNED): a randomised, double-blind, placebo-controlled, phase 2 trial. Lancet. 2020;400:1117–1129. - PubMed
    1. Iwakura Y, Ishigame H, Saijo S, Nakae S. Functional specialization of interleukin-17 family members. Immunity. 2011;34:149–162. doi: 10.1016/j.immuni.2011.02.012. - DOI - PubMed
    1. Yao, Z. et al. Human IL-17: a novel cytokine derived from T cells. J. Immunol.155, 5483–5486 (1995). - PubMed

Publication types

MeSH terms