. 2023 Jul 31;21(1):163.
doi: 10.1186/s12915-023-01661-8.

Expanded olfactory system in ray-finned fishes capable of terrestrial exploration

Affiliations

Expanded olfactory system in ray-finned fishes capable of terrestrial exploration

Demian Burguera et al. BMC Biol. .

Abstract

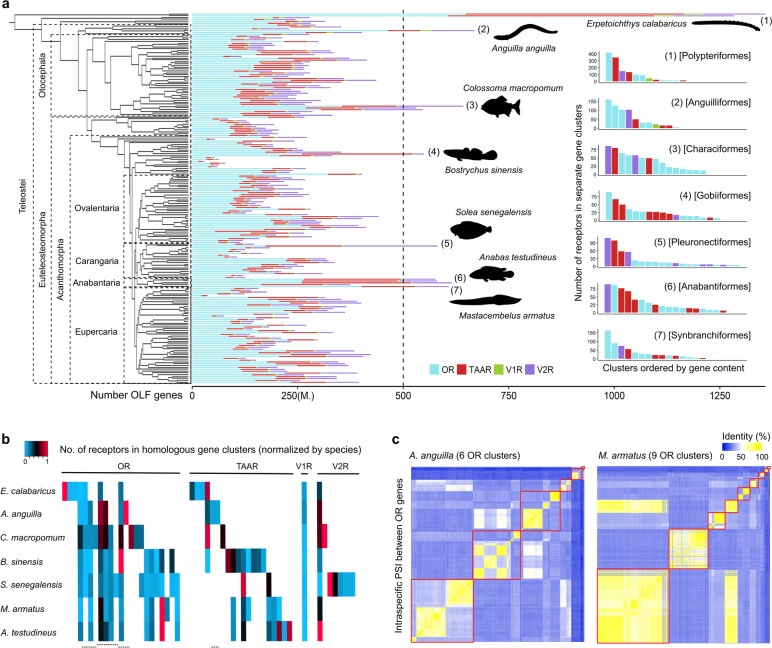
Background: Smell abilities differ greatly among vertebrate species due to distinct sensory needs, with exceptional variability reported in the number of olfactory genes and the size of the odour-processing regions of the brain. However, key environmental factors shaping genomic and phenotypic changes linked to the olfactory system remain difficult to identify at macroevolutionary scales. Here, we investigate the association between diverse ecological traits and the number of olfactory chemoreceptors in approximately two hundred ray-finned fishes.

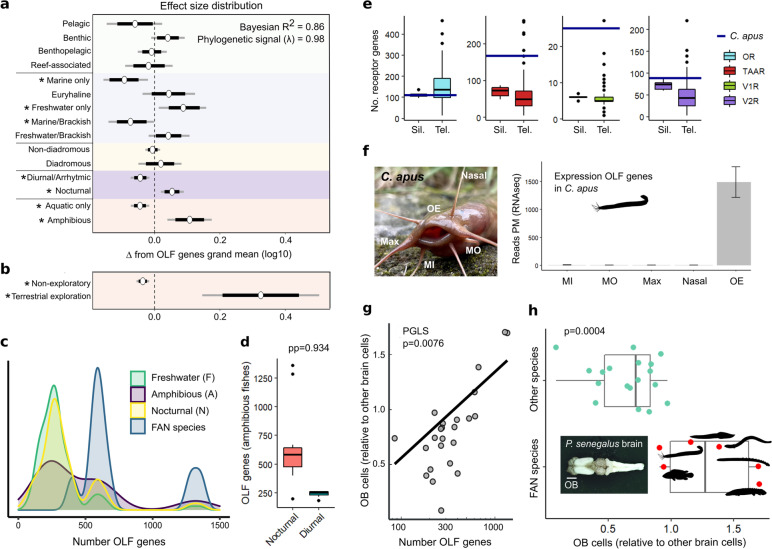
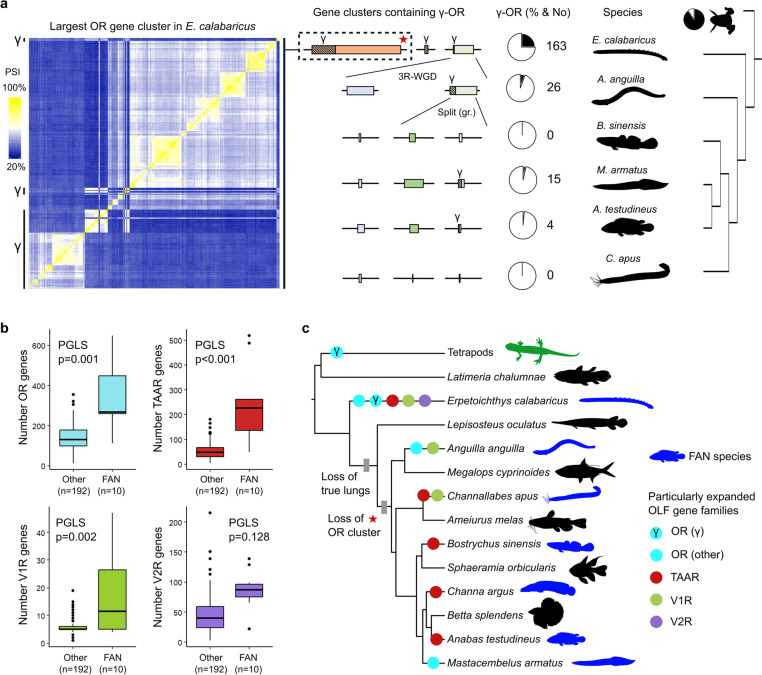
Results: We found independent expansions producing large gene repertoires in several lineages of nocturnal amphibious fishes, generally able to perform active terrestrial exploration. We reinforced this finding with on-purpose genomic and transcriptomic analysis of Channallabes apus, a catfish species from a clade with chemosensory-based aerial orientation. Furthermore, we also detected an augmented information-processing capacity in the olfactory bulb of nocturnal amphibious fishes by estimating the number of cells contained in this brain region in twenty-four actinopterygian species.

Conclusions: Overall, we report a convergent genomic and phenotypic magnification of the olfactory system in nocturnal amphibious fishes. This finding suggests the possibility of an analogous evolutionary event in fish-like tetrapod ancestors during the first steps of the water-to-land transition, favouring terrestrial adaptation through enhanced aerial orientation.

Keywords: Amphibious fishes; Evolutionary transition; Olfactory receptors; Sensory evolution.


Conflict of interest statement

The authors declare that they have no competing interests.

Figures

Fig. 1
Fig. 1
Independent OLF gene expansions in ray-finned fishes. a Total number of OLF genes in 201 ray-finned fish species, coloured by gene family (Additional file 2: Table S1). Median value is indicated (M.). Right, number of OR, TAAR, V1R and V2R receptors found in different genomic clusters for those species with the higher number of genes within each of the taxonomic orders presenting more than 500 OLF genes (Additional file 2: Table S2). Loci containing less than five receptor genes are excluded for visualization purposes. b Number of receptor genes in each genomic cluster, normalized by species. Homologous gene clusters (cells) are displayed in columns. White cells represent the absence of homologous gene clusters. Dashed lines indicate clusters of traceable homologous origin physically separated by genomic rearrangements. Loci containing less than five receptor genes in all species are excluded from the plot. c Heatmaps showing intraspecific pairwise sequence identity (PSI) between individual OR receptors plotted following their genomic order in the European eel (A. anguilla) and zig-zag eel (M. armatus). Gene clusters are delimited by red squares. While higher sequence identity is generally restricted to receptors from the same clusters, the zig-zag eel presents a lineage-specific cluster containing OR genes very similar to the ones located in the larger locus. Loci containing less than five OR genes are excluded
Fig. 2
Fig. 2
OLF genes transcriptomic abundances affected by gene cluster dynamics. a Relative transcriptomic abundance of each OLF family in the olfactory organ of eight sequenced species. Species in the plot are, from top to bottom: Anguilla Anguilla: 669 genes, Pygocentrus nattereri: 530 genes, Electrophorus electricus: 332 genes, Thymallus thymallus: 85 genes, Salmo trutta: 183 genes, Thalassophryne amazonica, 141 genes, Anabas testudineus: 615 genes and Mastacembelus armatus: 608 genes. Expression values correspond to the mean of two biological replicates in each species. b Relative repertoire size and its transcriptomic abundance is shown for each family from the eight described species. Gray line indicates a hypothetical perfect correspondence. c Proportion of individual receptors accumulating half of the total OLF gene expression is indicated with dashed lines for each species. Values range from around 15% in the brown trout (S. trutta) to approximately 20% in the climbing perch (A. testudineus). d Relative gene expression levels of individual receptors in three selected species displayed in genomic order within clusters. Gene families are coloured as in panels a and b. Median value is indicated by a dashed line. OLF gene clusters are highlighted in white and light grey alternatively. On top, heatmaps showing the percentage of global accumulated OLF expression (AcEx) and average per gene expression (AvEx) in each gene cluster
Fig. 3
Fig. 3
Ecological factors influencing the evolution of the OLF gene repertoire in ray-finned fishes. a, b Effect size distribution of several ecological traits on the number of OLF genes, showing highest density intervals (HDI) of 80% (black) and 95% (grey). Colours delimit related factors containing exclusive sets of species. Statistical significance (95% HDI does not include 0) is marked with an asterisk (Additional file 2: Table S4-S6). c Density plot with the number of OLF genes in non-exclusive ecological groups (freshwater, n = 125; amphibious, n = 19; nocturnal, n = 62), plus a subset of fishes presenting the three aforementioned traits (FAN, n = 9). d Differences in the OLF repertoire size between nocturnal (n = 11) and diurnal (n = 8) amphibious fishes. Posterior probability (pp) of nocturnal being higher than diurnal is indicated. e Number of genes for each receptor family identified in our genome assembly of Channallabes apus (C. apus), compared to other Siluriformes (Sil.; n = 9) and teleosts (Tel.; n = 195). f Left, picture of C. apus showing the position of the olfactory epithelium (OE) and the four types of barbels: nasal, maxillary (Max), mandibular outer (MO) and mandibular inner (MI). Right, number of RNA-seq reads per million (PM) from barbels and OE mapped to annotated OLF genes in C. apus (SD shown). g PGLS model showing a significant correlation between the number of OLF genes and the covariance in the number of OB and other brain cells (Additional file 2: Table S7) in twenty-four species (x-axis is log-transformed). h Significantly higher proportion of OB cells in FAN species (n = 6) compared to the other fish species (n = 18) after phylogenetic and brain size correction
Fig. 4
Fig. 4
γ-OR genes scarcity in amphibious teleosts after gene cluster loss. a Evolutionary comparison of homologous gene clusters containing γ-OR genes in a subset of FAN species (one per taxonomic order), showing the highest number and proportion of this receptor subtype in the bichirs. Analysed teleost species present reduced or absent γ-OR repertoires, restricted to a unique gene cluster. Left, pairwise sequence identity (PSI) at the protein level between receptors from the largest gene OR cluster in the ropefish (E. calabaricus). Regions containing γ-OR genes are marked. Middle, boxes represent the relative size of gene clusters homologous to those containing γ-ORs in the bichirs. The proportion of γ-ORs (hatched) is also at scale. The third round of whole genome duplication (3R-WGD) at the base of the teleost clade and a genomic rearrangement (gr.) in clupeocephalans are indicated. The proportion of γ-OR in pie charts is calculated over the complete OR repertoire in each species. Dominant γ-OR proportion in an amphibian outgroup is also shown (Xenopus tropicalis). E. calabaricus and Xenopus silhouettes were downloaded from http://phylopic.org/. b Boxplots showing gene numbers for each of the OLF receptor families separately. Taking into account phylogeny (PGLS), significant differences are detected between FAN species (n = 10, Additional file 2: Table S8) versus the rest (n = 192) in three out of four OLF gene families (OR, TAAR and V1R). c Diagram depicting those OLF gene families particularly expanded in different FAN lineages (according to outlier species in Additional file 1: Fig. S2a and Fig. 3e). One representative organism for each taxonomic family that includes FAN species is shown. Gray boxes mark relevant events with potential influence in the proposed evolutionary scenario. A red star is used to reference the largest OR gene cluster found in the bichirs. Tetratpoda, L. chalumnae, L. oculatus, M. cyprinoides, A. melas, S. orbicularis and B. splendens silhouettes were downloaded from http://phylopic.org/

References

    1. Imai T, Sakano H. Odorant receptor gene choice and axonal projection in the mouse olfactory system. Results Probl Cell Differ. 2009 doi: 10.1007/400_2008_3. - DOI - PubMed
    1. Saraiva LR, Ahuja G, Ivandic I, Syed AS, Marioni JC, Korsching SI, et al. Molecular and neuronal homology between the olfactory systems of zebrafish and mouse. Sci Rep. 2015;5:11487. doi: 10.1038/srep11487. - DOI - PMC - PubMed
    1. Dang P, Fisher SA, Stefanik D, Kim J, Raper JA. Coordination of olfactory receptor choice with guidance receptor expression and function in olfactory sensory neurons. PLoS Genet. 2018 doi: 10.1371/journal.pgen.1007164. - DOI - PMC - PubMed
    1. Iwaniuk AN. 1.18 - Functional Correlates of Brain and Brain Region Sizes in Nonmammalian Vertebrates. In: Kaas JHBT-E of NS, editor. 2nd ed. Oxford: Academic Press; 2017. p. 335–48.
    1. Zelenitsky DK, Therrien F, Ridgely RC, McGee AR, Witmer LM. Evolution of olfaction in non-avian theropod dinosaurs and birds. Proc R Soc B Biol Sci. 2011;278:3625–3634. doi: 10.1098/rspb.2011.0238. - DOI - PMC - PubMed

Publication types

LinkOut - more resources