. 2023 Aug 1;133(15):e167629.
doi: 10.1172/JCI167629.

Regulation of antigen-specific T cell infiltration and spatial architecture in multiple myeloma and premalignancy

Affiliations

Regulation of antigen-specific T cell infiltration and spatial architecture in multiple myeloma and premalignancy

M Hope Robinson et al. J Clin Invest. .

Abstract

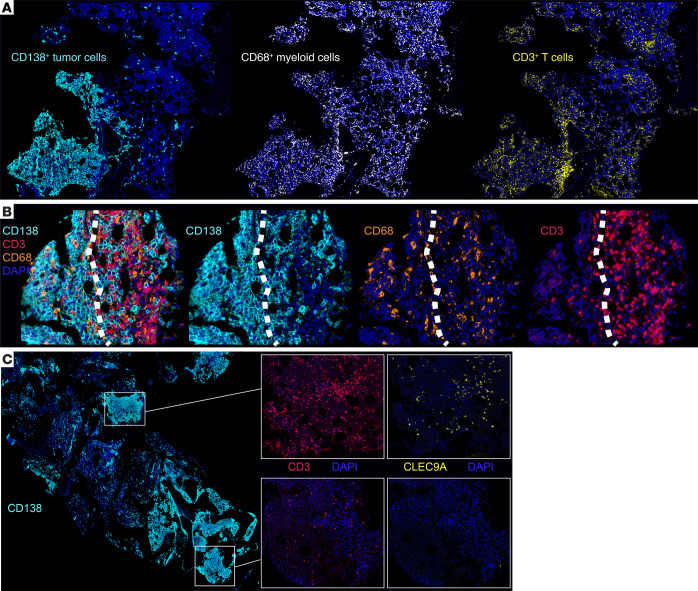
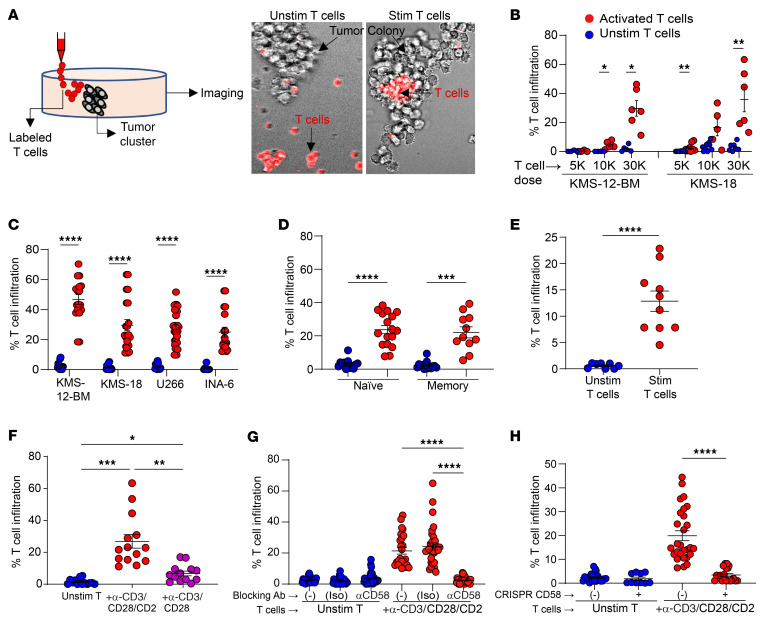
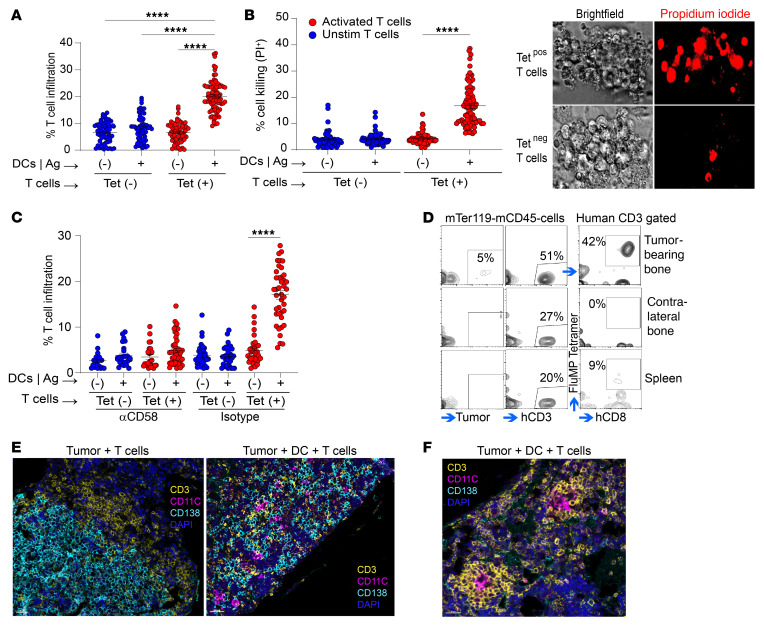
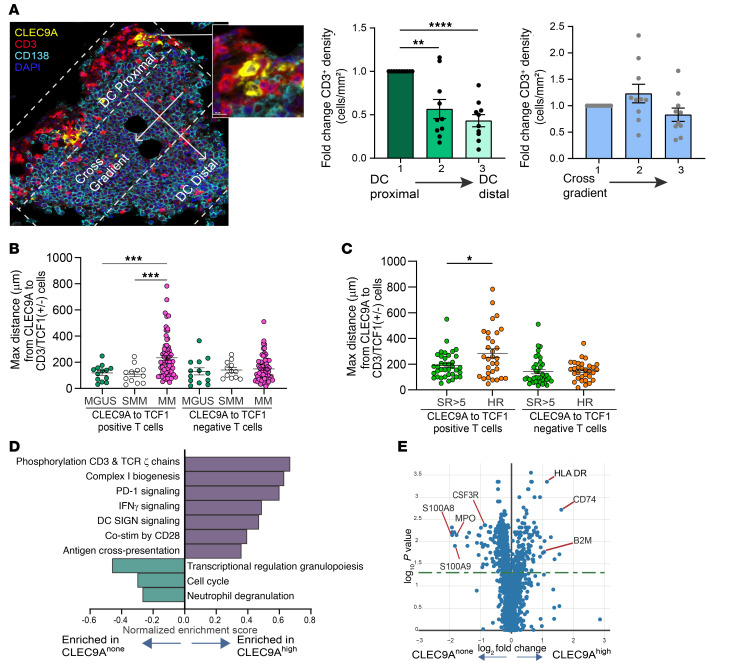
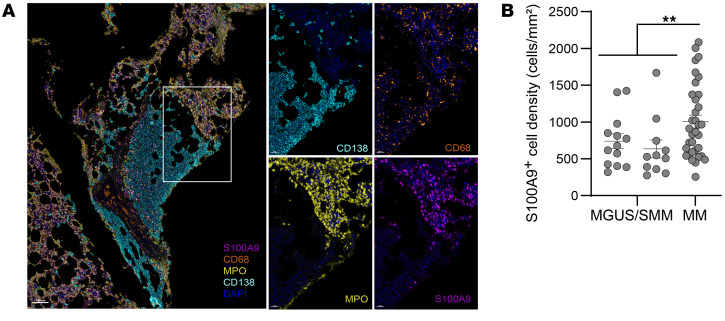
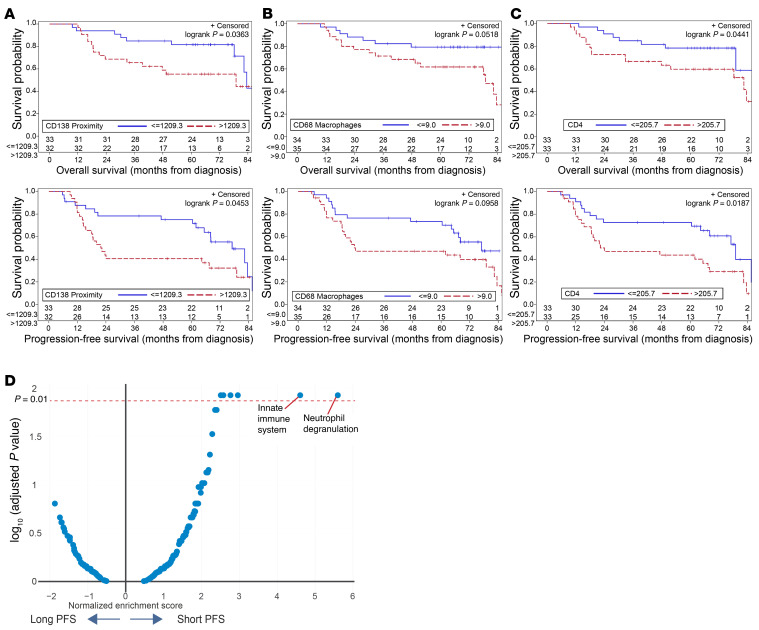
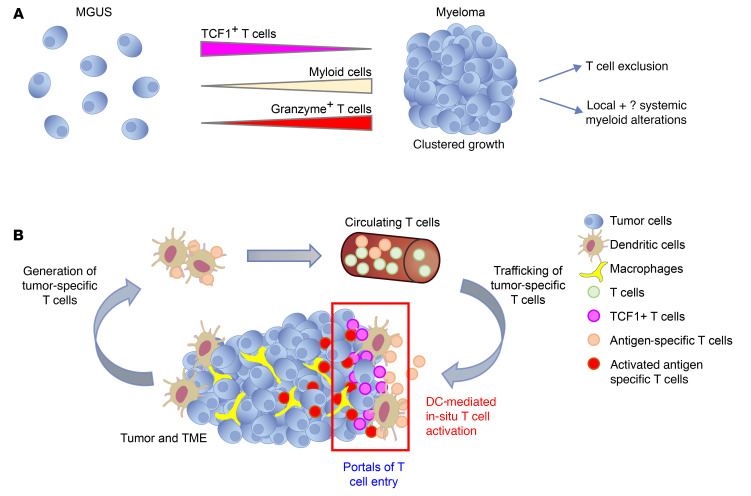
Entry of antigen-specific T cells into human tumors is critical for immunotherapy, but the underlying mechanisms are poorly understood. Here, we combined high-dimensional spatial analyses with in vitro and in vivo modeling to study the mechanisms underlying immune infiltration in human multiple myeloma (MM) and its precursor monoclonal gammopathy of undetermined significance (MGUS). Clustered tumor growth was a feature of MM but not MGUS biopsies, and this growth pattern was reproduced in humanized mouse models. MM biopsies exhibited intralesional as well as spatial heterogeneity, with coexistence of T cell-rich and T cell-sparse regions and the presence of areas of T cell exclusion. In vitro studies demonstrated that T cell entry into MM clusters was regulated by agonistic signals and CD2-CD58 interactions. Upon adoptive transfer, antigen-specific T cells localized to the tumor site but required in situ DC-mediated antigen presentation for tumor entry. C-type lectin domain family 9 member A-positive (CLEC9A+) DCs appeared to mark portals of entry for gradients of T cell infiltration in MM biopsies, and their proximity to T cell factor 1-positive (TCF1+) T cells correlated with disease state and risk status. These data illustrate a role for tumor-associated DCs and in situ activation in promoting the infiltration of antigen-specific T cells in MM and provide insights into spatial alterations in tumor/immune cells with malignant evolution.

Keywords: Adaptive immunity; Cancer immunotherapy; Hematology; Immunology.


Figures

Figure 1
Figure 1. Spatial heterogeneity of immune infiltration in MM.
mIF staining was performed on FFPE sections from 95 patient samples (MGUS n = 13; SMM n = 12; MM n = 70) (see Methods and Supplemental Figure 2 for staining panels). (A) Representative IHC images (original magnification, ×4) showing the patchy nature of the CD138+ tumor infiltration compared with the diffuse infiltration of CD68+ myeloid cells and the nonuniform pattern of T cell infiltration. (B) T cell exclusion: Representative IHC images (original magnification, ×30) showing accumulation of T cells at the tumor edge, but infiltration of CD68+ myeloid cells. White dotted lines indicate the tumor edge. (C) Intralesional heterogeneity showing T cell–rich and T cell–poor areas coexisting in the same biopsy specimen. T cell–rich hotspots are associated with infiltration of CLEC9A+ DCs. Original magnification, ×2 (lower-powered view) and ×14 (insets).
Figure 2
Figure 2. Entry of T cells into MM tumor clusters: effect of agonistic signaling and the CD2/CD58 axis.
(A) Outline of the experimental model. Unstimulated (Unstim) and stimulated (Stim) T cells were placed adjacent to MM tumor clusters in methylcellulose. T cell infiltration was quantified as the proportion of the colony area infiltrated by fluorescence-labeled T cells. (B and C) Effect of preactivation of T cells with α-CD3/CD28/CD2 on T cell infiltration into tumor clusters. n = 4–28 clusters per condition. (B) Dose-dependent entry of T cells. (C) Entry into different MM cell line clusters. (D) Infiltration of naive versus memory T cells. Unstimulated or α-CD3/CD28/CD2–stimulated naive or memory T cells (n = 30,000 cells) were placed adjacent to KMS-18 clusters. n = 11–17. (E) Entry of autologous T cells into primary MM tumor clusters. Unstimulated or α-CD3/CD28/CD2–stimulated CD3+ bone marrow T cells (n = 100,000 cells) were placed adjacent to primary CD138+ clusters. n = 8–10. (F) Effect of preactivation with α-CD3/CD28 antibodies with or without α-CD2 antibody. n = 12–21. (G) Effect of α-CD58–blocking antibodies. U266 MM colonies were pretreated with α-CD58 or IgG1κ isotype control (Iso) or were untreated (–) prior to addition of unstimulated or α-CD3/CD28/CD2–stimulated T cells. T cell infiltration was analyzed as in A. n = 22–34. (H) Effect of CRISPR-mediated knockdown of CD58. Panel shows infiltration of unstimulated or α-CD3/CD28/CD2–stimulated T cells in U266 MM cells with or without CRISPR-mediated CD58 knockdown. n = 10–28. Data in B–H show the mean ± SEM. Each dot represents a distinct tumor cluster, and data were pooled from a minimum of 3 replicate experiments. *P < 0.05, **P < 0.01, ***P < 0.001, and ****P < 0.0001, by Brown-Forsythe and Welch’s ANOVA test with Dunnett’s T3 multiple-comparison test (D and F–H) and Mann-Whitney U test (B, C, and E).
Figure 3
Figure 3. DC-mediated antigen presentation and T cell entry.
(AC) Effects of DCs on in vitro T cell infiltration. U266-MP colonies were injected with MP-pulsed HLA-A2+ mo-DCs (or unpulsed DCs as controls) followed by injection of MP-specific HLA-A2-tetramer+ T cells (tetramer T cells as a control) after 4 hours. T cell entry was quantified after overnight culture. For some experiments clusters were also labeled with PI to assess tumor cell lysis. (A) Effect of DC-mediated antigen (Ag) presentation on entry of antigen-specific T cells. n = 59–85. (B) PI staining showing killing of MM colonies. n = 54–89. (C) Effect of CD58 blockade on entry of antigen-specific T cells. n = 21–44. Data show the mean ± SEM. Each dot represents a distinct tumor cluster, and data were pooled from a minimum of 3 independent experiments. ****P < 0.0001, by Kruskal-Wallis test with Dunn’s multiple-comparison test (AC). (DF) Effects of DCs on in vivo T cell infiltration. U266-MP-rluc cells were first engrafted intrafemorally into MISTRG6 mice either as tumor cells alone, or with MP-pulsed, mo-DCs from an HLA-A2+ donor. Tumor growth was documented by IVIS, and mice were injected with T cells from the same donor, which had been previously expanded ex vivo using MP-pulsed DCs. mIF images are representative of 5 experiments with 3–7 mice per group. (D) Flow cytometric analysis showing selective enrichment of A2-MP-tetramer+ T cells at the tumor site. Note that most of the T cells in the spleen are tetramer. (E) IHC images showing that T cells localizing to the tumor site did not efficiently enter the tumor clusters in tumors without human DCs (original magnification, ×24), but these T cells did so when the tumors contained DCs (original magnification, ×20). (F) Representative T cell clusters in bones of mice with tumor-associated DCs (original magnification, ×39.3). Tet, tetramer.
Figure 4
Figure 4. Spatial relationships between CLEC9A DCs and T cells.
(A) CLEC9A+ DCs and T cell gradients. Representative IHC panel shows hotspot containing T cells and CLEC9A+ DCs (original magnification, ×20; inset, ×119). In order to quantify the relationship between DCs and T cell gradients within MM tumors, T cell density was measured in tumor clusters in regions proximal or distal to CLEC9A+ DCs. T cell density within a cross-gradient in the same cluster served as a control. Bar graphs represent the fold change (mean ± SEM) relative to the proximal zone. Significance was determined by repeated-measures 1-way ANOVA with the Geisser-Greenhouse correction and Dunnett’s multiple-comparison test, with individual variances computed for each comparison. Each dot represents a gradient zone in a ROI (n = 10 regions from 6 patient samples). (B) Proximity of CLEC9A+ DCs and TCF1+/– T cells by disease type: Plot shows maximum (Max) distance (in μm) between CLEC9A+ DCs and TCF1+ or TCF1 T cells in MM (n = 70), SMM (n = 12), or MGUS (n = 13). (C) Proximity of CLEC9A+ DCs and TCF1+ or TCF1 T cells by disease risk. Plot shows maximum distance (in μm) between CLEC9A+ DCs and TCF1+ or TCF T cells in patients with HR MM (HR cytogenetics or PFS <2 years) versus DCs from non-HR patients. Standard risk (SR), n = 37; HR n = 31. Graphs in B and C show the maximum ± SEM. Each dot represents a unique patient or sample. *P < 0.05, **P < 0.01, ***P < 0.001, and ****P < 0.0001, by Brown-Forsythe and Welch’s ANOVA test with Dunnett’s T3 multiple-comparison test. (D and E) NanoString DSP analysis of CLEC9Ahi versus CLEC9Anone lesions. mIF on serial sections was performed to identify CLEC9Ahi (12 ROIs) versus CLEC9Anone (n = 24 ROIs). (D) Graph shows the top differentially enriched pathways between CLEC9Ahi and CLEC9Anone ROIs. (E) Volcano plot shows DEGs between CLEC9Ahi and CLEC9Anone ROIs.
Figure 5
Figure 5. Spatial architecture of the myeloid compartment.
mIF was performed on FFPE sections (see Methods and Supplemental Figure 2 for multiplex panel BM3 used for staining). (A) Representative IHC images show a pattern of staining for S100A9, MPO, CD68, and CD138 in MM bone marrow. Note that while CD68+ myeloid cells infiltrated CD138+ tumor clusters, S100A9+ myeloid and MPO+ myeloid/neutrophilic cells were predominantly located outside the tumor clusters (original magnification, ×8; insets, ×28.8). (B) S100A9+ cell density in MGUS, SMM, and MM. Bar graphs show the mean ± SEM. Each dot represents a unique patient/sample. MGUS n = 13; SMM n = 11; MM n = 34. **P < 0.01, by unpaired t test with Welch’s correction.
Figure 6
Figure 6. Immune infiltration and clinical outcomes in MM.
(AC) Kaplan-Meier plots showing OS and PFS in MM cohorts, split based on selected variables as in Table 1. Variables are split at the median for the cohorts. (A) CD138 proximity (based on the maximum number of CD138+ tumors cells within a 1,000 μm radius) and OS/PFS in the MM cohort. (B) CD68 expression and OS/PFS in the MM cohort. (C) CD4+ T cell density and OS/PFS in the MM cohort. (D) Pathways for DEGs in tumor-sparse regions by PFS: mIF was performed to first identify tumor-sparse ROIs. NanoString DSP analysis was performed to identify DEGs by PFS in tumor-sparse ROIs. Volcano plot shows differential pathways for DEGs in tumor-sparse ROIs between patients with short (<2 yr) (n = 11) or long (>5 yr) (n = 13) PFS.
Figure 7
Figure 7. Proposed models.
(A) Cluster formation and immune changes with malignant transition. Evolution from MGUS to MM is accompanied by a tumor-intrinsic capacity to form clusters. This transition is accompanied by loss of TCF1+ stem memory–like T cells, increased GZMB+ effector T cells, as well as alterations in the myeloid compartment. Clustered tumor growth sets the stage for T cell exclusion and spatial immune escape during malignant transition. (B) Role for DC-mediated antigen presentation in T cell entry. The cancer immunity cycle, as initially proposed, consisted of an afferent phase involving the generation of antigen-specific T cells by DCs and an efferent phase involving killing of tumor cells by tumor-specific T cells. Data in this study support an additional role for tumor-associated DCs (red boxed area), where the entry of antigen-specific T cells into tumor clusters depends on antigen-specific activation of T cells in situ by professional APCs. Hence, T cell infiltration into MM tumors is not random but occurs through portals of entry and antigen presentation hotspots containing antigen-presenting DCs. TCF1+ T cells are found in proximity to CLEC9A+ DCs, and the proximity of these cell types correlates with disease stage and risk.

References

    1. Braun DA, Wu CJ. Tumor-infiltrating T cells - a portrait. N Engl J Med. 2022;386(10):992–994. doi: 10.1056/NEJMcibr2119477. - DOI - PubMed
    1. Dhodapkar MV. MGUS to myeloma: a mysterious gammopathy of underexplored significance. Blood. 2016;128(23):2599–2606. doi: 10.1182/blood-2016-09-692954. - DOI - PMC - PubMed
    1. Dhodapkar MV, et al. Vigorous premalignancy-specific effector T cell response in the bone marrow of patients with monoclonal gammopathy. J Exp Med. 2003;198(11):1753–1757. doi: 10.1084/jem.20031030. - DOI - PMC - PubMed
    1. Dhodapkar MV, et al. T cells from the tumor microenvironment of patients with progressive myeloma can generate strong, tumor-specific cytolytic responses to autologous, tumor-loaded dendritic cells. Proc Natl Acad Sci U S A. 2002;99(20):13009–13013. doi: 10.1073/pnas.202491499. - DOI - PMC - PubMed
    1. Dhodapkar MV. The immune system in multiple myeloma and precursor states: lessons and implications for immunotherapy and interception. Am J Hematol. 2022;98(suppl_2):4–12 . - PMC - PubMed

Publication types