

A generalized Kirkwood implicit solvent for the polarizable AMOEBA protein model
- PMID: 37526158
- PMCID: PMC10396400
- DOI: 10.1063/5.0158914
A generalized Kirkwood implicit solvent for the polarizable AMOEBA protein model
Abstract
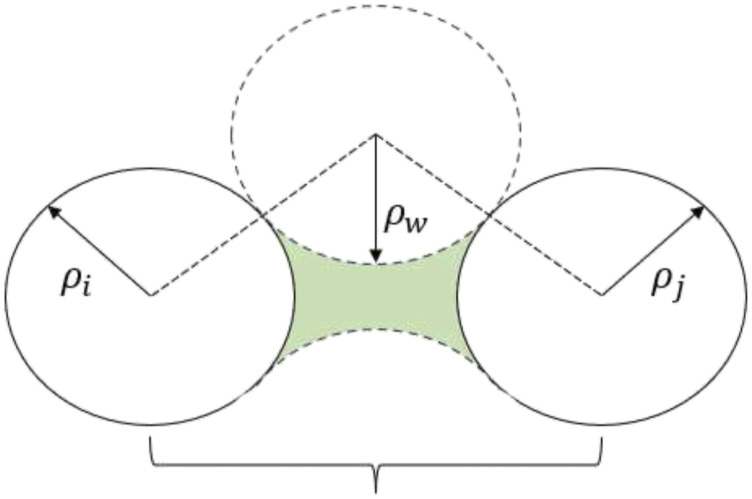
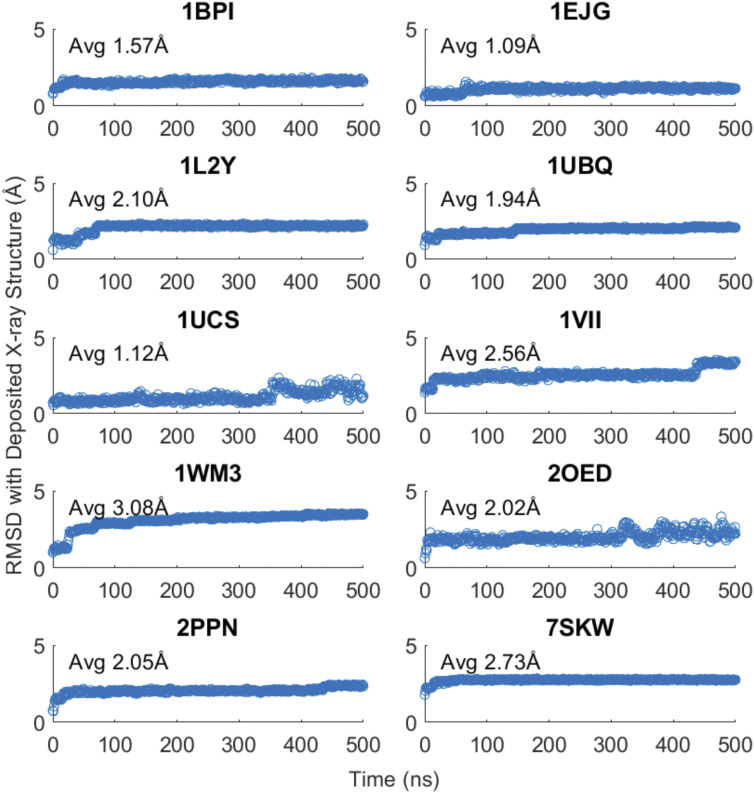
Computational simulation of biomolecules can provide important insights into protein design, protein-ligand binding interactions, and ab initio biomolecular folding, among other applications. Accurate treatment of the solvent environment is essential in such applications, but the use of explicit solvents can add considerable cost. Implicit treatment of solvent effects using a dielectric continuum model is an attractive alternative to explicit solvation since it is able to describe solvation effects without the inclusion of solvent degrees of freedom. Previously, we described the development and parameterization of implicit solvent models for small molecules. Here, we extend the parameterization of the generalized Kirkwood (GK) implicit solvent model for use with biomolecules described by the AMOEBA force field via the addition of corrections to the calculation of effective radii that account for interstitial spaces that arise within biomolecules. These include element-specific pairwise descreening scale factors, a short-range neck contribution to describe the solvent-excluded space between pairs of nearby atoms, and finally tanh-based rescaling of the overall descreening integral. We then apply the AMOEBA/GK implicit solvent to a set of ten proteins and achieve an average coordinate root mean square deviation for the experimental structures of 2.0 Å across 500 ns simulations. Overall, the continued development of implicit solvent models will help facilitate the simulation of biomolecules on mechanistically relevant timescales.
© 2023 Author(s). Published under an exclusive license by AIP Publishing.
Conflict of interest statement
J. W. Ponder and P. Ren are cofounders of Qubit Pharmaceuticals.
Figures


Similar articles
-
Implicit Solvents for the Polarizable Atomic Multipole AMOEBA Force Field.J Chem Theory Comput. 2021 Apr 13;17(4):2323-2341. doi: 10.1021/acs.jctc.0c01286. Epub 2021 Mar 26. J Chem Theory Comput. 2021. PMID: 33769814 Free PMC article.
-
Accuracy comparison of several common implicit solvent models and their implementations in the context of protein-ligand binding.J Mol Graph Model. 2017 Mar;72:70-80. doi: 10.1016/j.jmgm.2016.12.011. Epub 2016 Dec 21. J Mol Graph Model. 2017. PMID: 28064081 Free PMC article.
-
Generalized Born Implicit Solvent Models for Biomolecules.Annu Rev Biophys. 2019 May 6;48:275-296. doi: 10.1146/annurev-biophys-052118-115325. Epub 2019 Mar 11. Annu Rev Biophys. 2019. PMID: 30857399 Free PMC article. Review.
-
Recent advances in implicit solvent-based methods for biomolecular simulations.Curr Opin Struct Biol. 2008 Apr;18(2):140-8. doi: 10.1016/j.sbi.2008.01.003. Epub 2008 Mar 4. Curr Opin Struct Biol. 2008. PMID: 18304802 Free PMC article. Review.
-
A new set of atomic radii for accurate estimation of solvation free energy by Poisson-Boltzmann solvent model.J Comput Chem. 2014 Nov 5;35(29):2132-9. doi: 10.1002/jcc.23728. Epub 2014 Sep 15. J Comput Chem. 2014. PMID: 25220475 Free PMC article.
Cited by
-
Force Field X: A computational microscope to study genetic variation and organic crystals using theory and experiment.J Chem Phys. 2024 Jul 7;161(1):012501. doi: 10.1063/5.0214652. J Chem Phys. 2024. PMID: 38958156 Free PMC article.
-
Constant-pH Simulations with the Polarizable Atomic Multipole AMOEBA Force Field.J Chem Theory Comput. 2024 Apr 9;20(7):2921-2933. doi: 10.1021/acs.jctc.3c01180. Epub 2024 Mar 20. J Chem Theory Comput. 2024. PMID: 38507252 Free PMC article.
References
MeSH terms
Substances
Grants and funding
LinkOut - more resources
Full Text Sources
Miscellaneous