. 2023 Sep 22;51(17):9397-9414.
doi: 10.1093/nar/gkad637.

The induction of p53 correlates with defects in the production, but not the levels, of the small ribosomal subunit and stalled large ribosomal subunit biogenesis

Affiliations

The induction of p53 correlates with defects in the production, but not the levels, of the small ribosomal subunit and stalled large ribosomal subunit biogenesis

Matthew John Eastham et al. Nucleic Acids Res. .

Abstract

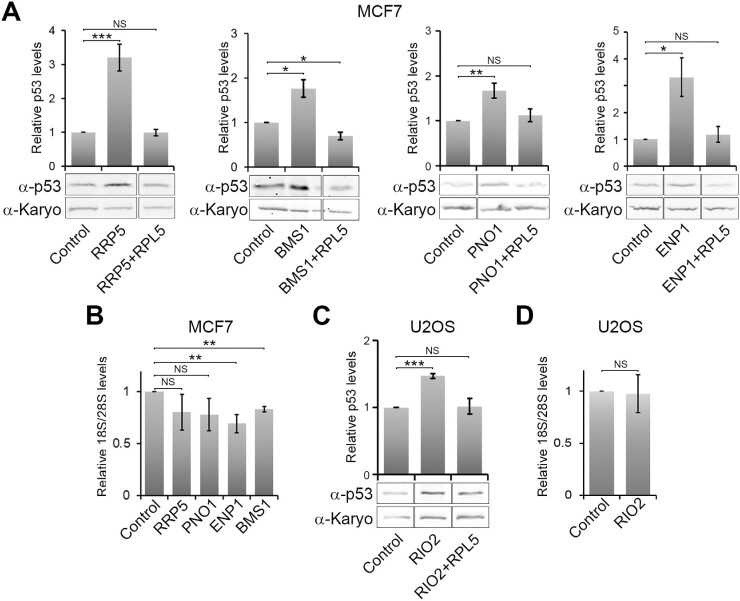
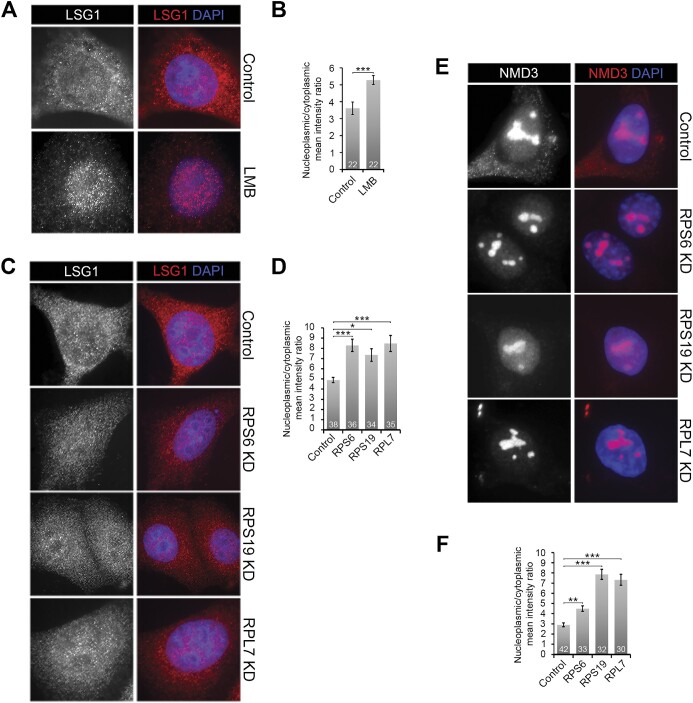
Ribosome biogenesis is one of the biggest consumers of cellular energy. More than 20 genetic diseases (ribosomopathies) and multiple cancers arise from defects in the production of the 40S (SSU) and 60S (LSU) ribosomal subunits. Defects in the production of either the SSU or LSU result in p53 induction through the accumulation of the 5S RNP, an LSU assembly intermediate. While the mechanism is understood for the LSU, it is still unclear how SSU production defects induce p53 through the 5S RNP since the production of the two subunits is believed to be uncoupled. Here, we examined the response to SSU production defects to understand how this leads to the activation of p53 via the 5S RNP. We found that p53 activation occurs rapidly after SSU production is blocked, prior to changes in mature ribosomal RNA (rRNA) levels but correlated with early, middle and late SSU pre-rRNA processing defects. Furthermore, both nucleolar/nuclear LSU maturation, in particular late stages in 5.8S rRNA processing, and pre-LSU export were affected by SSU production defects. We have therefore uncovered a novel connection between the SSU and LSU production pathways in human cells, which explains how p53 is induced in response to SSU production defects.


Figures

Graphical Abstract
Graphical Abstract
Figure 1.
Figure 1.
Ribosome biogenesis and p53 regulation. Schematic representation of human ribosome biogenesis, showing pre-rRNA processing and the probes used for northern blotting, and where in the cell the various processing steps are predicted to take place. Also shown is the formation of the 5S RNP and its integration into the LSU, and how the 5S RNP regulates the levels of p53 through regulation of the ubiquitin ligase MDM2. Ub – ubiquitin.
Figure 2.
Figure 2.
Blocking both SSU and LSU production does not always result in an increase in p53 levels over the single knockdowns. (A–C) Ribosomal proteins, either alone or combinations of SSU and LSU proteins, were depleted for 48 h using siRNAs, as indicated above each lane, in MCF7 and U2OS cells (as indicated above each panel). The proteins from the knockdown cells were then analysed by SDS-PAGE followed by western blotting using antibodies that recognise p53, p21 and karyopherin (Karyo; loading control) as indicated on the left of each panel. The average levels of p53 from three separate experiments, relative to karyopherin and normalised to the control siRNA, are plotted below the western blot panels. Error bars show standard error (SEM). Statistical analyses were performed using an unpaired t-test. (D) U2OS knockdown cells or cells treated overnight with ActD (5 ng/ml), were fixed using 70% ethanol and the DNA was stained using propidium iodide. Cell cycle analysis was performed using the FACS Canto II flow cytometer. The graphs represent the average percentage level of G0/G1 (blue), S (orange) or G2/M (grey) phase from three independent repeat experiments. Error bars represent standard error (SEM), and statistical analysis was performed using an unpaired t-test. For each cell cycle phase, control cell data were compared to the data from ActD-treated or knockdown cells, respectively. Additional statistical analysis of the single vs double knockdowns is shown below. NS – not significant (>0.05); * P< 0.05; **P< 0.01; *** P< 0.001.
Figure 3.
Figure 3.
p53 induction after blocking SSU production is rapid and correlates with pre-rRNA processing defects, but not with changes in mature rRNA levels. (A) MCF7 cells were transfected with control siRNAs or siRNAs targeting either RPS6 or RPS19. Cells were harvested at 3, 6 or 10 h after transfection and then proteins from each knockdown analysed by SDS-PAGE followed by western blotting using antibodies that recognise p53, and karyopherin (Karyo; loading control) as indicated on the left of each panel. The average levels of p53 from three separate experiments, relative to karyopherin and normalised to the control siRNA, are plotted above the western blot panels. Error bars show standard error (SEM). (B) MCF7 cells were transfected with control siRNAs or siRNAs targeting either RPS6, RPL5 or both. Cells were harvested 6 h after transfection and then analysed as in panel A. Error bars show standard error (SEM). (C) RNA was extracted from the MCF7 cells transfected in panel A and separated by glyoxal agarose gel electrophoresis followed by northern blotting using probes specific for ITS1 (upper panel), 5′ ITS1 (18SE) and for the mature 28S and 18S rRNAs. The identity of the RNAs detected is indicated on the left of each panel. (D) The levels of 18S rRNA detected in panel C were calculated, relative to 28S rRNAs, from three independent repeats and the average levels plotted. Error bars show standard error (SEM). (E) The levels of the 47S/45S, 30S, 21S/21SC and 18SE pre-rRNAs, from panel C, from three independent experiments were calculated, relative to 28S rRNA, and the average relative levels plotted. Error bars show standard error (SEM). (F) RNA was extracted from MCF7 cells transfected for 3 or 6 h with either a scramble antisense oligo (Scr) or ASO targeting the U3 snoRNA and separated by glyoxal agarose gel electrophoresis followed by northern blotting as described in panel C for the upper three panels. For the lower 2 panels, the RNA was separated on an 8% acrylamide/7 M urea gel, transferred to a nylon membrane and probed with probes specific for the U3 snoRNA and the 7SK snRNA (loading control). (G) MCF7 cells were transfected as described in panel F and the levels of p53 and karyopherin (Karyo) determined and plotted as described in panel A. Error bars show standard error (SEM). (H) The levels of 18S rRNA from three independent experiments, from panel F, were calculated, relative to 28S rRNA and the control scramble ASO (Scr), and the average levels plotted. Error bars show standard error (SEM). All statistical analyses were performed using an unpaired t-test, in each case comparing RNA or protein levels from control and knockdown cells. NS – not significant (>0.05); *P< 0.05; **P< 0.01; *** P< 0.001.
Figure 4.
Figure 4.
Blocking all stages of SSU production results in p53 activation in a 5S RNP-dependent manner. MCF7 (AB) and U2OS cells (CD) were transfected with control siRNAs or siRNAs to knock down specific ribosome biogenesis factors, either alone or in combination with RPL5, as indicated below each panel. (A,C) 48 h after transfection, proteins were separated by SDS-PAGE and analysed by western blotting using antibodies that detect p53 and karyopherin (Karyo; loading control) as indicated to the left of each panel. p53 levels, relative to the control knockdown and the loading control, were determined and plotted from three independent experiments. Error bars show standard error (SEM). (B, D) RNA was extracted from the knockdown cells in panels A and C and analysed by glyoxal agarose gel electrophoresis and northern blotting using probes specific for mature 18S and 28S rRNAs (see Supplementary Figure S3B for processing intermediates). Mature 18S rRNA levels, relative to 28S rRNA levels and normalised to the control knockdown, were plotted. Error bars show standard error (SEM). All statistical analyses were performed using an unpaired t-test. NS – not significant (>0.05); *P< 0.05; **P< 0.01; *** P< 0.001.
Figure 5.
Figure 5.
Blocking SSU production results in a defect in pre-LSU export. (A) MCF7 Flp-In cells stably expressing tetracycline-inducible FLAG-RPL27 were transfected for 10 h with control siRNAs or siRNAs targeting the depletion of ribosomal proteins (as indicated on the right of the panels). Cells were also transfected with a scramble antisense oligonucleotide ASO (Scr) or an ASO targeting the U3 snoRNA. 2 h after transfection tetracycline was added to the media to initiate FLAG-RPL27 expression and after 8 h of expression the cells were fixed and analysed by immunofluorescence using antibodies specific to the FLAG-tag and Fibrillarin (nucleolar marker) as indicated at the top of the panels. Cells were also stained with DAPI. (B) Nucleoplasmic and cytoplasmic levels of FLAG-RPL27 were determined for the control and knockdown cells from panel (A). The number of cells analysed for each condition is indicated. The nucleoplasmic/cytoplasmic ratio for each set was calculated and plotted. Error bars show standard error (SEM). Statistical analysis was performed using one-way ANOVA tests. *** P< 0.001. (C) MCF7 FLAG-RPL27 cells, treated or untreated with 20 nM leptomycin B (LMB), were incubated with tetracycline 2 h later and then 8 h later the cells were fixed and analysed as in panel A. (D) Nucleoplasmic and cytoplasmic levels of FLAG-RPL27 were determined for the control and LMB-treated cells in panel C. The number of cells analysed for each condition is indicated. The nucleoplasmic/cytoplasmic ratio for each set was calculated and plotted. Error bars show standard error (SEM). Statistical analysis was performed using one-way ANOVA tests. *** P< 0.001.
Figure 6.
Figure 6.
Blocking SSU production results in the nuclear accumulation of LSU biogenesis factors that shuttle between the nucleus and cytoplasm. (A) MCF7 cells, treated or untreated with 20 nM leptomycin B (LMB) for 10 h, were fixed and analysed by immunofluorescence using an antibody specific to LSG1. Cells were also stained with DAPI. (B) Nuclear and cytoplasmic levels of LSG1 were determined for the control and LMB-treated cells from panel A. The number of cells analysed for each condition is indicated. The nuclear/cytoplasmic ratio for each set was calculated and plotted. Error bars show standard error (SEM). Statistical analysis was performed using one-way ANOVA tests. *** P< 0.001. (C) MCF7 cells were transfected for 10 h with control siRNAs or siRNAs targeting the depletion of ribosomal proteins (as indicated on the right of the panels). The cells were fixed and analysed as described in panel A. (D) Nuclear and cytoplasmic levels of LSG1 were determined for the control and knockdown cells from panel C. The number of cells analysed for each condition is indicated. The nuclear/cytoplasmic ratio for each set was calculated and plotted. Error bars show standard error (SEM). Statistical analysis was performed using one-way ANOVA tests. *P< 0.05; *** P< 0.001. (E) MCF7 cells were transfected for 10 h with control siRNAs or siRNAs targeting the depletion of ribosomal proteins (as indicated on the right of the panels). The cells were fixed and analysed by immunofluorescence using an antibody specific to NMD3. Cells were also stained with DAPI. (F) Nucleoplasmic and cytoplasmic levels of NMD3 were determined for the control and knockdown cells from panel E. The number of cells analysed for each condition is indicated. The nucleoplasmic/cytoplasmic ratio for each set was calculated and plotted. Error bars show standard error (SEM). Statistical analysis was performed using one-way ANOVA tests. **P< 0.01; *** P< 0.001.
Figure 7.
Figure 7.
Defects in SSU production result in a defect in late 5.8S pre-rRNA processing. (AC) MCF7 cells were transfected with control siRNAs, or siRNAs designed to deplete RPS6 and RPS19. In addition, MCF7 cells were treated with 20 nM leptomycin B (LMB). 10 h after transfection or LMB treatment the cells were harvested, RNA extracted and separated on a glyoxal agarose gel (panel A) or an 8% acrylamide / 7M urea gel (panel C) and analysed by northern blotting using probes specific to ITS2 and the mature 18S and 28S rRNAs (panel A) or the 5′ end of ITS2 (Pre-5.8S) and the U17 snoRNA (panel C). The identities of the mature or pre-rRNAs are indicated on the left of each panel and a scheme for the late processing of the 5.8S rRNA with the probes used for northern blotting is shown in panel C. (BD) The levels of the pre-rRNA species from panels A and C relative to the 28S rRNA (panel A) and U17 snoRNA (panel C; loading control) were calculated from three independent repeats and the average levels plotted relative to those seen in control cells. All statistical analyses were performed using an unpaired t-test. Error bars show standard error (SEM). NS – not significant (>0.05); *P< 0.05; **P< 0.01; *** P< 0.001.

Similar articles

Cited by

References

    1. Gamalinda M., Woolford J.L. Jr. Paradigms of ribosome synthesis: lessons learned from ribosomal proteins. Translation (Austin). 2015; 3:e975018. - PMC - PubMed
    1. Lempiainen H., Shore D. Growth control and ribosome biogenesis. Curr. Opin. Cell Biol. 2009; 21:855–863. - PubMed
    1. Teng T., Thomas G., Mercer C.A.. Growth control and ribosomopathies. Curr. Opin. Genet. Dev. 2013; 23:63–71. - PubMed
    1. Warner J.R. The economics of ribosome biosynthesis in yeast. Trends Biochem. Sci. 1999; 24:437–440. - PubMed
    1. Bustelo X.R., Dosil M.. Ribosome biogenesis and cancer: basic and translational challenges. Curr. Opin. Genet. Dev. 2018; 48:22–29. - PubMed

Publication types

MeSH terms