. 2023 Oct;10(28):e2301645.
doi: 10.1002/advs.202301645. Epub 2023 Aug 1.

Adipose METTL14-Elicited N6 -Methyladenosine Promotes Obesity, Insulin Resistance, and NAFLD Through Suppressing β Adrenergic Signaling and Lipolysis

Affiliations

Adipose METTL14-Elicited N6 -Methyladenosine Promotes Obesity, Insulin Resistance, and NAFLD Through Suppressing β Adrenergic Signaling and Lipolysis

Qianqian Kang et al. Adv Sci (Weinh). 2023 Oct.

Abstract

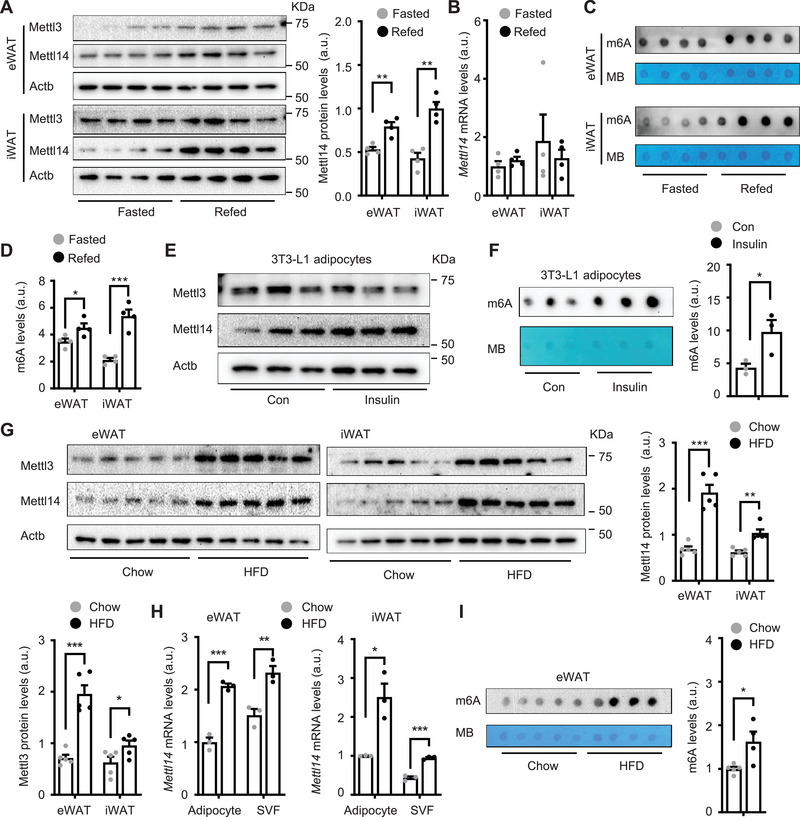
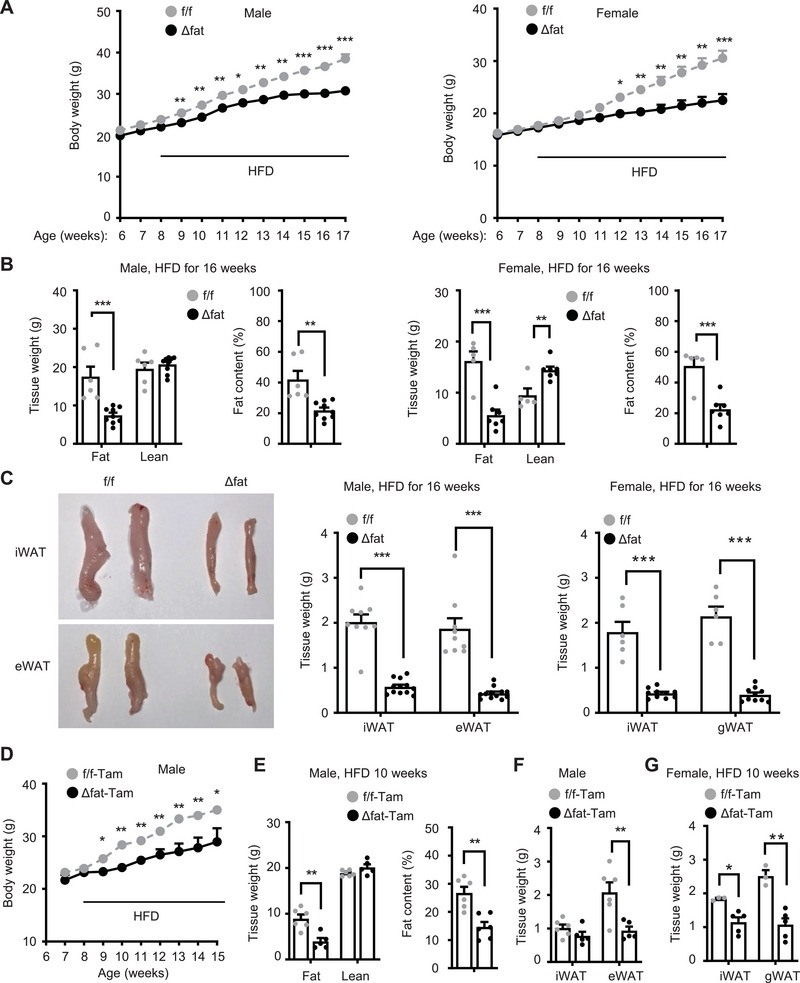
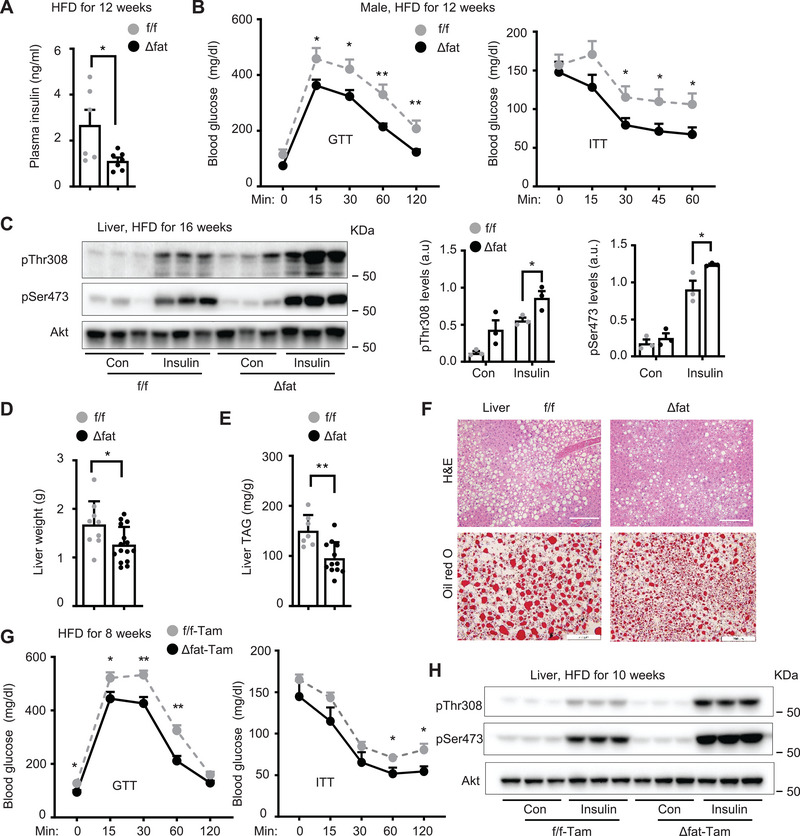
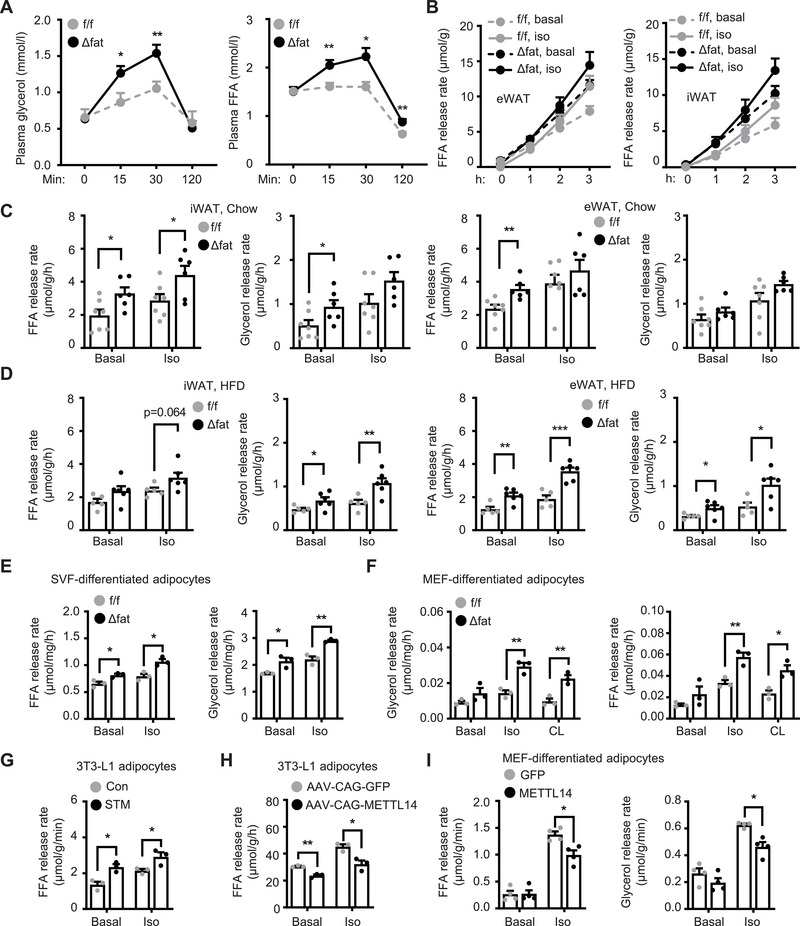
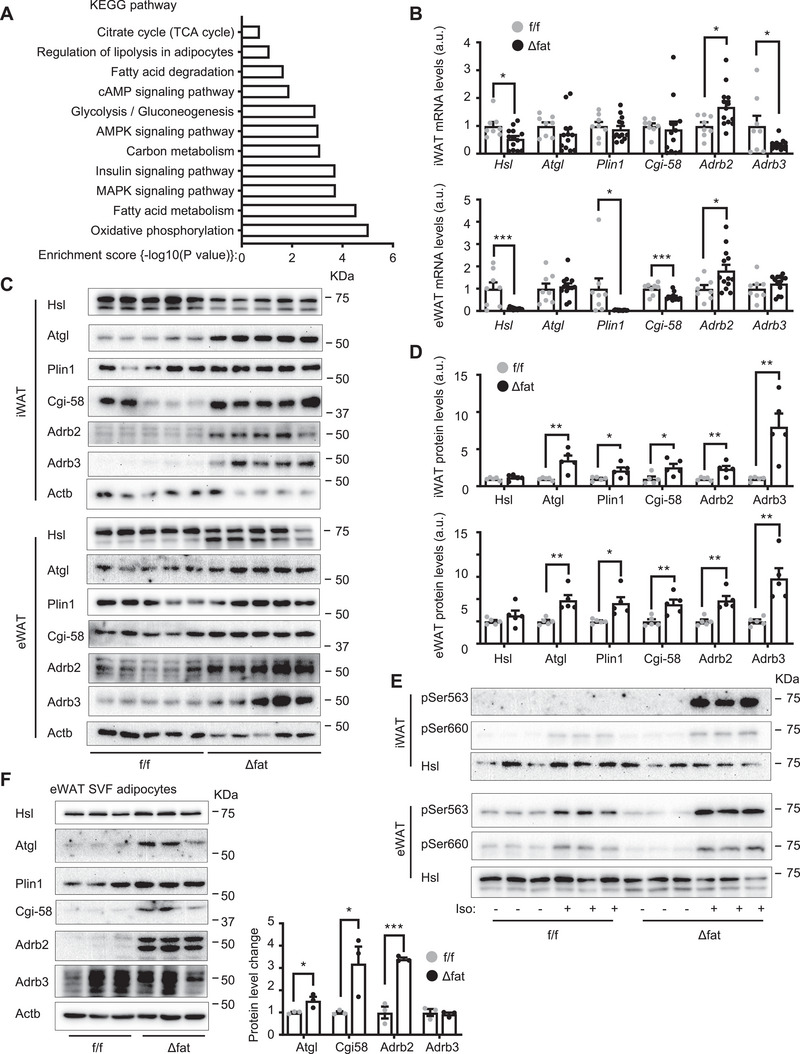
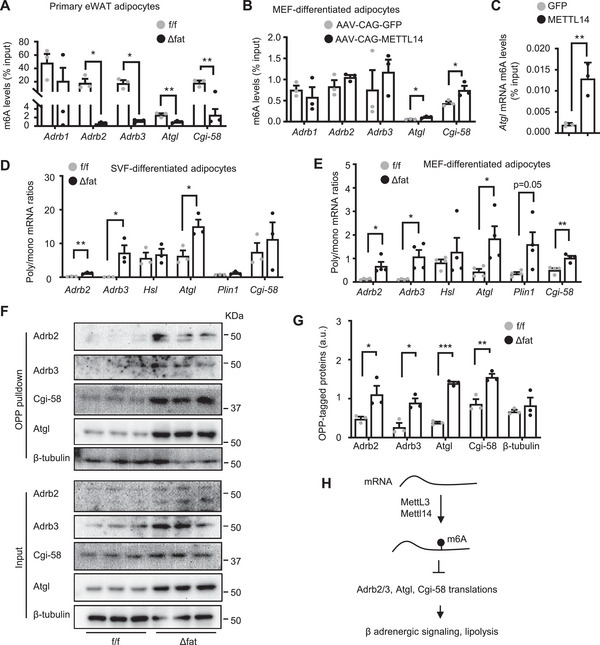
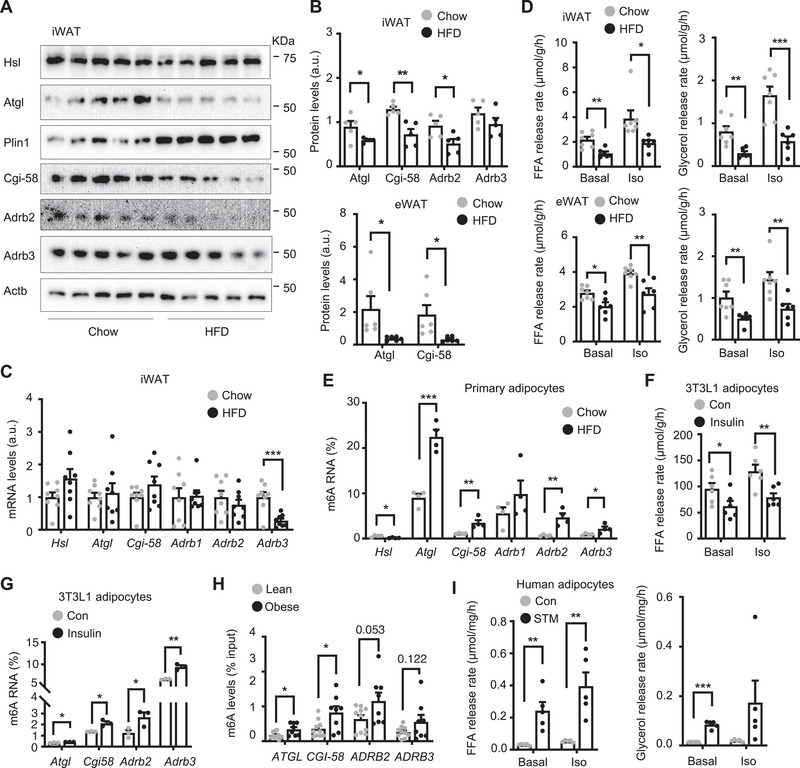
White adipose tissue (WAT) lipolysis releases free fatty acids as a key energy substance to support metabolism in fasting, cold exposure, and exercise. Atgl, in concert with Cgi-58, catalyzes the first lipolytic reaction. The sympathetic nervous system (SNS) stimulates lipolysis via neurotransmitter norepinephrine that activates adipocyte β adrenergic receptors (Adrb1-3). In obesity, adipose Adrb signaling and lipolysis are impaired, contributing to pathogenic WAT expansion; however, the underling mechanism remains poorly understood. Recent studies highlight importance of N6 -methyladenosine (m6A)-based RNA modification in health and disease. METTL14 heterodimerizes with METTL3 to form an RNA methyltransferase complex that installs m6A in transcripts. Here, this work shows that adipose Mettl3 and Mettl14 are influenced by fasting, refeeding, and insulin, and are upregulated in high fat diet (HFD) induced obesity. Adipose Adrb2, Adrb3, Atgl, and Cgi-58 transcript m6A contents are elevated in obesity. Mettl14 ablation decreases these transcripts' m6A contents and increases their translations and protein levels in adipocytes, thereby increasing Adrb signaling and lipolysis. Mice with adipocyte-specific deletion of Mettl14 are resistant to HFD-induced obesity, insulin resistance, glucose intolerance, and nonalcoholic fatty liver disease (NAFLD). These results unravel a METTL14/m6A/translation pathway governing Adrb signaling and lipolysis. METTL14/m6A-based epitranscriptomic reprogramming impairs adipose Adrb signaling and lipolysis, promoting obesity, NAFLD, and metabolic disease.

Keywords: RNA modifications; adipose tissue; diabetes; lipolysis; m6A; obesity; β-adrenergic signaling.


Conflict of interest statement

The authors declare no conflict of interest.

Figures

Figure 1
Figure 1
Mettl3/Mettl14/m6A‐based RNA modification is upregulated in fat by insulin and feeding and in obesity. A–D) C57BL/6J male mice (8 weeks old) were fasted overnight and then refed for 3 h. White adipose tissue (WAT) was harvested. A) epididymal WAT (eWAT) and inguinal WAT (iWAT) extracts were immunoblotted with the indicated antibodies. Mettl14 levels were normalized to Actb levels (n = 4 mice per group). a.u.: arbitrary unit. B) Mettl14 mRNA levels were measured by qPCR and normalized to 36B4 levels (n = 4 mice per group). C,D) Total m6A and total RNA levels were measured by dot blot assays and methylene blue (MB) staining. M6A levels were normalized to total RNA levels (n = 4 mice per group). E,F) 3T3‐L1 cells were differentiated into adipocytes. E) Cell extracts were immunoblotted with the indicated antibodies. F) m6A levels were measured by dot blot assays and normalized to total RNA levels (n = 3 repeats per group). G–I) C57BL/6J male mice (8 weeks old) were fed a high fat diet (HFD) for 12 weeks. G) iWAT and eWAT extracts were immunoblotted with the indicated antibodies (overnight fasting). Mettl3 and Mettl14 levels were quantified and normalized to Actb levels (n = 5 mice per group). H) Adipocytes and stromal vascular fraction (SVF) cells were purified from iWAT and eWAT. Mettl14 mRNA abundance was measured by qPCR and normalized to 36B4 levels (n = 3 mice per group). I) m6A levels in eWAT were measured by dot blot assays and normalized to total RNA levels. Chow: n = 5, HFD: n = 4. Data are presented as mean ± SEM. *p < 0.05, **p < 0.01, ***p < 0.001, Student's t test.
Figure 2
Figure 2
Adipocyte‐specific deletion of Mettl14 protects against diet‐induced obesity. Male and female mice (8 weeks) were fed a high fat diet (HFD) for 10 weeks. A) Grown curves. Male Mettl14f/f: n = 9, male Mettl14Δfat: n = 12, female Mettl14f/f: n = 6, female Mettl14Δfat: n = 10. B) Fat content and lean mass were measured by pDexa (HFD for 10 weeks). Male Mettl14f/f: n = 6, male Mettl14Δfat: n = 9, female Mettl14f/f: n = 5, female Mettl14Δfat: n = 7. C) White adipose tissue (WAT) weights on HFD for 16 weeks. Male Mettl14f/f: n = 9, male Mettl14Δfat: n = 12, female Mettl14f/f: n = 6, female Mettl14Δfat: n = 10. D–G) Mice (7 weeks) were injected with tamoxifen and fed a HFD. D) Growth curves. f/f‐Tam: n = 6, Δfat‐Tam: n = 5. E) Fat content and lean mass on HFD for 10 weeks. f/f‐Tam: n = 6, Δfat‐Tam: n = 5. F,G) WAT weights on HFD for 10 weeks. Male Mettl14f/f: n = 6, male Mettl14Δfat: n = 5, female Mettl14f/f: n = 3, female Mettl14Δfat: n = 5. Data are presented as mean ± SEM. *p < 0.05, **p < 0.01, ***p < 0.001, Student's t test (B,C,E–G) and ANOVA (A,D).
Figure 3
Figure 3
Mettl14Δfat mice are resistant to high fat diet (HFD) induced insulin resistance, glucose intolerance, and nonalcoholic fatty liver disease (NAFLD). Male mice were fed a HFD at 8 weeks of age. A) Overnight fasted blood insulin on HFD for 12 weeks. Mettl14f/f: n = 6, Mettl14Δfat: n = 7. B) Glucose tolerance tests (GTT) on HFD for 12 weeks (Mettl14f/f: n = 6, Mettl14Δfat: n = 8) and insulin tolerance testes (ITT) on HFD for 12 weeks (Mettl14f/f: n = 8, Mettl14Δfat: n = 14). C) Mice (HFD for 16 weeks) were fasted overnight and injected with insulin (0.75 unit kg−1 body weight) for 5 min. Liver extracts were immunoblotted with anti‐phospho‐Akt (pThr308, pSer473). Akt phosphorylation was normalized to total Akt levels (n = 3 mice per group). a.u.: arbitrary unit. D) Liver weight on HFD for 16 weeks. Mettl14f/f: n = 9, Mettl14Δfat: n = 15. E) Liver triacylglycerol (TAG) on HFD for 16 weeks (normalized to body weight). Mettl14f/f: n = 7, Mettl14Δfat: n = 12. F) H&E and Oil red O staining of liver sections on HFD for 16 weeks (n = 3 mice per group). Scale bar: 200 µm. G‐H) Mettl14f/f‐Tam and Mettl14Δfat‐Tam male mice (7 weeks) were injected with tamoxifen. One week later, they were fed a HFD for 10 weeks. G) GTT and ITT. Mettl14f/f‐Tam: n = 6, Mettl14Δfat‐Tam: n = 5. H) Mice were fasted overnight and injected with insulin (0.75 unit kg−1 body weight) for 5 min. Liver extracts were immunoblotted with the indicated antibodies. Data are presented as mean ± SEM. *p < 0.05, **p < 0.01, ***p < 0.001, Student's t test (A,C,D) and 1‐way ANOVA (B,G).
Figure 4
Figure 4
Mettl14 cell‐autonomously inhibits lipolysis in adipocytes. A) Male mice (8 weeks) were fed a high fat diet (HFD) for 4 weeks, fasted for 4 h, and injected with isoproterenol (Iso, 10 mg kg−1 body weight). Plasma glycerol and FFA levels were measured. Mettl14f/f: n = 7, Mettl14Δfat: n = 9. B,C) Inguinal white adipose tissue (iWAT) and epididymal WAT (eWAT) were harvested from chow‐fed mice (6–8 weeks old) and stimulated with isoproterenol (1 × 10⁻⁶ m) for 3 h. Glycerol and FFA secretion rates were measured and normalized to WAT weights. iWAT Mettl14f/f: n = 7, iWAT Mettl14Δfat: n = 6, eWAT Mettl14f/f: n = 7, eWAT Mettl14Δfat: n = 6. D) Male mice (8 weeks) were fed a HFD for 4 weeks. iWAT and eWAT were harvested to measure lipolysis rates under basal and isoproterenol‐stimulated conditions. Mettl14f/f: n = 5, Mettl14Δfat: n = 6. E) Stromal vascular fraction (SVF) cells were isolated from eWAT, differentiated into adipocytes, and stimulated with isoproterenol (1 × 10⁻⁶ m) for 3 h. Glycerol and FFA secretion rates were measured and normalized to protein levels (n = 3 repeats per group). F) Mouse embryonic fibroblasts (MEFs) were differentiated into adipocytes and stimulated with isoproterenol (1 × 10⁻⁶ m) or CL316243 (1 × 10⁻⁶ m, CL) for 3 h. Glycerol‐ and FFA‐releasing rates were measured and normalized to protein levels (n = 3 repeats per group). G) 3T3‐L1 cell were differentiated into adipocytes, pretreated with STM2457 (5 × 10⁻⁶ m) for 48 h, and then stimulated with isoproterenol (1 × 10⁻⁶ m) for 60 min. FFA‐releasing rates were measured (n = 3 repeats per group). H) 3T3‐L1 adipocytes were transduced with AAV‐CAG‐METTL14 or AAV‐CAG‐GFP vectors and stimulated with isoproterenol (1 × 10⁻⁶ m) for 60 min. FFA‐releasing rates were measured and normalized to protein levels (n = 3 repeats per group). I) MEFs were transduced with METTL14 or GFP lentiviral vectors, differentiated into adipocytes, and stimulated with isoproterenol (1 × 10⁻⁶ m) for 3 h. Glycerol‐ and FFA‐releasing rates were measured and normalized to protein levels (n = 4 repeats per group). Data are presented as mean ± SEM. *p < 0.05, **p < 0.01, ***p < 0.001, Student's t test (C‐I) and 1‐way ANOVA (A).
Figure 5
Figure 5
Mettl14 downregulates Adrb2, Adrb3, Atgl, and Cgi‐58 and inhibits β adrenergic signaling in adipocytes. A–D) Mettl14f/f and Mettl14Δfat males (8 weeks) were fed a high fat diet (HFD) for 16 weeks, and inguinal white adipose tissue (iWAT) and epididymal WAT (eWAT) were isolated. A) eWAT was used for RNA‐seq. Differentially expressed genes were analyzed by KEGG (n = 3 mice per group). B) mRNA abundance was measured by qPCR and normalized to 36B4 levels. a.u.: arbitrary unit. Mettl14f/f: n = 8, Mettl14Δfat: n = 13. C,D) iWAT and eWAT extracts were immunoblotted with the indicated antibodies. Protein levels were quantified and normalized to Actb levels (n = 5 mice per group). E) Male mice (8 weeks) were fed a HFD for 4 weeks. iWAT and eWAT were isolated and stimulated with isoproterenol (1 × 10⁻⁶ m) for 15 min. WAT extracts were immunoblotted with the indicated antibodies. F) SVF cells were isolated from eWAT and differentiated into adipocytes. Cell extracts were immunoblotted with the indicated antibodies. Protein levels were normalized to Actb levels (n = 3 repeats per group). Data are presented as mean ± SEM. *p < 0.05, **p < 0.01, ***p < 0.001, Student's t test.
Figure 6
Figure 6
Ablation of Mettl14‐elicited m6A methylation enhances translation of Adrb2, Adrb3, Atgl, and Cgi‐58 transcripts in adipocytes. A) Primary adipocytes were isolated from epididymal white adipose tissue (eWAT) (8 weeks old). m6A content in individual transcripts was measured by m6A RNA immunoprecipitation (RIP) and normalized to transcript inputs (n = 3 mice per group). B) Mouse embryonic fibroblasts (MEFs) were differentiated into adipocytes and transduced with AAV‐CAG‐METLL14 or AAV‐CAG‐METTL14 vectors. m6A content in individual transcripts was measured by m6A RIP (n = 3 repeats per group). C) Atgl plasmids were cotransfected with METTL14 plasmids into HEK293 cells. m6A content of Atgl transcripts was measured by m6A RIP (n = 3 repeats per group). D) Stromal vascular fraction (SVF) cells were isolated from Inguinal WAT (iWAT), differentiated into adipocytes, and subjected to polysome analysis. Polysome (poly) to monosome (mono) associated mRNA was quantified by qPCR to calculate poly/mono ratio (n = 3 repeats per group). E) MEFs were differentiated into adipocytes and subjected to polysome analysis. Poly/mono mRNA ratio was presented (n = 4 repeats per group). F,G) MEFs were differentiated into adipocytes and subjected to O‐propargyl‐puromycin (OPP) pulldown assays. F) Nascent OPP‐tagged proteins were pulled down and immunoblotted with the indicated antibodies. G) OPP‐tagged Atgl, Cgi‐58, Adrb2, and Adrb3 were quantified and normalized to input Atgl, Cgi‐58, Adrb2, and Adrb3 levels, respectively (n = 3 repeats). H) Mettl3/Mettl14 complex install m6A in Adrb2, Adrb3, Atgl, and Cgi58 transcripts and inhibit their translation. These suppress β adrenergic signaling and lipolysis. Data are presented as mean ± SEM. *p < 0.05, **p < 0.01, ***p < 0.001, Student's t test.
Figure 7
Figure 7
Mettl14/m6A‐based epitranscriptomic reprogramming contributes to adipose catecholamine resistance and lipolysis suppression in obesity. A–E) C57BL/6J male mice (8 weeks) were on high fat diet (HFD) for 12 weeks. A,B) Inguinal white adipose tissue (iWAT; n = 5 per group) and epididymal WAT (eWAT) (n = 6 per group) extracts were immunoblotted with the indicated antibodies. Protein levels were quantified and normalized to Actb levels. C) iWAT mRNA was measured by qPCR and normalized to 36B4 levels (n = 8 mice per group). D) iWAT and eWAT explants were stimulated with 1 × 10⁻⁶ m isoproterenol (Iso) for 3 h, and lipolysis was measured and normalized to WAT weight. Chow: n = 7, HFD: n = 6. E) Primary adipocytes were purified from eWAT. m6A content in individual transcripts was measured in adipocytes using m6A RNA immunoprecipitation (RIP) assays and normalized to input (n = 4 mice per group). F,G) 3T3‐L1 cells were differentiated into adipocytes. F) 3T3‐L1 adipocytes were stimulated with 1 × 10⁻⁶ m isoproterenol and FFA‐releasing rates were measured and normalized to protein levels (n = 6 repeats per group). G) m6A content in individual transcripts were measured by m6A RIP and normalized to input (n = 3 repeats per group). H) m6A content was measured in human visceral WAT using m6A RIP assays (normalized to input). Lean: n = 10, obese: n = 8. I) Stromal vascular fraction (SVF) cells were isolated from human visceral fat, differentiated into adipocytes, pretreated with STM2457 (2.5 × 10⁻⁶ m) for 48 h, and stimulated with isoproterenol (1 × 10⁻⁶ m) for 120 min. Glycerol‐ and FFA‐releasing rates were measured and normalized to protein levels (n = 5 subjects per group). Data are presented as mean ± SEM. *p < 0.05, **p < 0.01, ***p < 0.001, Student's t test.

References

    1. a) Sun C., Jiang L., Liu Y., Shen H., Weiss S. J., Zhou Y., Rui L., Cell Rep. 2016, 17, 2015; - PMC - PubMed
    2. b) Ahmadian M., Abbott M. J., Tang T., Hudak C. S., Kim Y., Bruss M., Hellerstein M. K., Lee H. Y., Samuel V. T., Shulman G. I., Wang Y., Duncan R. E., Kang C., Sul H. S., Cell Metab. 2011, 13, 739; - PMC - PubMed
    3. c) Wu J. W., Wang S. P., Casavant S., Moreau A., Yang G. S., Mitchell G. A., Endocrinology 2012, 153, 2198. - PubMed
    1. a) Ahmadian M., Duncan R. E., Varady K. A., Frasson D., Hellerstein M. K., Birkenfeld A. L., Samuel V. T., Shulman G. I., Wang Y., Kang C., Sul H. S., Diabetes 2009, 58, 855; - PMC - PubMed
    2. b) Zhang X., Xie X., Heckmann B. L., Saarinen A. M., Czyzyk T. A., Liu J., Diabetes 2014, 63, 934; - PMC - PubMed
    3. c) El‐Assaad W., El‐Kouhen K., Mohammad A. H., Yang J., Morita M., Gamache I., Mamer O., Avizonis D., Hermance N., Kersten S., Tremblay M. L., Kelliher M. A., Teodoro J. G., Diabetologia 2015, 58, 149. - PMC - PubMed
    1. a) Pirzgalska R. M., Seixas E., Seidman J. S., Link V. M., Sanchez N. M., Mahu I., Mendes R., Gres V., Kubasova N., Morris I., Arus B. A., Larabee C. M., Vasques M., Tortosa F., Sousa A. L., Anandan S., Tranfield E., Hahn M. K., Iannacone M., Spann N. J., Glass C. K., Domingos A. I., Nat. Med. 2017, 23, 1309; - PMC - PubMed
    2. b) Camell C. D., Sander J., Spadaro O., Lee A., Nguyen K. Y., Wing A., Goldberg E. L., Youm Y. H., Brown C. W., Elsworth J., Rodeheffer M. S., Schultze J. L., Dixit V. D., Nature 2017, 550, 119; - PMC - PubMed
    3. c) Gao H., Arner P., Beauchef G., Guere C., Vie K., Dahlman I., Mejhert N., Ryden M., Cell Metab. 2020, 32, 1; - PubMed
    4. d) Arner P., Bernard S., Appelsved L., Fu K. Y., Andersson D. P., Salehpour M., Thorell A., Ryden M., Spalding K. L., Nat. Med. 2019, 25, 1385; - PubMed
    5. e) Villena J. A., Roy S., Sarkadi‐Nagy E., Kim K. H., Sul H. S., J. Biol. Chem. 2004, 279, 47066; - PubMed
    6. f) Kim J. Y., Tillison K., Lee J. H., Rearick D. A., Smas C. M., Am. J. Physiol. Endocrinol. Metab. 2006, 291, E115. - PubMed
    1. Bartness T. J., Liu Y., Shrestha Y. B., Ryu V., Front. Neuroendocrinol. 2014, 35, 473. - PMC - PubMed
    1. a) Rui L., Compr. Physiol. 2017, 7, 1281; - PMC - PubMed
    2. b) Grabner G. F., Xie H., Schweiger M., Zechner R., Nat Metab 2021, 3, 1445. - PubMed

Publication types

LinkOut - more resources