. 2023 Sep;10(27):e2301975.
doi: 10.1002/advs.202301975. Epub 2023 Aug 1.

Targeting Alpha-Ketoglutarate Disruption Overcomes Immunoevasion and Improves PD-1 Blockade Immunotherapy in Renal Cell Carcinoma

Affiliations

Targeting Alpha-Ketoglutarate Disruption Overcomes Immunoevasion and Improves PD-1 Blockade Immunotherapy in Renal Cell Carcinoma

Le Li et al. Adv Sci (Weinh). 2023 Sep.

Abstract

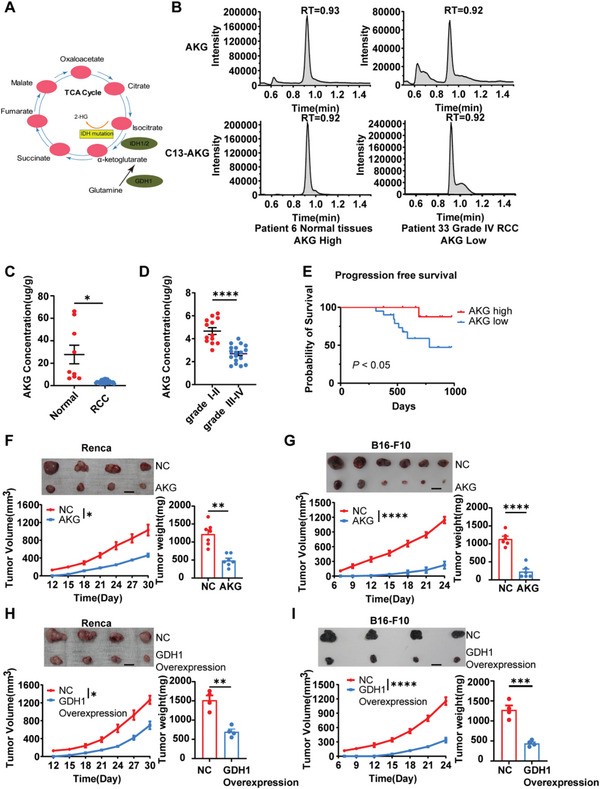
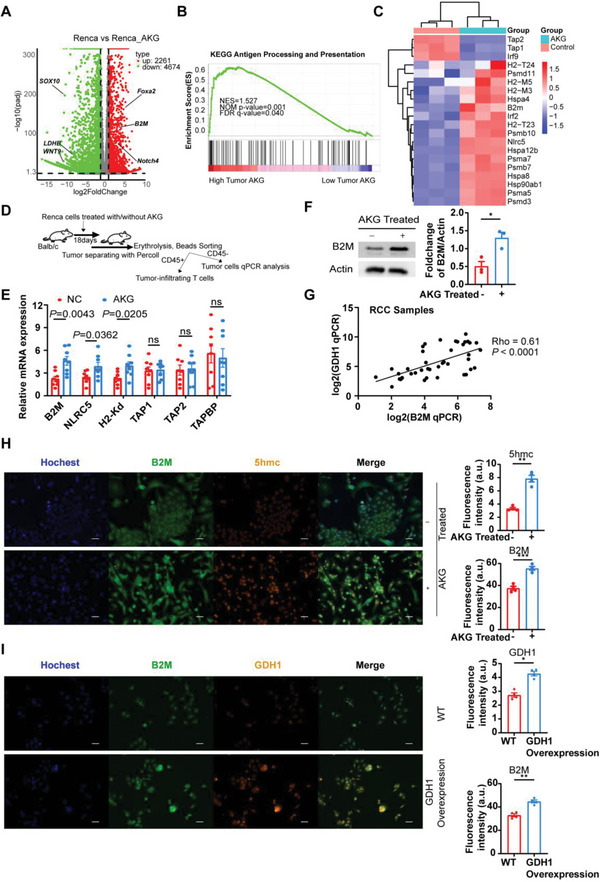
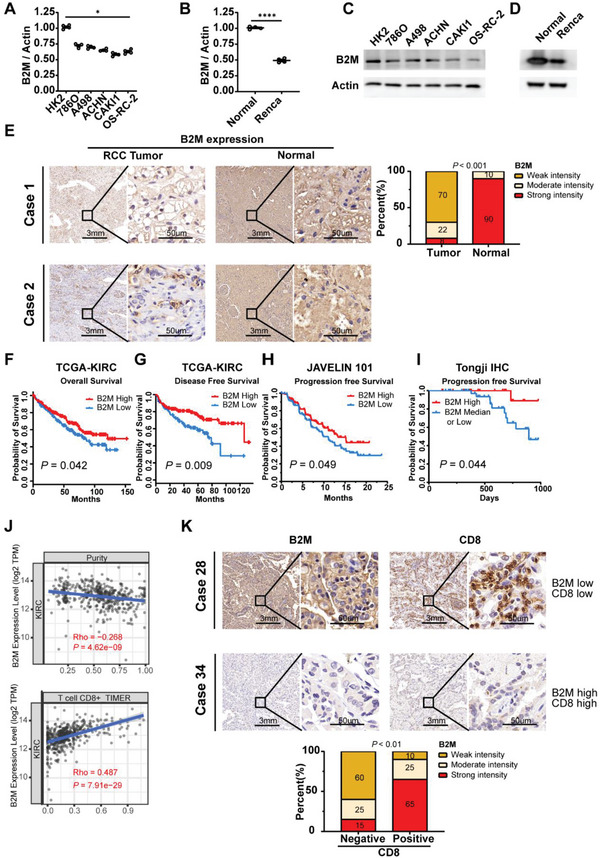
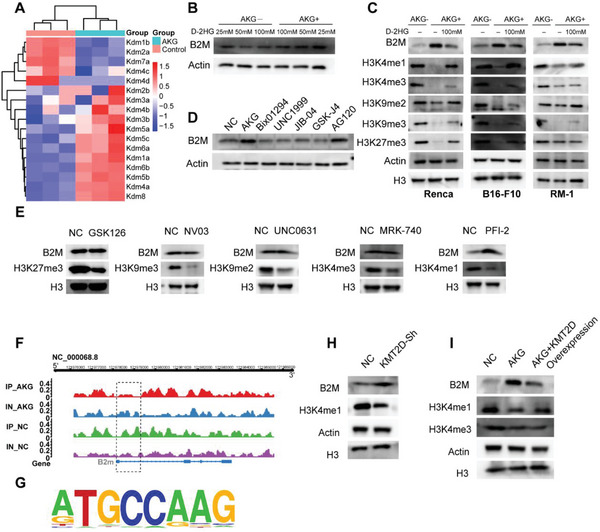
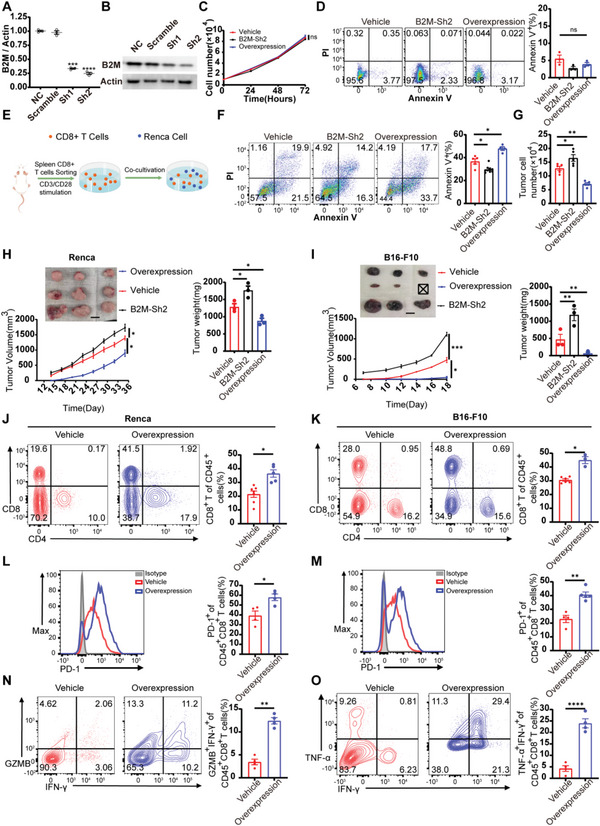
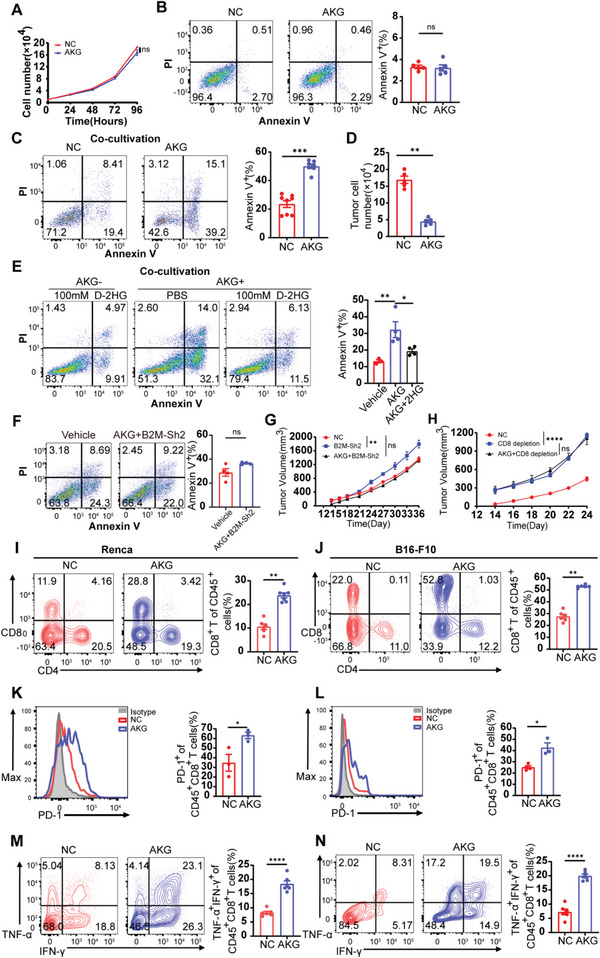
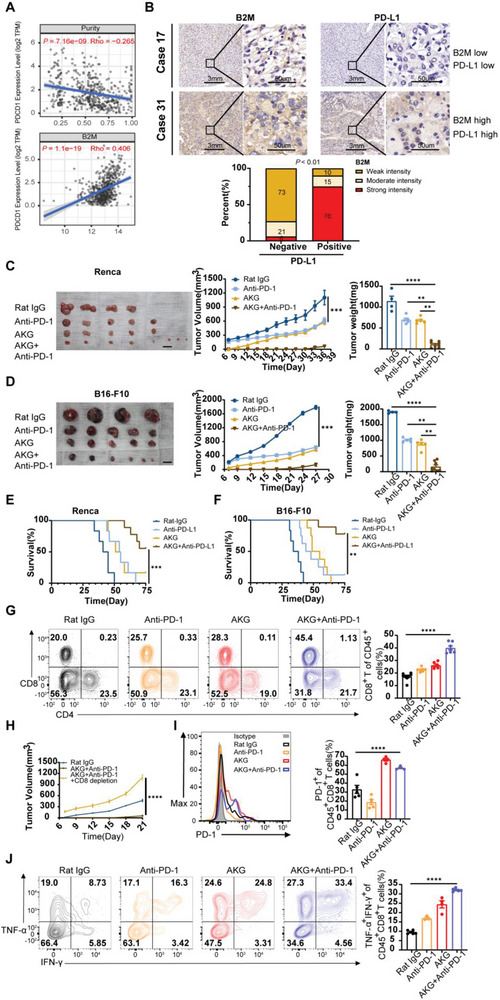
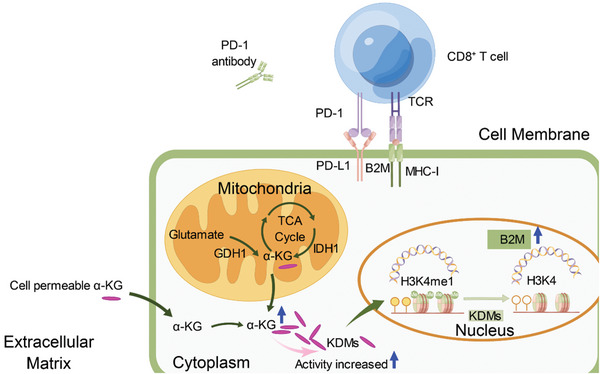
The Warburg effect-related metabolic dysfunction of the tricarboxylic acid (TCA) cycle has emerged as a hallmark of various solid tumors, particularly renal cell carcinoma (RCC). RCC is characterized by high immune infiltration and thus recommended for immunotherapeutic interventions at an advanced stage in clinical guidelines. Nevertheless, limited benefits of immunotherapy have prompted investigations into underlying mechanisms, leading to the proposal of metabolic dysregulation-induced immunoevasion as a crucial contributor. In this study, a significant decrease is found in the abundance of alpha-ketoglutarate (αKG), a crucial intermediate metabolite in the TCA cycle, which is correlated with higher grades and a worse prognosis in clinical RCC samples. Elevated levels of αKG promote major histocompatibility complex-I (MHC-I) antigen processing and presentation, as well as the expression of β2-microglobulin (B2M). While αKG modulates broad-spectrum demethylation activities of histone, the transcriptional upregulation of B2M is dependent on the demethylation of H3K4me1 in its promoter region. Furthermore, the combination of αKG supplementation and PD-1 blockade leads to improved therapeutic efficacy and prolongs survival in murine models when compared to monotherapy. Overall, the findings elucidate the mechanisms of immune evasion in anti-tumor immunotherapies and suggest a potential combinatorial treatment strategy in RCC.

Keywords: B2M; PD-1 blockade; alpha-ketoglutarate; immunoevasion; renal cell carcinoma.


Conflict of interest statement

The authors declare no conflict of interest.

Figures

Figure 1
Figure 1
AKG attenuates Renal Cell Carcinoma development. A) The metabolic map of the α‐ketoglutarate metabolism pathway. B) Representative concentration of tumor αKG and C13‐αKG of two independent RCC patients. C) Quantification of αKG concentration in adjacent normal tissues (n = 9) and tumor tissues (n = 31) in RCC patients. Patients diagnosed with clear cell renal cell carcinoma were included (4 cm < mass diameter < 7 cm). D) Quantification of αKG concentration in tumor tissues of Grade I‐II (n = 13) and Grade III‐IV (n = 18) RCC patients. E) Progression‐free survival curves among patients with high concentration (no less than 4 µg g−1) and low concentration (< 4 µg g−1) αKG. p < 0.050. F) Average tumor growth and weight of Renca (n = 7) and G) B16‐F10 (n = 6) tumor‐bearing mice pre‐treated with/without 5 mm αKG for 4 days. H) Average tumor growth and weight of Renca (n = 4) and I) B16‐F10 (n = 4) tumor‐bearing mice transfected with vehicle (NC) or GDH1‐Overexpression plasmids. Data are mean ± S.E.M.; log‐rank (Mantel‐Cox) test was used for (E). Two‐tailed unpaired Student t‐test was used for (C,D) and (F–I). *p < 0.05, **p < 0.01, ***p < 0.001, and ****p < 0.0001. Scale bars represent 1 cm for (F–I).
Figure 2
Figure 2
AKG promotes the expression of B2M in RCC tumors. A) Volcano plots showing DEGs of Renca cells (Fold change >1.5) between the αKG group and control group. B) GSEA enrichment results indicate the pathway enriched in the αKG high group. C) Heatmaps illustrate the expression of genes associated with antigen presentation and processing pathways between the αKG group and the control group. D) Schematic of experimental design for experiments shown in (E). E) qPCR analysis indicates the mRNA expression levels of common molecules (B2M, NLRC5, H2‐Kd, TAP1, TAP2, TAPBP) associated with antigen presentation and processing pathways in Renca tumors between the αKG group and control group in vivo (n = 8). F) Representative and statistical western blot results (n = 3, in triplicate and repeated 3 times independently) show the protein levels of B2M of Renca cells between the αKG group and control group in vitro. G) Correlation of B2M and GDH1 mRNA expression in RCC clinical samples (n = 42). Statistical significance was determined by the Pearson correlation test. H) Representative and statistical analysis (n = 4, repeated 4 times independently) of the immunofluorescent staining results of nuclear (blue), B2M (green), 5hmc (red, localized in cellular nuclei), and merged files of Renca cells between the αKG group and control group. I) Representative and statistical analysis (n = 4, repeated 4 times independently) of the immunofluorescent staining results of nuclear (blue), B2M (green), GDH1 (red), and merged files of Renca cells between the GDH1‐Overexpression group and WT group. Error bar represents mean ± SEM. Statistical significance was determined by unpaired Student's t‐test for (E,F) and (H,I). ns = no significant, *p < 0.05, **p < 0.01, ***p < 0.001, and ****p < 0.0001. Scale bars represent 30 um for (H,I).
Figure 3
Figure 3
B2M is lowly expressed in Renal Cell Carcinoma and positively correlates with prognosis and PD‐L1 expression and CD8+ T cell infiltration. A) mRNA and C) protein expression of B2M between human renal cell carcinoma cell lines (786O, A498, ACHN, CAKI‐1 and OS‐RC‐2) and HK‐2 (human renal proximal convoluted tubule epithelial cell). B) mRNA and D) protein expression of Renca cell and normal kidney tissues from Balb/c mouse. E) Representative and statistical IHC results of B2M expression in RCC tumor (n = 70) samples and adjacent normal (n = 40) samples. F) Overall survival and G) Disease‐free survival of patients with high‐ or low‐B2M expression in the TCGA‐KIRC cohort using the Gepia 2.0 database (log‐rank test). H) Progression‐free survival of patients with high‐ or low‐B2M expression in the phase 3 JAVELIN Renal 101 trial (log‐rank test). I) Progression‐free survival of patients with high‐ or low‐B2M expression in our Tongji IHC samples. J) Correlation of B2M expression with tumor purity and infiltration levels of immune cells obtained from TIMER (purity‐corrected Spearman test). K) Representative and statistical IHC results of B2M (left) (n = 65), CD8 (right) (n = 55) in RCC tumors. Error bar represents mean ± SEM. Statistical significance was determined by unpaired Student's t‐test for A‐B and E and K. ns = no significant, *p < 0.05, **p < 0.01, ***p < 0.001, and ****p < 0.0001.
Figure 4
Figure 4
AKG upregulates B2M expression by debilitating enrichment of H3K4me1 in the promoter regions. A) Heatmaps illustrate the expression of genes in the αKG‐dependent histone demethylase family. B) Western results show B2M expression under the concentration of 25, 50, and 100 mm D‐2HG treatment treated with/without 5 mm αKG. C) Western results show B2M, H3K4me1, H3K4me3, H3K9me2, H3K9me3, and H3K27me3 in 3 different murine tumor cell lines: Renca, B16‐F10, and RM‐1 treated with/without 5 mm αKG and 100 mm D‐2HG. β‐actin and H3 were used as the reference protein. D)Western results show B2M expression in Renca cells treated with αKG, Bix01294, UNC1999, JIB‐04, GSK‐J4, and AG120. E) Western results show B2M and H3K4me1, H3K4me3, H3K9me2, H3K9me3, and H3K27me3 expression in Renca cells treated with GSK126, NV03, UNC0631, MRK‐740, and PFI‐2. F) Chip‐seq results show the H3K4me1 enrichment in the promoter region of B2M in Renca cells treated with/without αKG. IP‐AKG/NC: Chip‐seq pulled by H3K4me1 in the AKG/NC group; IN‐AKG/NC: Chip‐seq pulled by IgG in the AKG/NC group; G) Top consensus motif identified by HOMER with H3k4me1 peaks in (F). p‐Value = 1e‐39. H,I) B2M expression and H3K4me1 levels in Renca treated as indicated.
Figure 5
Figure 5
B2M overexpression inhibits tumor growth by augmenting CD8+ T cell infiltration and cytotoxic effects. A) qPCR (n = 3) and B) Western results show the shRNA knockdown efficiency for B2M. C) Renca cells growth assay using CCK8 to assess proliferation of Renca cells in the Vehicle group, B2M‐Sh2 group, and B2M‐Overexpression group (n = 4). D) Representative flow plots and quantification of Renca cells proportions stained with Annexin V and PI in the Vehicle group, B2M‐Sh2 group, and B2M‐Overexpression group (n = 3). E) A schematic representation of the co‐cultivation process. F) Representative flow plots and quantification of Renca cell proportions in different groups after co‐cultivation with CD8+ T cells (1:5) for 24 h. G) Remaining live cells (trypan blue‐negative) after co‐cultivation were counted by trypan blue assay and automated cell counting (n = 5). H) Renca cells and I) B16‐F10 cells were transfected with the vehicle, B2M‐Overexpression, and B2M‐Sh2 plasmids and transplanted subcutaneously to Balb/c and C57 mice (n = 3). Tumor volumes were measured every 2 or 3 days. On day 33 or 18, mice were sacrificed and tumor weight was analyzed. J,K) Representative flow plots and quantification of tumor‐infiltrating CD8+ T cells in Renca tumors of Vehicle group (n = 7) and B2M‐Overexpression group (n = 5) and B16 tumors of Vehicle group (n = 6) and B2M‐Overexpression group (n = 3). L,M) Representative flow plots and quantification of PD‐1 expression on the intratumoral CD8+ T cells of the Vehicle group (n = 4) and B2M‐Overexpression group (n = 4) from B16‐F10 tumor‐bearing mice and the Vehicle group (n = 4) and B2M‐Overexpression group (n = 5) from B16‐F10 tumor‐bearing mice. N,O) Representative flow plots and quantification of Granzyme B and IFN‐γ co‐expression and IFN‐γ and TNF‐α co‐expression in the intratumoral CD8+CD45+ T cells of the αKG group and control group from Renca and B16‐F10 tumor‐bearing mice (n = 4). Error bar represents mean ± SEM. Statistical significance was determined by unpaired Student's t‐test. ns = no significant, *p < 0.05, **p < 0.01, ***p < 0.001, and ****p < 0.0001. Scale bars represent 1 cm for (H,I).
Figure 6
Figure 6
The tumor suppressor role of αKG is dependent on αKG ‐B2M axis enhanced anti‐tumor immunity. A) Renca cell growth assay using CCK8 to assess proliferation of Renca cells treated with/without αKG. B) Representative flow plots and quantification of Renca cells proportions stained with Annexin V and PI in the αKG group treated with 5 mm αKG and control group (n = 5). C) Representative flow plots and quantification of Renca cell proportions in the αKG group treated with 5 mm αKG and control group after co‐cultivation with CD8+ T cells (1:5) for 24 h. D) Remaining live cells (trypan blue‐negative) after co‐cultivation were counted by trypan blue assay and automated cell counting (n = 5). E) Representative flow plots and quantification of Renca cell proportions stained with Annexin V and PI in the D‐2HG group, αKG group, and αKG+D‐2HG group. F) Representative flow plots and quantification of Renca cell proportions stained with Annexin V and PI in the Vehicle group and αKG+B2M‐Sh2 group. G) Renca cells were treated with/without 5 mm αKG for 4 days and transfected with a vehicle, B2M‐Sh2 plasmids AND then transplanted subcutaneously to Balb/c mice (n = 3). Tumor volumes were measured every 2 or 3 days. H) Renca cells were treated with/without 5 mm αKG for 4 days and transplanted subcutaneously to Balb/c mice (n = 3). Mice were intraperitoneally injected with 100 µg of anti‐CD8 (the αKG group) or control antibody (Rat IgG) 1 day before and 4, 10 days after tumor implantation until harvest. Tumor volumes were measured every 2 or 3 days. I,J) Representative flow plots and quantification of tumor‐infiltrating CD8+ T cells in Renca tumors of αKG group (n = 7) and control group (n = 6) and B16 tumors of αKG group (n = 6) and control group (n = 6). K,L) Representative flow plots and quantification of PD‐1 expression on the intratumoral CD8+ T cells of the αKG group (n = 3) and control group (n = 3) from Renca tumor‐bearing mice and the αKG group (n = 4) and control group (n = 3) from B16‐F10 tumor‐bearing mice. M,N) Representative flow plots and quantification of IFN‐γ and TNF‐α co‐expression in the intra‐tumoral CD8+CD45+ T cells of the αKG group and control group from Renca and B16‐F10 tumor‐bearing mice (n = 6). Representative data are shown from two independent experiments. Error bar represents mean ± SEM. Statistical significance was determined by unpaired Student's t‐test. ns = no significant, *p < 0.05, **p < 0.01, ***p < 0.001, and ****p < 0.0001.
Figure 7
Figure 7
AKG potentiated anti‐PD1 immune checkpoint therapeutic efficacy. A) Correlation of B2M expression with tumor purity and PD‐1 expression of tumor‐infiltrating immune cells obtained from TIMER (purity‐corrected Spearman test). B) Top: IHC staining of B2M (left) and PD‐L1(right) in KIRC tumors collected by us was performed. Bottom: Quantitative IHC analysis of correlation of B2M expression (n = 65) and PD‐L1 expression (n = 50). C) Average tumor volumes and weight of Renca tumor‐bearing Balb/c mice and B16‐F10 tumor‐bearing C57 mice D) treated with Rat‐IgG (n = 4), αKG (n = 6), or anti‐PD‐1(n = 5) monotherapy and combination therapy (n = 8 in the Renca murine model and n = 6 in the B16‐F10 murine model). E) Survival curves of Renca tumor‐bearing Balb/c mice and F) B16‐F10 tumor‐bearing C57 mice treated as indicated. Renca model: Rat IgG group (n = 6), αKG group (n = 6), PD‐1 group (n = 6), and combination group (n = 9); B16‐F10 model: Rat IgG group (n = 6), αKG group (n = 8), PD‐1 group (n = 8), and combination group (n = 9). G) Representative flow plots and quantification of tumor‐infiltrating CD4+ and CD8+ T cells in Renca tumors and B16‐F10 tumors treated as indicated (n = 4). H) Average tumor growth of B16‐F10 tumor‐bearing animals treated with Rat IgG, combination therapy, and α‐CD8 depleting antibody. I) Representative flow plots and quantification of PD‐1 expression on the intra‐tumoral CD8+ T cells from B16‐F10 tumor‐bearing mice treated as indicated (n = 8 for Rat IgG group, n = 6 for αKG group, n = 6 for anti‐PD‐1 group, n = 7 for combination group). J) Representative flow plots and quantification of IFN‐γ and TNF‐α co‐expression in the intratumoral CD8+CD45+ T cells of the αKG group and control group from Renca and B16‐F10 tumor‐bearing mice (n = 5 for Rat IgG group, n = 3 for αKG group, n = 4 for anti‐PD‐1 group, n = 6 for combination group). Error bars represent S.E.M. log‐rank (Mantel–Cox) test was used for (E) and (F). Two‐way ANOVA was used for (C), (D), (G), (H), (I), and (J). *p < 0.05, **p < 0.01, ***p < 0.001, and ****p < 0.0001. Scale bars represent 1 cm for (C,D).
Figure 8
Figure 8
The αKG‐B2M‐CD8 axis creates therapeutic vulnerabilities in renal cell carcinoma. Schematic model depicting that enhancement of the αKG‐B2M‐CD8 axis improved PD‐1 blockade efficacy and inhibited tumor growth in renal cell carcinoma.

References

    1. Vander Heiden M. G., DeBerardinis R. J., Cell 2017, 168, 657. - PMC - PubMed
    1. Atkins M. B., Plimack E. R., Puzanov I., Fishman M. N., McDermott D. F., Cho D. C., Vaishampayan U., George S., Olencki T. E., Tarazi J. C., Rosbrook B., Fernandez K. C., Lechuga M., Choueiri T. K., Lancet Oncol. 2018, 19, 405. - PMC - PubMed
    1. Notarangelo G., Spinelli J. B., Perez E. M., Baker G. J., Kurmi K., Elia I., Stopka S. A., Baquer G., Lin J. R., Golby A. J., Joshi S., Baron H. F., Drijvers J. M., Georgiev P., Ringel A. E., Zaganjor E., McBrayer S. K., Sorger P. K., Sharpe A. H., Wucherpfennig K. W., Santagata S., Agar N. Y. R., Suva M. L., Haigis M. C., Science 2022, 377, 1519. - PMC - PubMed
    1. Tan X., Qi C., Zhao X., Sun L., Wu M., Sun W., Gu L., Wang F., Feng H., Huang X., Xie B., Shi Z., Xie P., Wu M., Zhang Y., Chen G., Adv. Sci. (Weinh) 2023, 10, e2206768. - PMC - PubMed
    1. Wang X., Liu R., Qu X., Yu H., Chu H., Zhang Y., Zhu W., Wu X., Gao H., Tao B., Li W., Liang J., Li G., Yang W., Mol Cell 2019, 76, 148. - PubMed

Publication types

Substances