. 2023 Sep 6;34(9):2043-2050.
doi: 10.1021/jasms.3c00210. Epub 2023 Aug 1.

Maximized Spatial Information and Minimized Acquisition Time of Top-Hat IR-MALDESI-MSI of Zebrafish Using Nested Regions of Interest (nROIs)

Affiliations

Maximized Spatial Information and Minimized Acquisition Time of Top-Hat IR-MALDESI-MSI of Zebrafish Using Nested Regions of Interest (nROIs)

Alena N Joignant et al. J Am Soc Mass Spectrom. .

Abstract

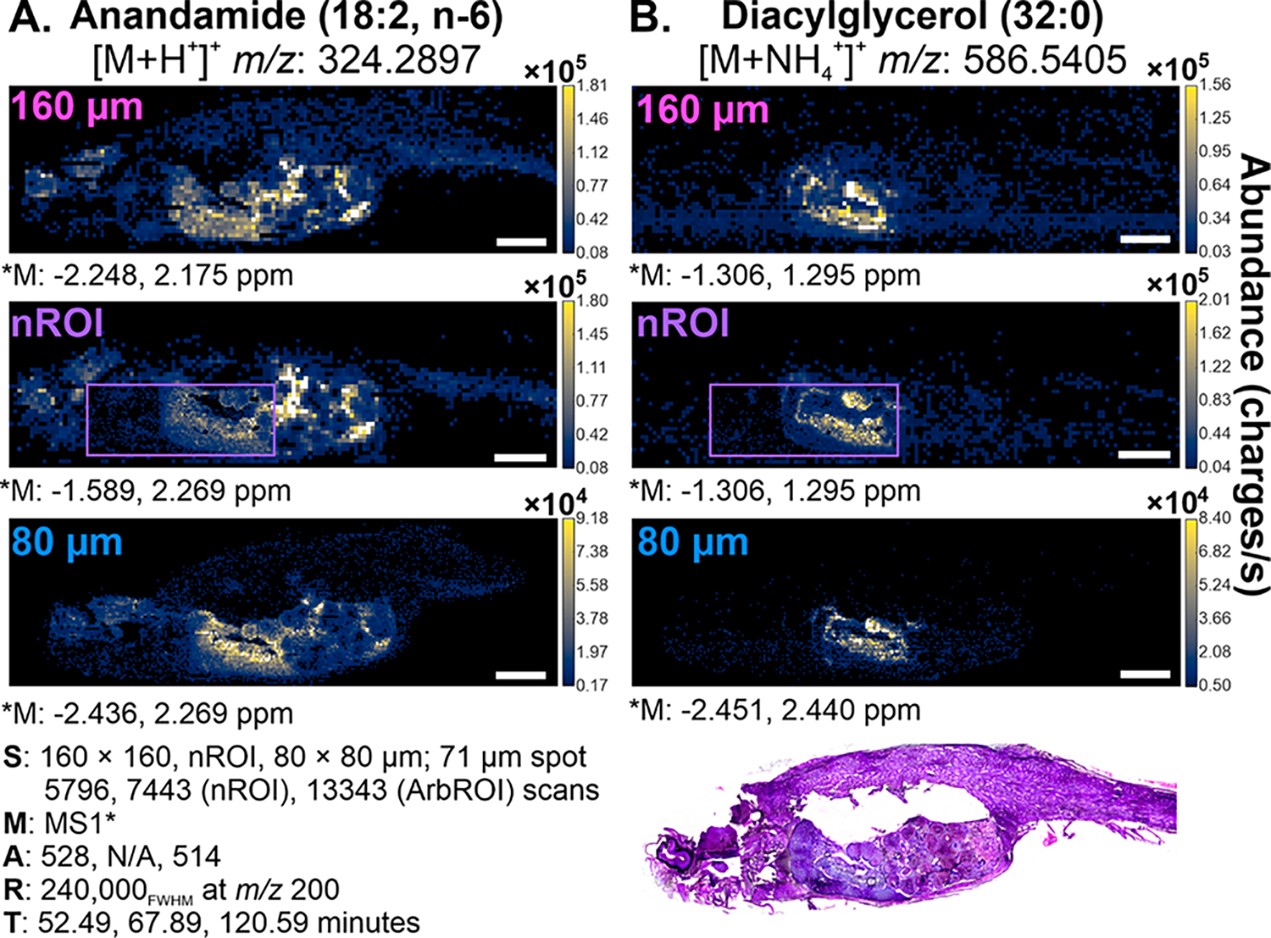
Increasing the spatial resolution of a mass spectrometry imaging (MSI) method results in a more defined heatmap of the spatial distribution of molecules across a sample, but it is also associated with the disadvantage of increased acquisition time. Decreasing the area of the region of interest to achieve shorter durations results in the loss of potentially valuable information in larger specimens. This work presents a novel MSI method to reduce the time of MSI data acquisition with variable step size imaging: nested regions of interest (nROIs). Using nROIs, a small ROI may be imaged at a higher spatial resolution while nested inside a lower-spatial-resolution peripheral ROI. This conserves the maximal spatial and chemical information generated from target regions while also decreasing the necessary acquisition time. In this work, the nROI method was characterized on mouse liver and applied to top-hat MSI of zebrafish using a novel optical train, which resulted in a significant improvement in both acquisition time and spatial detail of the zebrafish. The nROI method can be employed with any step size pairing and adapted to any method in which the acquisition time of larger high-resolution ROIs poses a practical challenge.

Keywords: IR-MALDESI; mass spectrometry imaging; nested region of interest; spatial resolution; zebrafish.


Conflict of interest statement

The authors declare the following competing financial interest(s): D.C.M. is part owner of MSI Software Solutions, the software that was used to analyze the data in this manuscript.

Figures

Figure 1.
Figure 1.
Screenshot of the RastirZ ROIEditor GUI with the nested ROI button shown. The GUI shows the camera field of view with the nROI rectangles overlaid on a zebrafish sample.
Figure 2.
Figure 2.
(A) The scan pattern for the nROI method. Larger step sizes are acquired in a flyback mode until the boundary of the nROI is reached. Clusters are acquired at the smaller step size in a flyback mode. (B) Location file generated for the nROI method. Larger step-sized locations are spaced apart to accommodate the nROI step size. Location files are indexed by smaller step sizes.
Figure 3.
Figure 3.
Pixel duplication for nROI visualization in MSiReader v2.15. The nROI location file is a location file with an additional fourth column indicating pixel size in millimeters (i.e., 0.16 or 0.08 mm). This file is loaded along with the imzML acquired using the nROI method. These pixel sizes are used to duplicate the nest pixels to the right and below the original scan to fill the appropriate amount of space (i.e., 2 × 2). The pixel duplication affects the visualization only.
Figure 4.
Figure 4.
Averaged mouse liver spectra of contiguous scans in the nest (top, n = 40) that immediately follow the last contiguous scans in the nROI (bottom, n = 40).
Figure 5.
Figure 5.
Comparison of the signal generated from the nROI and nest region of mouse liver. (A) Optical image of the ROI. Irregular spacing of rows/columns is due to artifacts from stitching optical images caused by the Leica microscope software. (B) MS image of 10 summed on-tissue lipid annotations. (C,D) SAS statistical analysis comparing the nest (n = 161) and nROI (n = 171) using (C) proc boxplot and (D) proc ttest with α = 0.05. **p = 0.0071. The circle represents an outlier, while the diamonds in both box plots represent the mean summed abundance. Voxels that had extremely low abundance (corresponding to holes in the liver or ESI drop out) were removed.
Figure 6.
Figure 6.
Whole-body zebrafish MS images of (A) anandamide (18:2, n-6) [M + H+]+, m/z: 324.2897, and (B) diacylglycerol 32:0 [M + NH4+]+ m/z: 586.5405 at 160 μm, nROI of 160 and 80 μm, and 80 μm step sizes. Purple boxes indicate the nROI. An optical image of a stained serial section is included. Scale bars: 2 mm. Images were created using 99% hotspot removal.

Similar articles

Cited by

References

    1. Caleb Bagley M; Garrard KP; Muddiman DC The Development and Application of Matrix Assisted Laser Desorption Electrospray Ionization: The Teenage Years. Mass Spectrom. Rev. 2023, 42 (1), 35–66. - PMC - PubMed
    1. Karas M; Bachmann D; Bahr U; Hillenkamp F Matrix-Assisted Ultraviolet Laser Desorption of Non-Volatile Compounds. International Journal of Mass Spectrometry and Ion Processes 1987, 78, 53–68.
    1. Fenn JB; Mann M; Meng CK; Wong SF; Whitehouse CM Electrospray Ionization for Mass Spectrometry of Large Biomolecules. Science 1989, 246 (4926), 64–71. - PubMed
    1. Robichaud G; Barry JA; Muddiman DC IR-MALDESI Mass Spectrometry Imaging of Biological Tissue Sections Using Ice as a Matrix. J. Am. Soc. Mass Spectrom. 2014, 25 (3), 319–328. - PMC - PubMed
    1. Tu A; Muddiman DC Internal Energy Deposition in Infrared Matrix-Assisted Laser Desorption Electrospray Ionization With and Without the Use of Ice as a Matrix. J. Am. Soc. Mass Spectrom. 2019, 30 (11), 2380–2391. - PMC - PubMed