

Easy-to-use R functions to separate reduced-representation genomic datasets into sex-linked and autosomal loci, and conduct sex assignment
- PMID: 37526650
- PMCID: PMC12142712
- DOI: 10.1111/1755-0998.13844
Easy-to-use R functions to separate reduced-representation genomic datasets into sex-linked and autosomal loci, and conduct sex assignment
Abstract
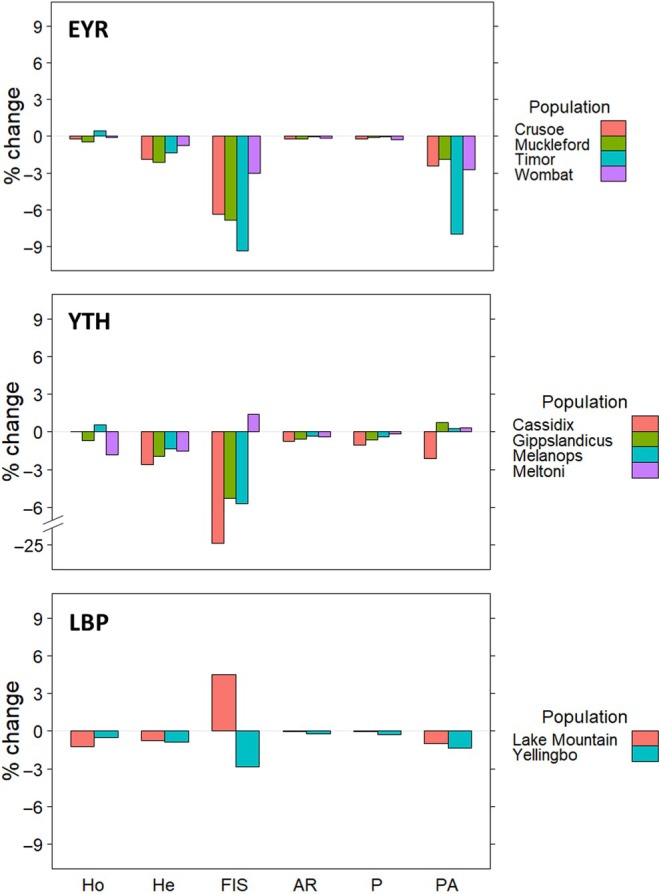
Identifying sex-linked markers in genomic datasets is important because their presence in supposedly neutral autosomal datasets can result in incorrect estimates of genetic diversity, population structure and parentage. However, detecting sex-linked loci can be challenging, and available scripts neglect some categories of sex-linked variation. Here, we present new R functions to (1) identify and separate sex-linked loci in ZW and XY sex determination systems and (2) infer the genetic sex of individuals based on these loci. We tested these functions on genomic data for two bird and one mammal species and compared the biological inferences made before and after removing sex-linked loci using our function. We found that our function identified autosomal loci with ≥98.8% accuracy and sex-linked loci with an average accuracy of 87.8%. We showed that standard filters, such as low read depth and call rate, failed to remove up to 54.7% of sex-linked loci. This led to (i) overestimation of population FIS by up to 24%, and the number of private alleles by up to 8%; (ii) wrongly inferring significant sex differences in heterozygosity; (iii) obscuring genetic population structure and (iv) inferring ~11% fewer correct parentages. We discuss how failure to remove sex-linked markers can lead to incorrect biological inferences (e.g. sex-biased dispersal and cryptic population structure) and misleading management recommendations. For reduced-representation datasets with at least 15 known-sex individuals of each sex, our functions offer convenient resources to remove sex-linked loci and to sex the remaining individuals (freely available at https://github.com/drobledoruiz/conservation_genomics).
Keywords: COLONY; bioinformatic filtering; molecular sexing; multilocus contigs; sex chromosomes; sex‐linked loci.
© 2023 The Authors. Molecular Ecology Resources published by John Wiley & Sons Ltd.
Conflict of interest statement
The authors declare no conflicts of interest to declare.
Figures


Similar articles
-
Avian sex, sex chromosomes, and dosage compensation in the age of genomics.Chromosome Res. 2014 Apr;22(1):45-57. doi: 10.1007/s10577-014-9409-9. Chromosome Res. 2014. PMID: 24599719 Review.
-
Avian Introgression Patterns are Consistent With Haldane's Rule.J Hered. 2022 Jul 23;113(4):363-370. doi: 10.1093/jhered/esac005. J Hered. 2022. PMID: 35134952 Free PMC article. Review.
-
SEXCMD: Development and validation of sex marker sequences for whole-exome/genome and RNA sequencing.PLoS One. 2017 Sep 8;12(9):e0184087. doi: 10.1371/journal.pone.0184087. eCollection 2017. PLoS One. 2017. PMID: 28886064 Free PMC article.
-
Sex-linked markers in the North American green frog (Rana clamitans) developed using DArTseq provide early insight into sex chromosome evolution.BMC Genomics. 2016 Oct 28;17(1):844. doi: 10.1186/s12864-016-3209-x. BMC Genomics. 2016. PMID: 27793086 Free PMC article.
-
SEX-DETector: A Probabilistic Approach to Study Sex Chromosomes in Non-Model Organisms.Genome Biol Evol. 2016 Aug 29;8(8):2530-43. doi: 10.1093/gbe/evw172. Genome Biol Evol. 2016. PMID: 27492231 Free PMC article.
Cited by
-
Immediate Genetic Augmentation and Enhanced Habitat Connectivity Are Required to Secure the Future of an Iconic Endangered Freshwater Fish Population.Evol Appl. 2024 Oct 12;17(10):e70019. doi: 10.1111/eva.70019. eCollection 2024 Oct. Evol Appl. 2024. PMID: 39399586 Free PMC article.
-
Seascape Genomics of the Smooth Hammerhead Shark Sphyrna zygaena Reveals Regional Adaptive Clinal Variation.Ecol Evol. 2024 Dec 12;14(12):e70644. doi: 10.1002/ece3.70644. eCollection 2024 Dec. Ecol Evol. 2024. PMID: 39669504 Free PMC article.
-
Planning and implementing genetic rescue of an endangered freshwater fish population in a regulated river, where low flow reduces breeding opportunities and may trigger inbreeding depression.Evol Appl. 2024 Apr 11;17(4):e13679. doi: 10.1111/eva.13679. eCollection 2024 Apr. Evol Appl. 2024. PMID: 38617824 Free PMC article.
References
-
- Ahrens, C. W. , Jordan, R. , Bragg, J. , Harrison, P. A. , Hopley, T. , Bothwell, H. , & Rymer, P. D. (2021). Regarding the F‐word: The effects of data filtering on inferred genotype‐environment associations. Molecular Ecology Resources, 21(5), 1460–1474. - PubMed
-
- Altschul, S. F. , Gish, W. , Miller, W. , Myers, E. W. , & Lipman, D. J. (1990). Basic local alignment search tool. Journal of Molecular Biology, 215(3), 403–410. - PubMed
-
- Amos, J. N. , Harrisson, K. A. , Radford, J. Q. , White, M. , Newell, G. , Mac Nally, R. , Sunnucks, P. , & Pavlova, A. (2014). Species‐ and sex‐specific connectivity effects of habitat fragmentation in a suite of woodland birds. Ecology, 95, 1556–1568. - PubMed
-
- Arnold, B. D. , & Wilkinson, G. S. (2015). Female natal philopatry and gene flow between divergent clades of pallid bats (Antrozous pallidus). Journal of Mammalogy, 96(3), 531–540.
MeSH terms
Grants and funding
LinkOut - more resources
Full Text Sources
Miscellaneous
