

The role of KPNA2 as a monotonically changing differentially expressed gene in the diagnosis, risk stratification, and chemotherapy sensitivity of chronic hepatitis B-liver cirrhosis-hepatocellular carcinoma
- PMID: 37526663
- PMCID: PMC11798192
- DOI: 10.1007/s00432-023-05213-z
The role of KPNA2 as a monotonically changing differentially expressed gene in the diagnosis, risk stratification, and chemotherapy sensitivity of chronic hepatitis B-liver cirrhosis-hepatocellular carcinoma
Abstract
Purpose: Chronic hepatitis B-liver cirrhosis-hepatocellular carcinoma (CLH), commonly called the "liver cancer trilogy", is a crucial evolutionary phase in the emergence of hepatocellular carcinoma (HCC) in China. Previous studies on early diagnostic biomarkers of HCC were limited to the end-stage of HCC and did not focus on the evolutionary process of CLH.
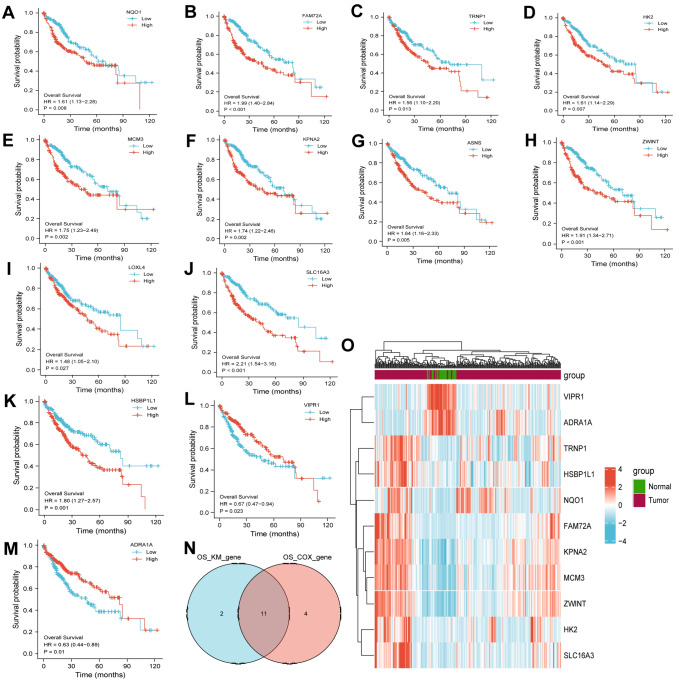
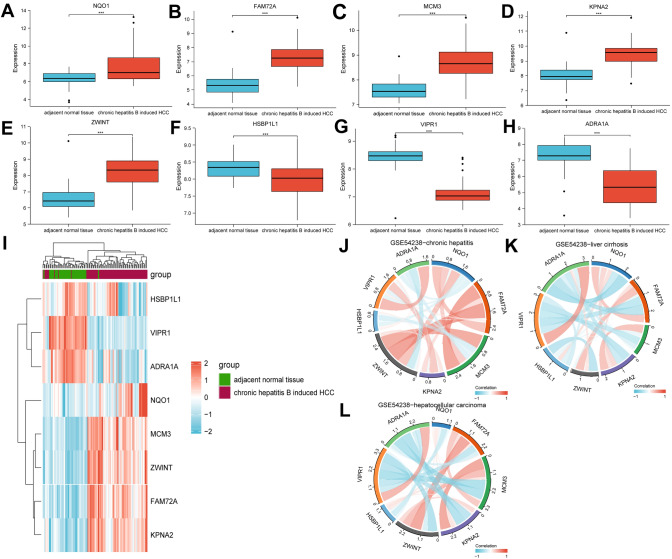
Methods: 11 monotonically changing differentially expressed genes (MCDEGs) highly correlated with CLH were screened through bioinformatic analysis and KPNA2 was identified for further research. The serum KPNA2 expression in different CLH states was detected by Enzyme linked immunosorbent assay (ELISA). A nomogram model was constructed using univariate and multivariate Cox regression methods.
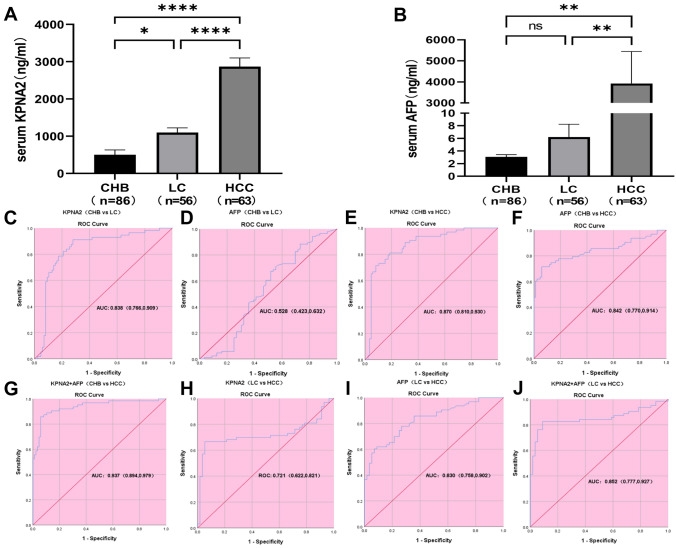
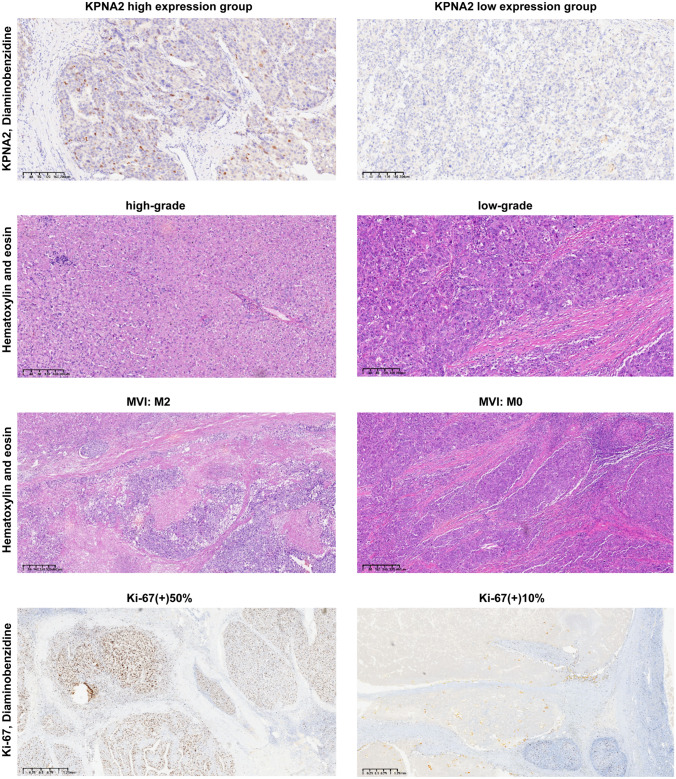
Results: The single-cell RNA-seq and bulk RNA-seq revealed that KPNA2 related to immune infiltration in HCC and may participate in cell cycle pathways in HCC. The serum KPNA2 expression was monotonically upregulated in CLH and was valuable for diagnosing different CLH states. Besides, chronic hepatitis B(CHB) patients, liver cirrhosis (LC) patients, and HCC patients were classified into subgroups with distinct serum KPNA2 expressions. Accordingly, patients with different serum KPNA2 expressions displayed various clinicopathological features. The AUC value of the nomogram model was 0.959 in predicting the likelihood of developing HCC in CHB patients or LC patients. Finally, we found that KPNA2 expression was negatively correlated with the IC50 of four chemotherapeutic drugs in HCC.
Conclusion: KPNA2 was a novel serum biomarker for diagnosing different CLH states, monitoring the dynamic evolution of CLH, and a new therapeutic target for intervening in the progression of CLH.
Keywords: Biomarker; Diagnosis; Hepatocellular carcinoma; Karyopherin subunit alpha 2; Risk stratification.
© 2023. The Author(s), under exclusive licence to Springer-Verlag GmbH Germany, part of Springer Nature.
Conflict of interest statement
The authors declare that they have no conflict of interest.
Figures


Similar articles
-
Bioinformatics analysis and experimental studies reveal KPNA2 as a novel biomarker of hepatocellular carcinoma progression and telomere maintenance.Eur J Med Res. 2025 Jul 16;30(1):628. doi: 10.1186/s40001-025-02866-z. Eur J Med Res. 2025. PMID: 40665355 Free PMC article.
-
A novel prognostic model based on immunogenic cell death-related genes for improved risk stratification in hepatocellular carcinoma patients.J Cancer Res Clin Oncol. 2023 Sep;149(12):10255-10267. doi: 10.1007/s00432-023-04950-5. Epub 2023 Jun 3. J Cancer Res Clin Oncol. 2023. PMID: 37269346 Free PMC article.
-
Surveillance of cirrhosis for hepatocellular carcinoma: systematic review and economic analysis.Health Technol Assess. 2007 Sep;11(34):1-206. doi: 10.3310/hta11340. Health Technol Assess. 2007. PMID: 17767898
-
Adefovir dipivoxil and pegylated interferon alfa-2a for the treatment of chronic hepatitis B: a systematic review and economic evaluation.Health Technol Assess. 2006 Aug;10(28):iii-iv, xi-xiv, 1-183. doi: 10.3310/hta10280. Health Technol Assess. 2006. PMID: 16904047
-
Contrast-enhanced ultrasound using SonoVue® (sulphur hexafluoride microbubbles) compared with contrast-enhanced computed tomography and contrast-enhanced magnetic resonance imaging for the characterisation of focal liver lesions and detection of liver metastases: a systematic review and cost-effectiveness analysis.Health Technol Assess. 2013 Apr;17(16):1-243. doi: 10.3310/hta17160. Health Technol Assess. 2013. PMID: 23611316 Free PMC article.
Cited by
-
Identification of prognostic biomarkers related to epithelial-mesenchymal transition and anoikis in hepatocellular carcinoma using transcriptomics and single-cell sequencing.Front Cell Dev Biol. 2025 Jun 19;13:1600546. doi: 10.3389/fcell.2025.1600546. eCollection 2025. Front Cell Dev Biol. 2025. PMID: 40612108 Free PMC article.
References
-
- Ballard DH (2023) Microvascular invasion in hepatocellular carcinoma: bridging the global gap between imaging and clinical practice. Acad Radiol. 10.1016/j.acra.2023.05.017 - PubMed
-
- Cai X, Tang D, Chen J et al (2023) Evaluation of serum FGL1 as diagnostic markers for hbv-related hepatocellular carcinoma. Lab Med 54:270–281. 10.1093/labmed/lmac094 - PubMed
-
- Cassany A, Guillemain G, Klein C et al (2004) A karyopherin alpha2 nuclear transport pathway is regulated by glucose in hepatic and pancreatic cells. Traffic 5:10–19. 10.1046/j.1398-9219.2003.0143.x - PubMed
Grants and funding
LinkOut - more resources
Full Text Sources
Miscellaneous
