. 2023 Aug 1;87(2):35.
doi: 10.1007/s00285-023-01958-w.

Unifying incidence and prevalence under a time-varying general branching process

Affiliations

Unifying incidence and prevalence under a time-varying general branching process

Mikko S Pakkanen et al. J Math Biol. .

Abstract

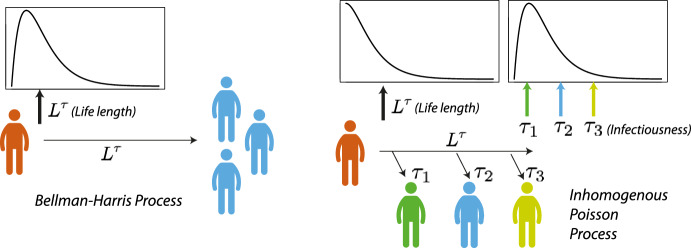
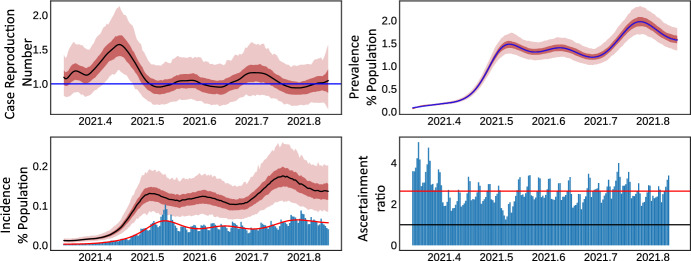
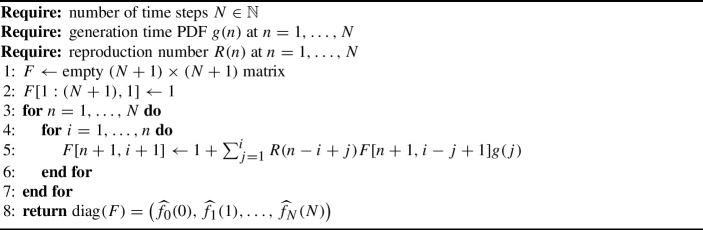
Renewal equations are a popular approach used in modelling the number of new infections, i.e., incidence, in an outbreak. We develop a stochastic model of an outbreak based on a time-varying variant of the Crump-Mode-Jagers branching process. This model accommodates a time-varying reproduction number and a time-varying distribution for the generation interval. We then derive renewal-like integral equations for incidence, cumulative incidence and prevalence under this model. We show that the equations for incidence and prevalence are consistent with the so-called back-calculation relationship. We analyse two particular cases of these integral equations, one that arises from a Bellman-Harris process and one that arises from an inhomogeneous Poisson process model of transmission. We also show that the incidence integral equations that arise from both of these specific models agree with the renewal equation used ubiquitously in infectious disease modelling. We present a numerical discretisation scheme to solve these equations, and use this scheme to estimate rates of transmission from serological prevalence of SARS-CoV-2 in the UK and historical incidence data on Influenza, Measles, SARS and Smallpox.

Keywords: Back-calculation; Branching process; COVID-19; Crump–Mode–Jagers process; Incidence; Inhomogenous Poisson process; Prevalence; Renewal equation; Reproduction number; Time varying reproduction number.


Figures

Fig. 1
Fig. 1
Simulation of an age-dependent Bellman–Harris branching process in terms of prevalence. Left plot shows the Monte Carlo mean (red) alongside the theoretical mean (green). Right plot shows both the Monte Carlo and theoretical mean, overlaid on the underlying 1,000 simulated trajectories (translucent black lines). In this example, the time-varying reproduction number is given by R(t)=1.15+sin(0.15t), while the generation interval follows the Gamma(3,1) distribution. Algorithm 2, given below, is used to compute the theoretical mean (color figure online)
Fig. 2
Fig. 2
Schematic of infections generated under a Bellman–Harris process and an inhomogeneous Poisson process model. In a Bellman–Harris process, after a generation interval has elapsed, new infections happen at the same time (instantaneously). In the inhomogeneous Poisson process model, an individual is infectious for a period, over which their infectiousness varies, and they produce infections one by one
Algorithm 1
Algorithm 1
Discretisation of integral equations
Algorithm 2
Algorithm 2
Discretisation of integral equations, vectorised
Fig. 3
Fig. 3
Bayesian modelling of incidence for Influenza (Frost and Sydenstricker 1919), Measles (Groendyke et al. 2011), SARS (Lipsitch et al. 2003) and Smallpox (Gani and Leach 2001). Plots show the case reproduction number R(t), the distribution g(·) in discretised form and incidence for the Bellman–Harris process. Solid black lines in all plots are means, and the two red envelopes are the interquartile and 95% credible intervals. The horizontal blue line indicates R=1. The x-axis in all plots is time measured in days (color figure online)
Fig. 4
Fig. 4
Bayesian modelling of the ONS COVID-19 infection survey for prevalence. Top left show the case reproduction number R(t), top right prevalence, bottom left incidence and bottom right the ascertainment ratio (incidence/reported cases). Solid black lines in all plots are means, and the two red envelopes are the interquartile and 95% credible intervals. The horizontal blue line indicates R=1. The x-axis in all plots is decimal calendar time. The ascertainment ratio in the bottom right is adjusted for the reporting delay between infections and cases, and this delay is estimated as the maximal lagged cross correlation (color figure online)
Algorithm 3
Algorithm 3
Discretisation of integral equations, cumulative incidence under Bellman–Harris

References

    1. Aldis GK, Roberts MG. An integral equation model for the control of a smallpox outbreak. Math Biosci. 2005;195(1):1–22. doi: 10.1016/j.mbs.2005.01.006. - DOI - PubMed
    1. Allen LJS. A primer on stochastic epidemic models: formulation, numerical simulation, and analysis. Infect Dis Model. 2017;2(2):128–142. - PMC - PubMed
    1. Bartoszynski R (1967) Branching processes and the theory of epidemics. In: Proceedings of the fifth Berkeley symposium on mathematical statistics and probability, 1965-1966, University of California Press, Berkeley, pp 259-269
    1. Bellman R, Harris T. On age-dependent binary branching processes. Ann Math. 1952;55:280–295. doi: 10.2307/1969779. - DOI
    1. Bellman R, Harris TE. On the theory of age-dependent stochastic branching processes. Proc Natl Acad Sci USA. 1948;34:601–604. doi: 10.1073/pnas.34.12.601. - DOI - PMC - PubMed

Publication types