. 2023 Aug 29;42(8):112889.
doi: 10.1016/j.celrep.2023.112889. Epub 2023 Jul 31.

IGFBPL1 is a master driver of microglia homeostasis and resolution of neuroinflammation in glaucoma and brain tauopathy

Affiliations

IGFBPL1 is a master driver of microglia homeostasis and resolution of neuroinflammation in glaucoma and brain tauopathy

Li Pan et al. Cell Rep. .

Abstract

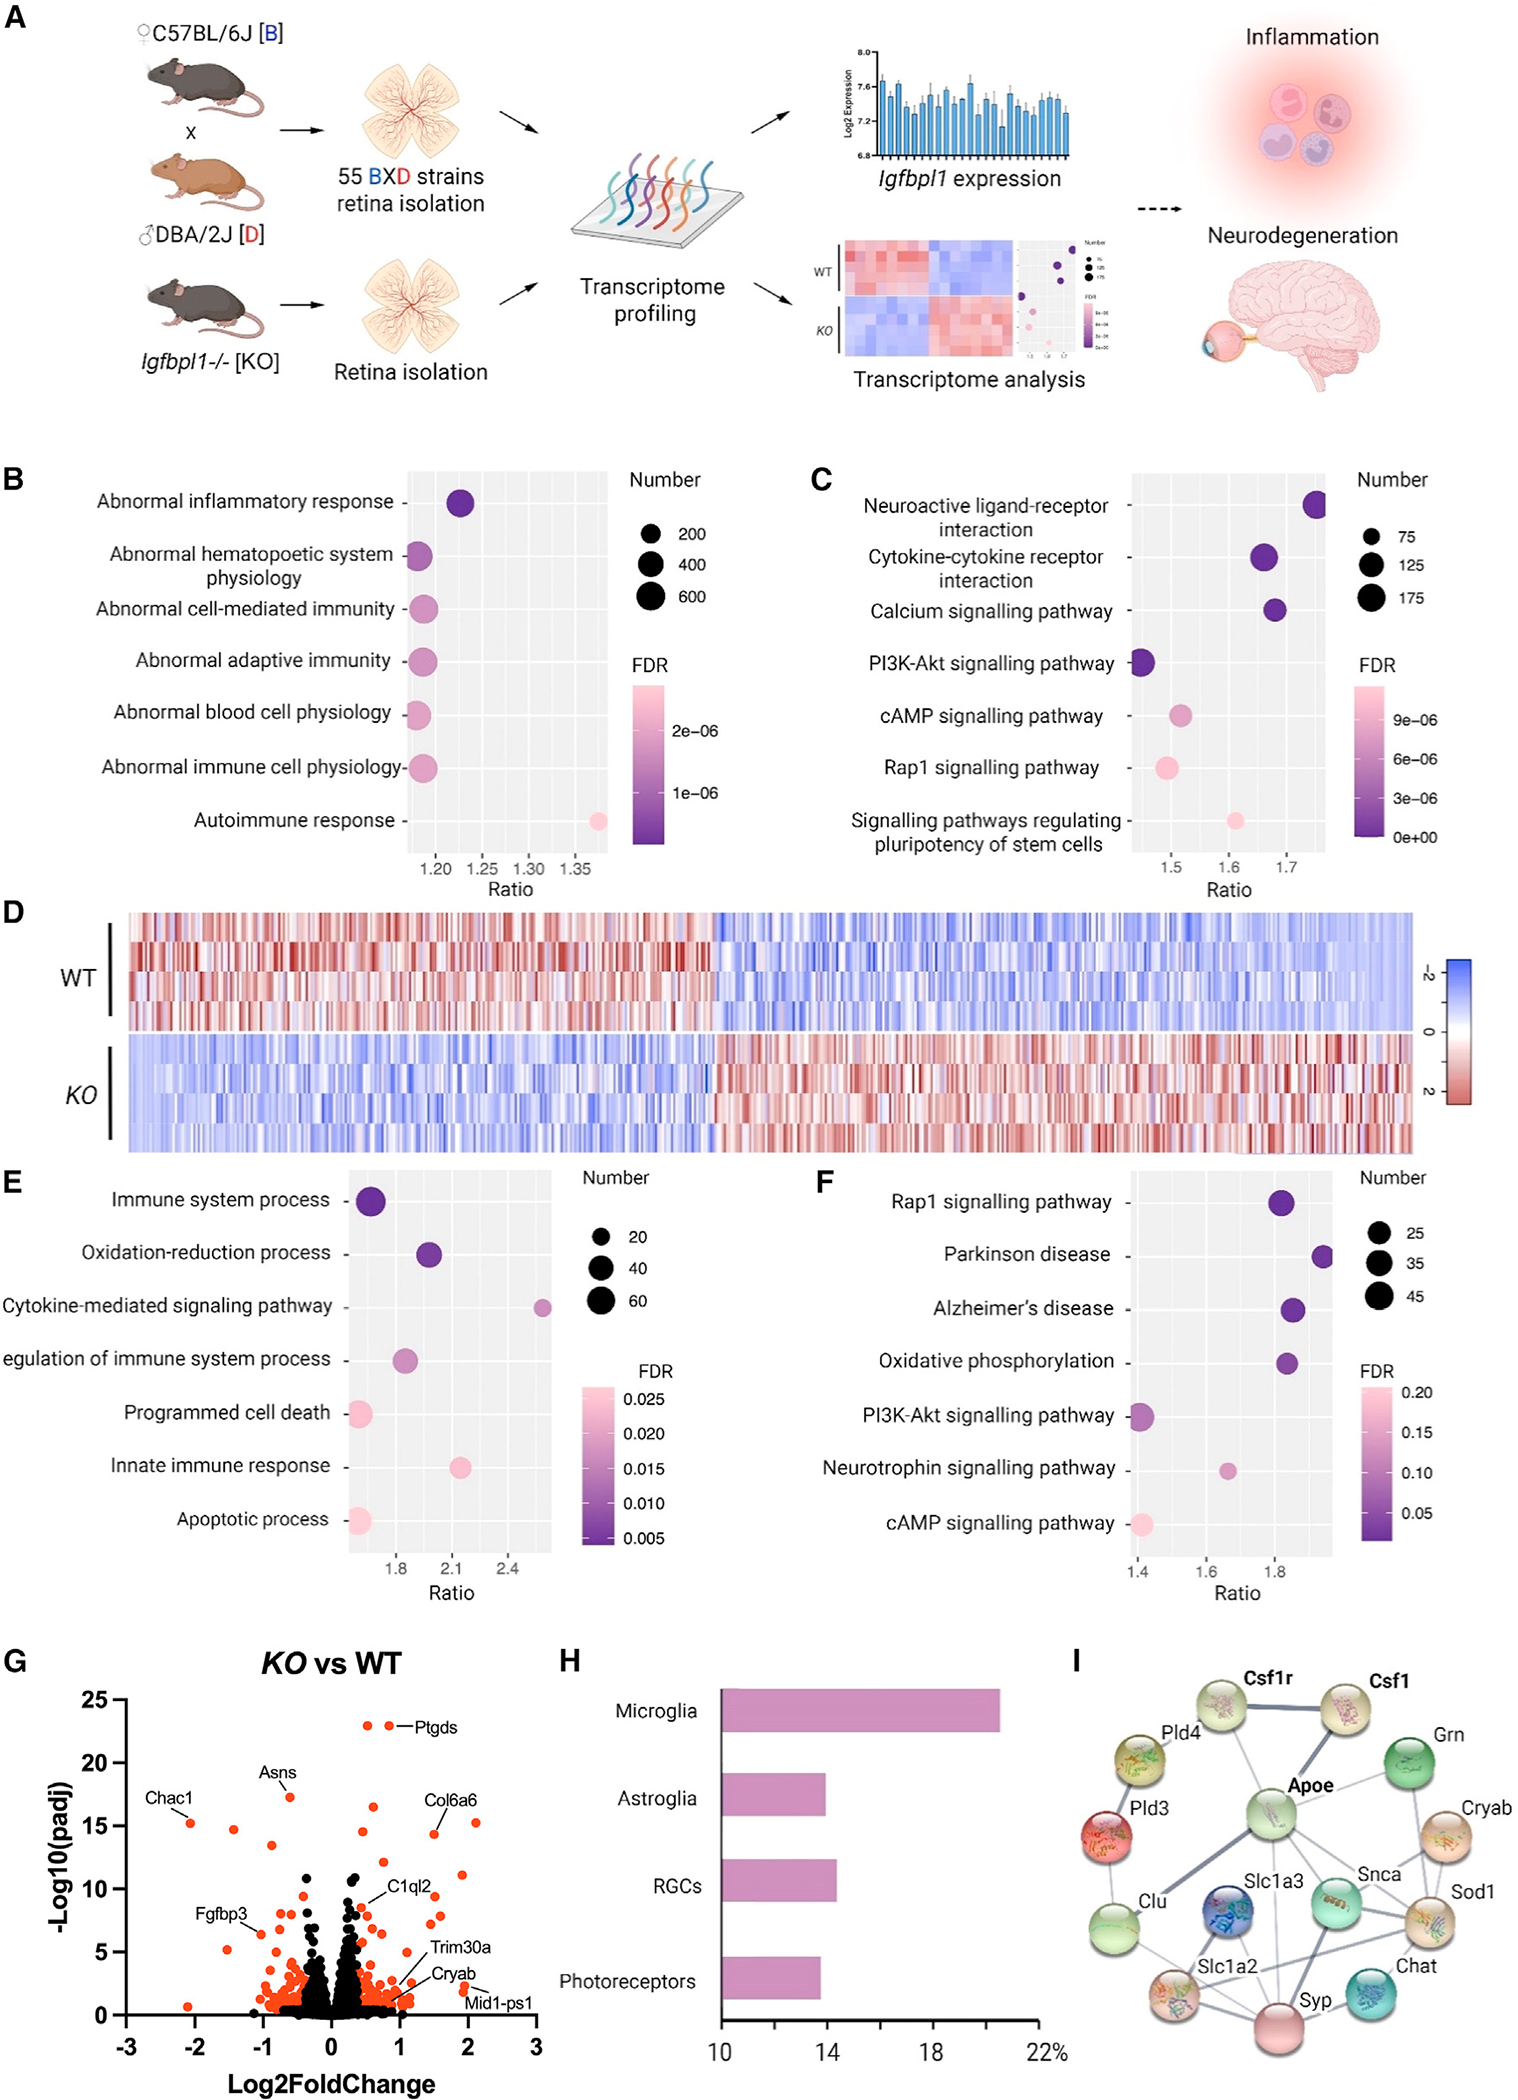
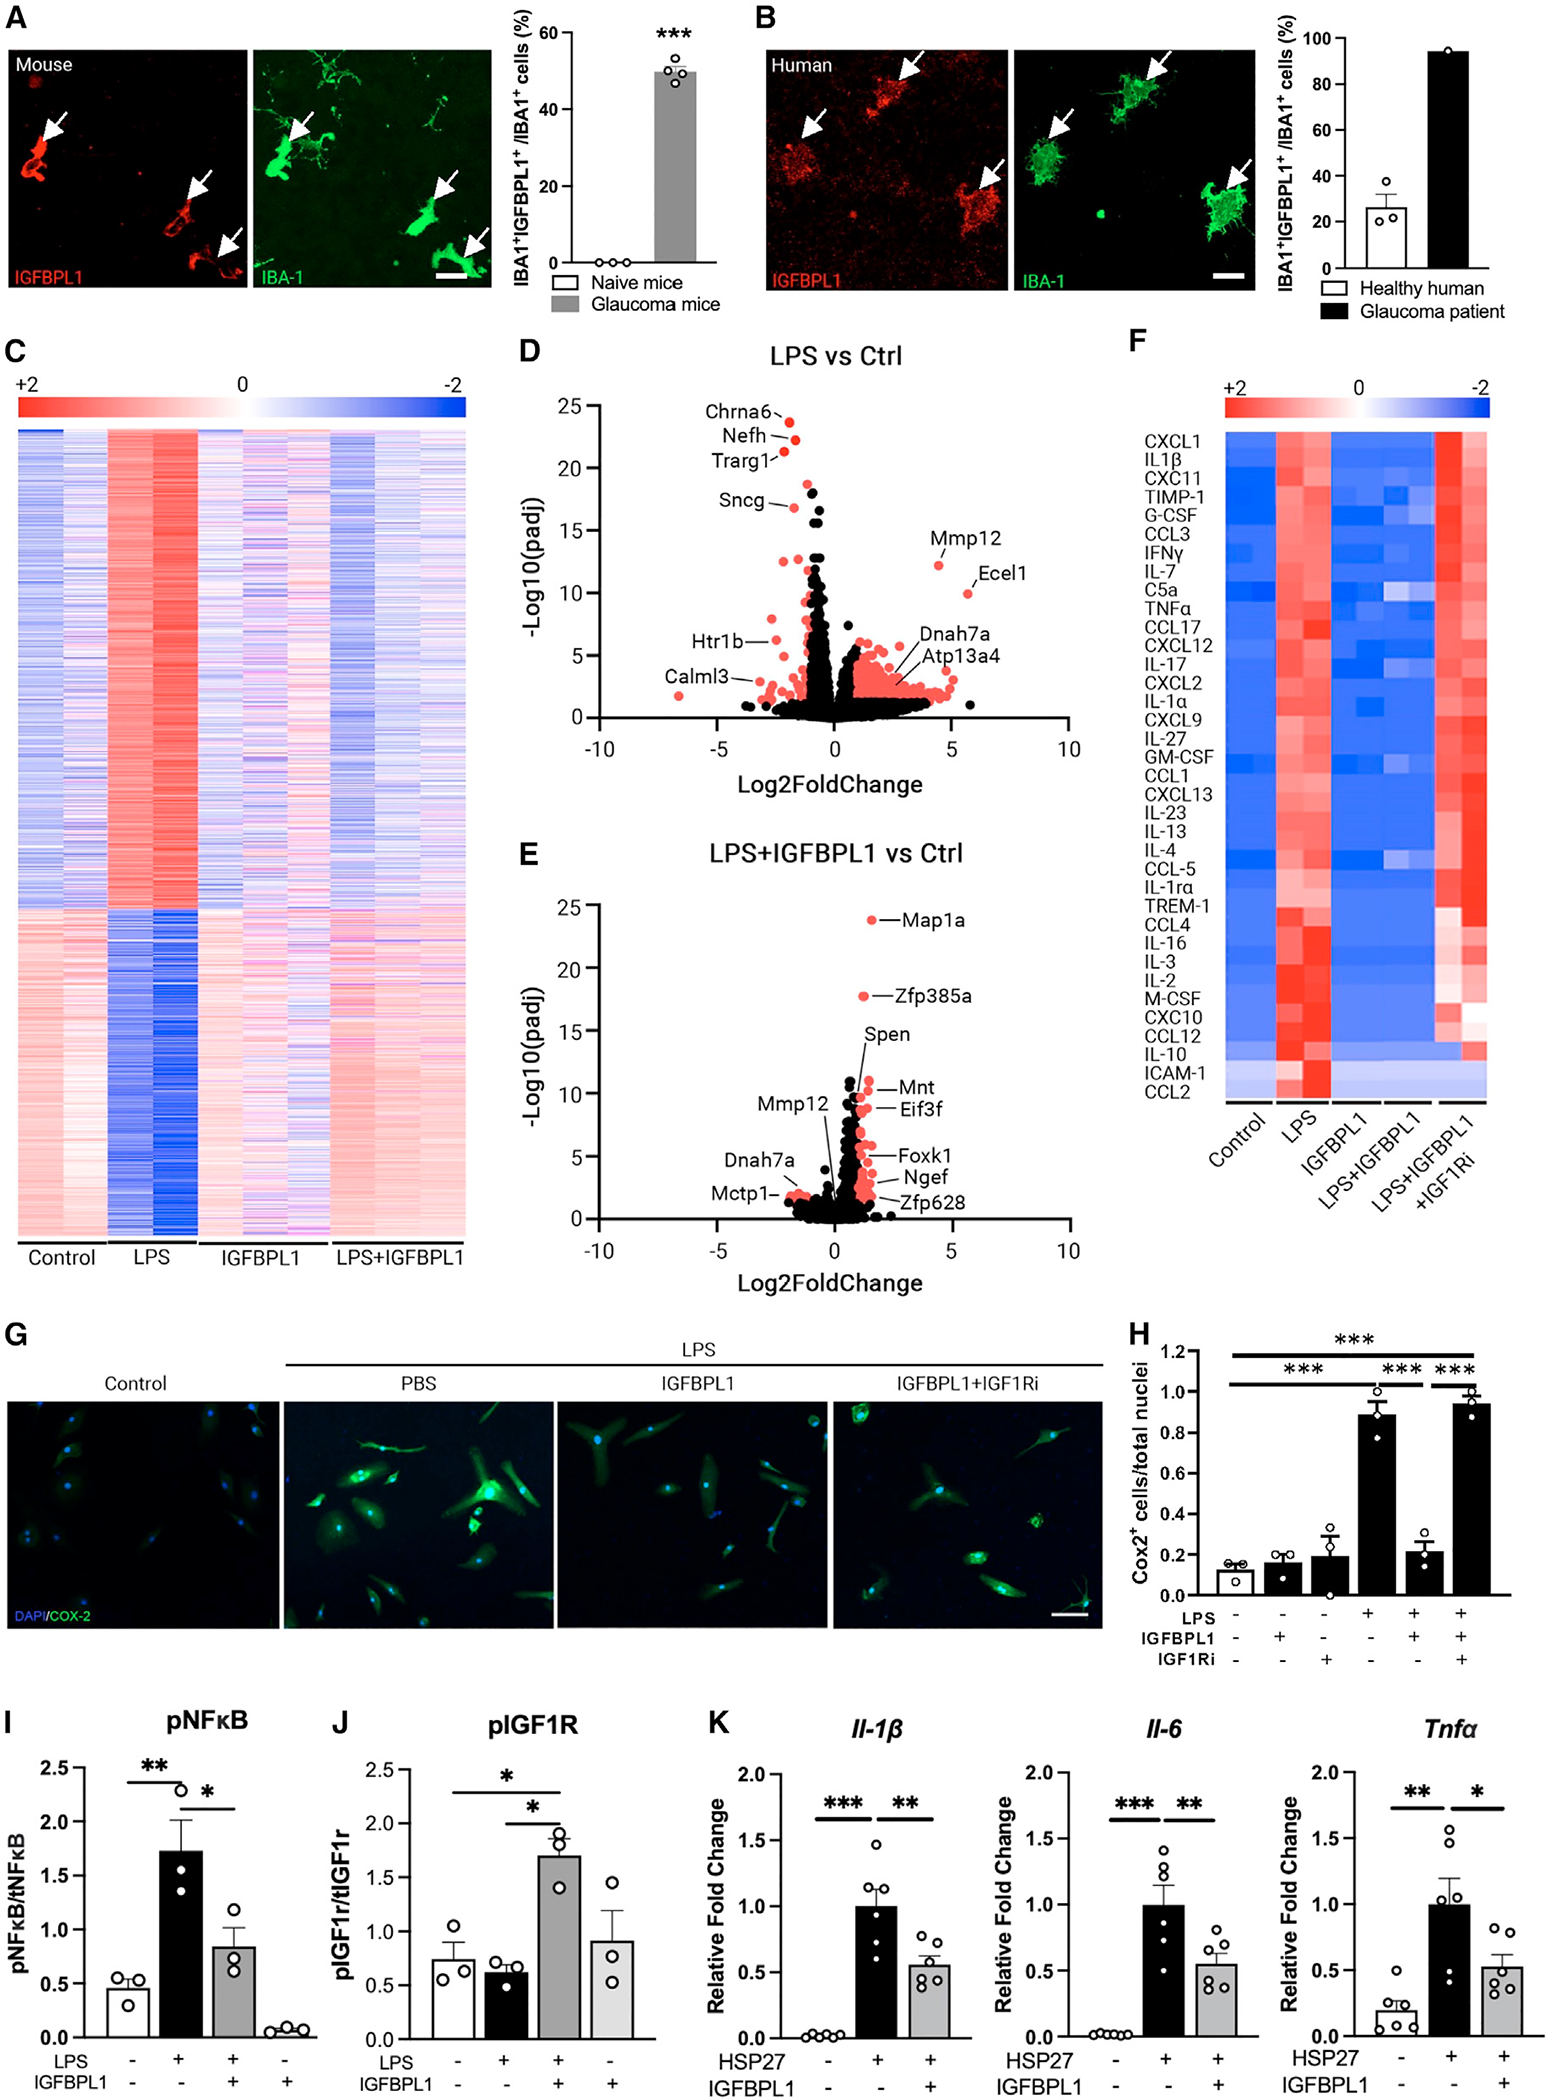
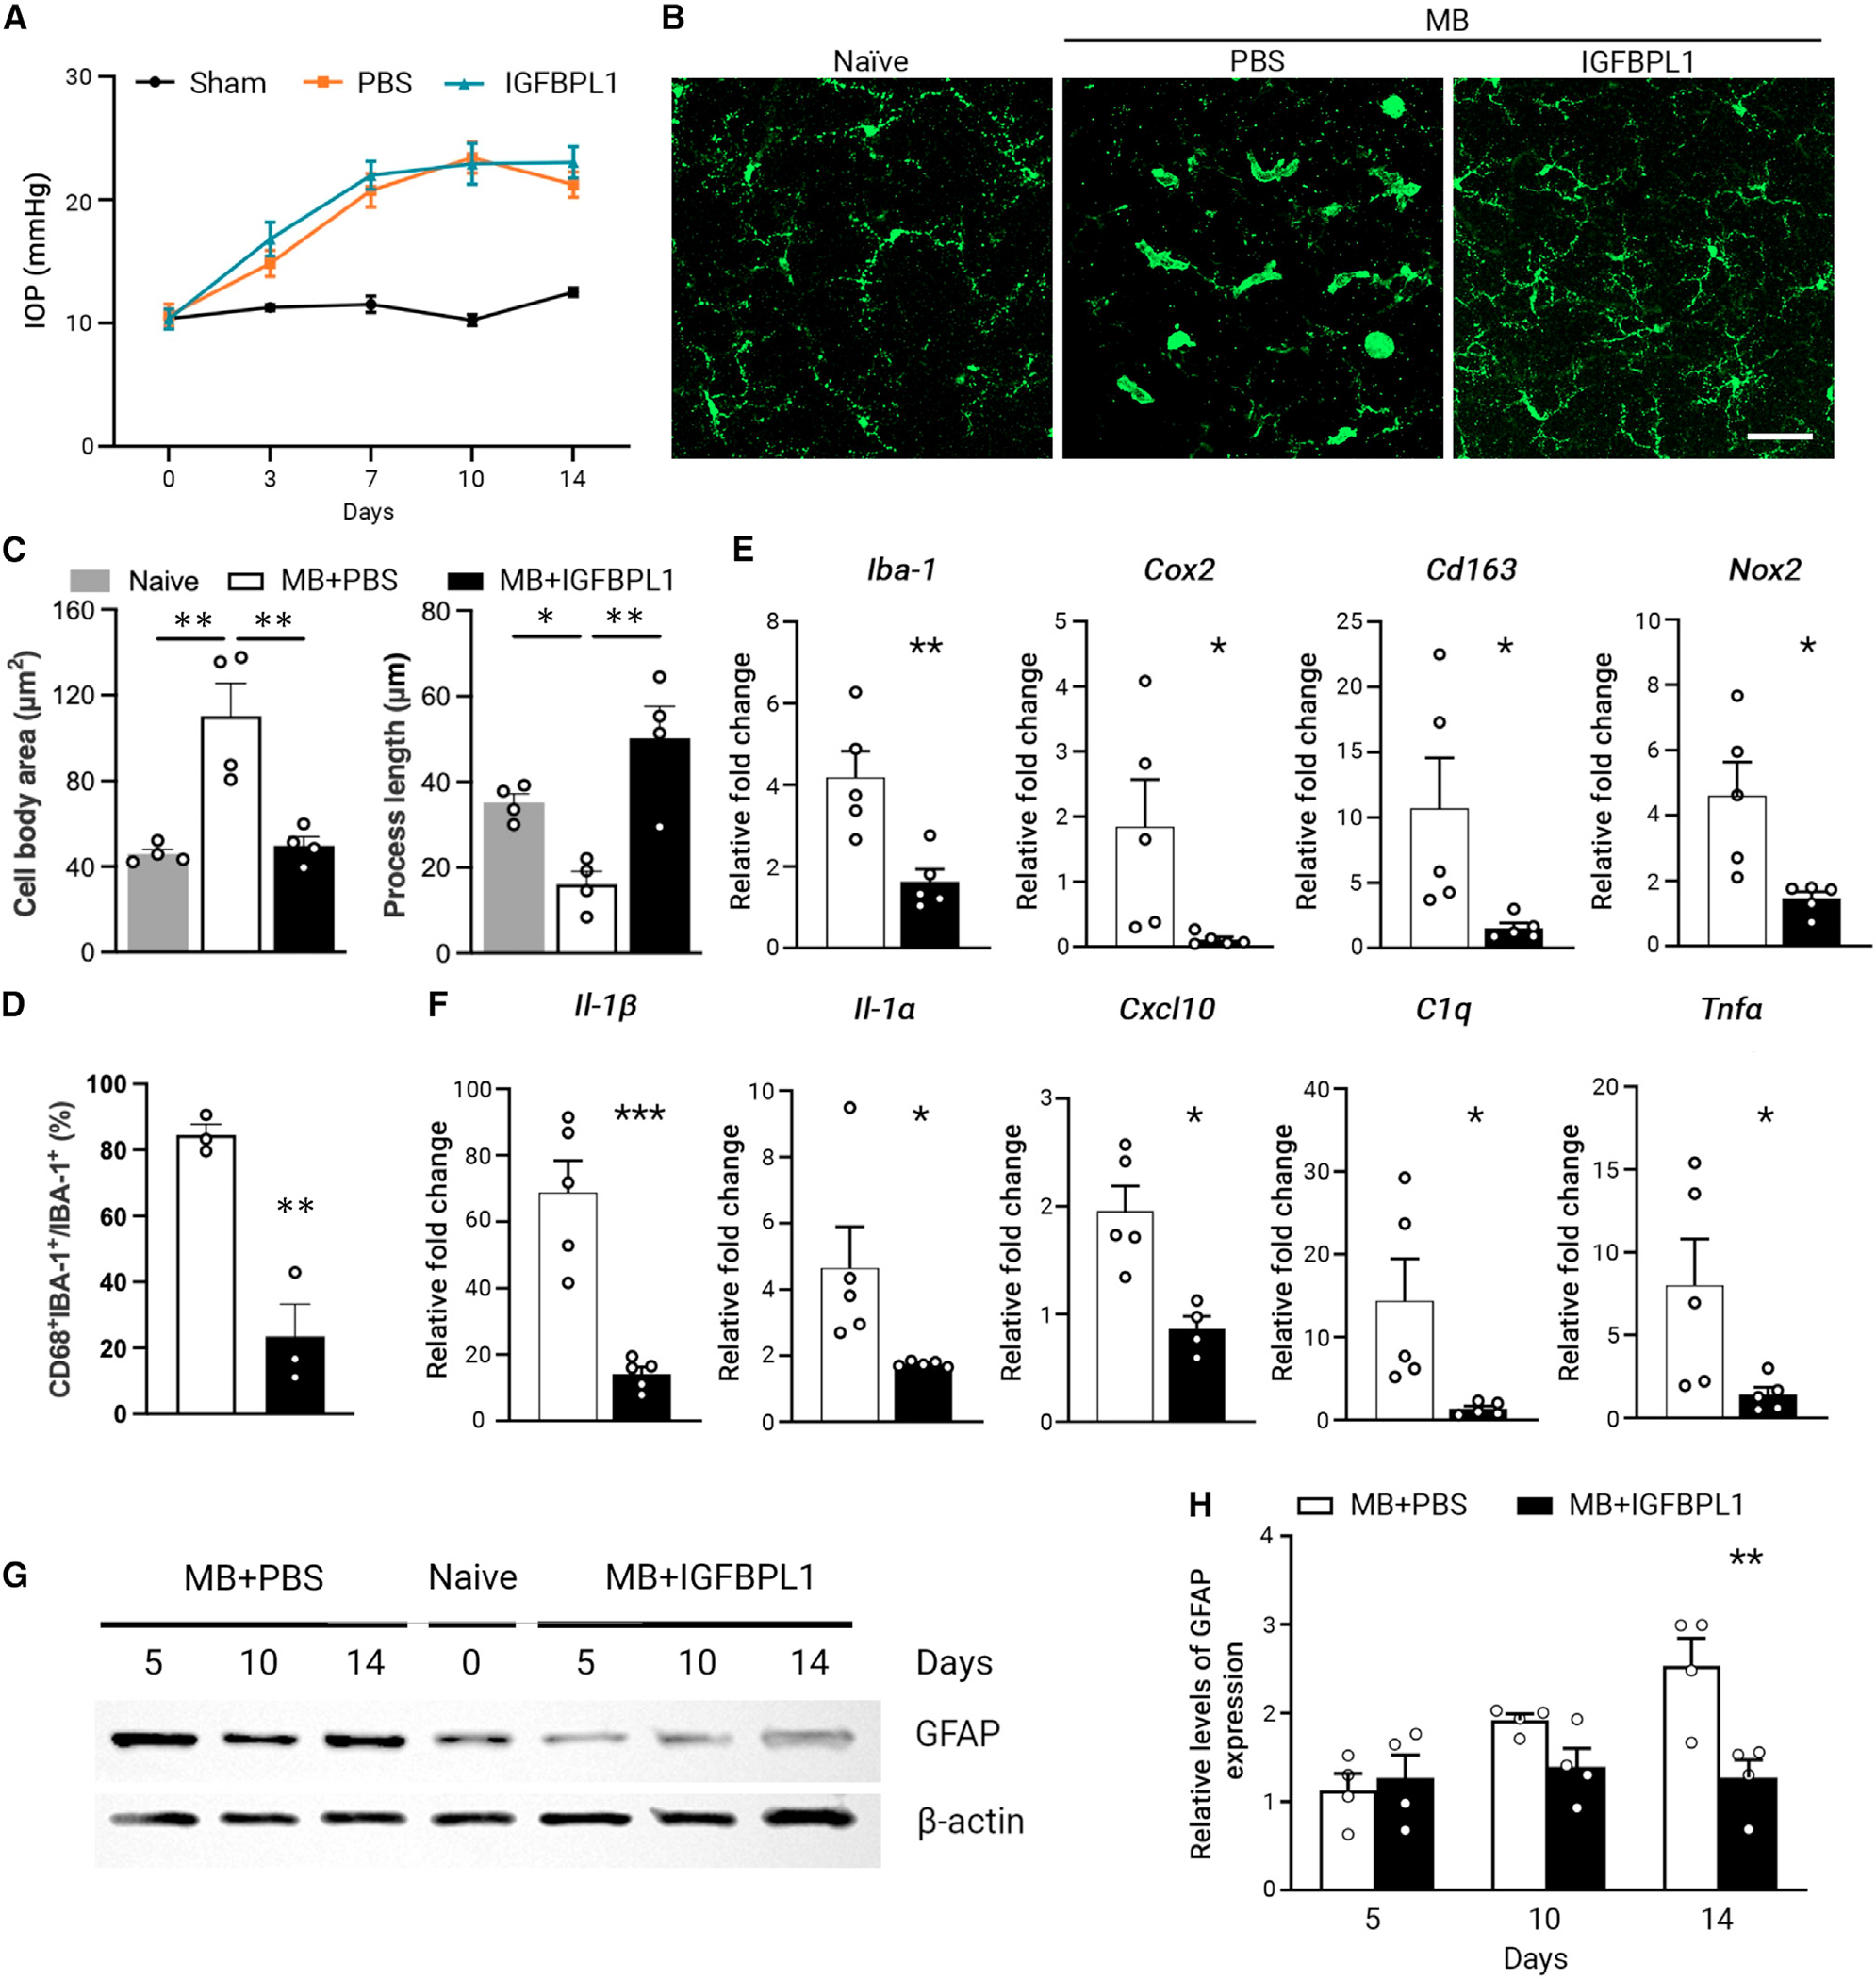
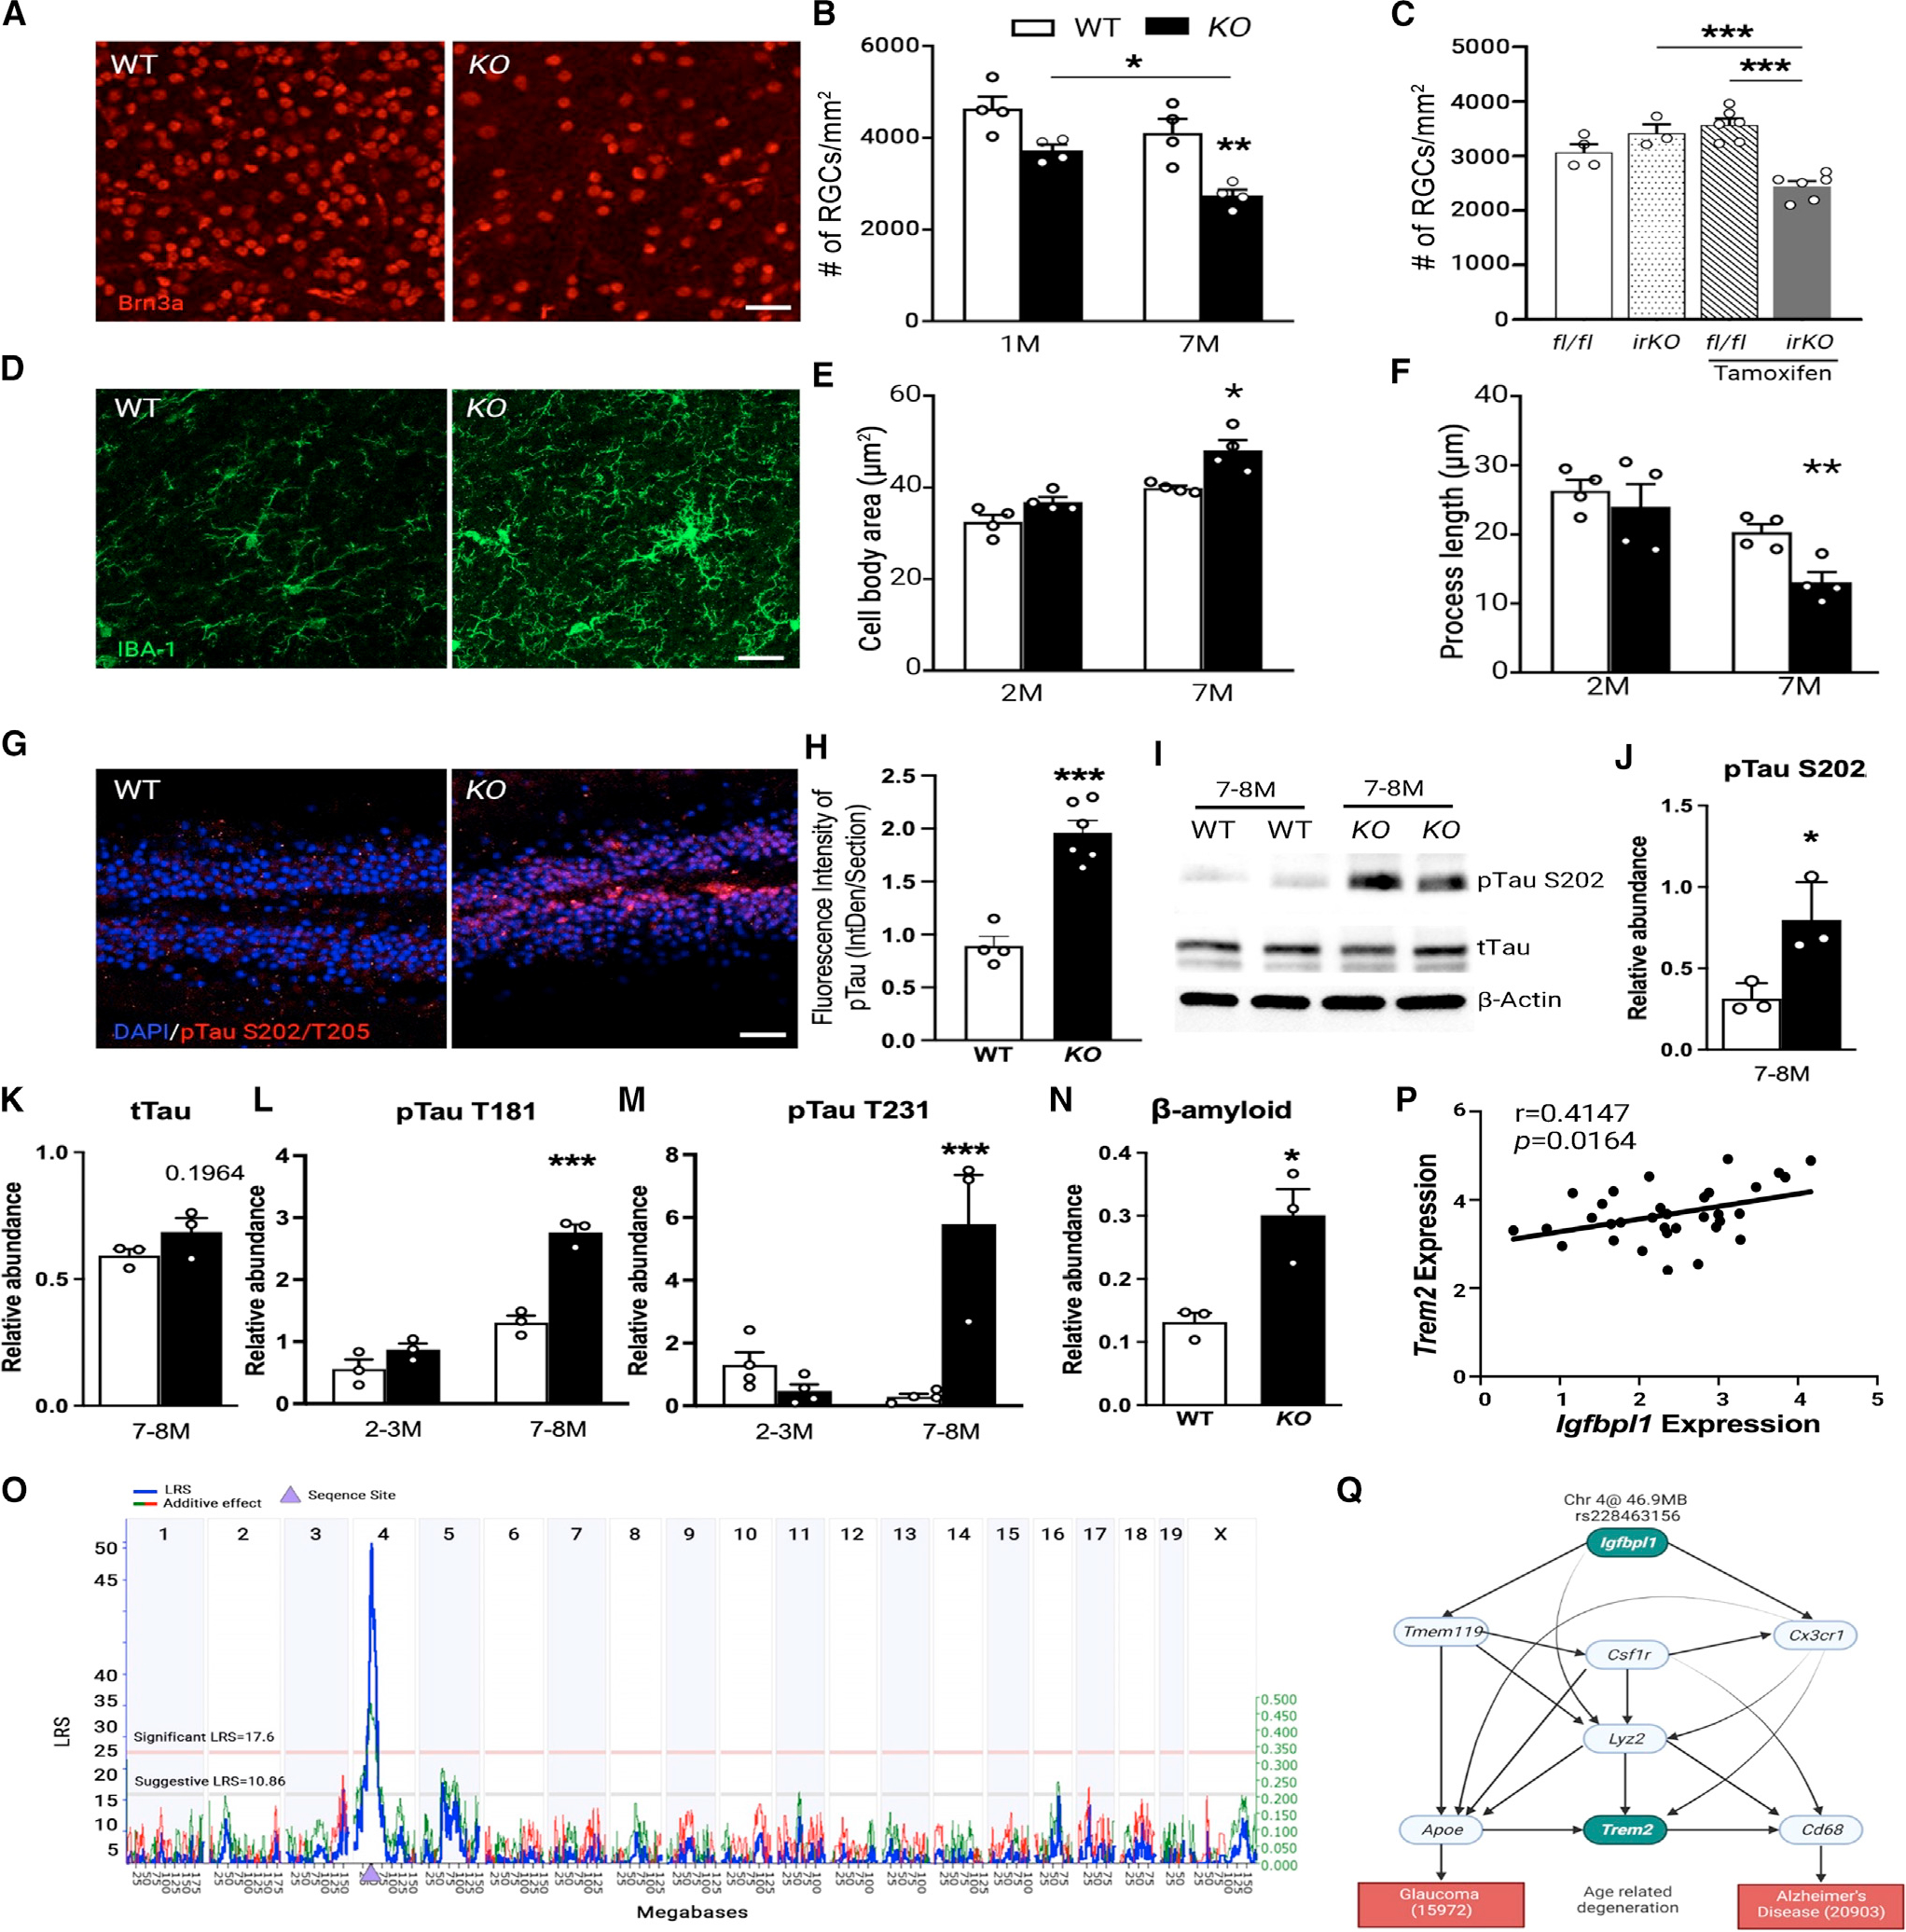
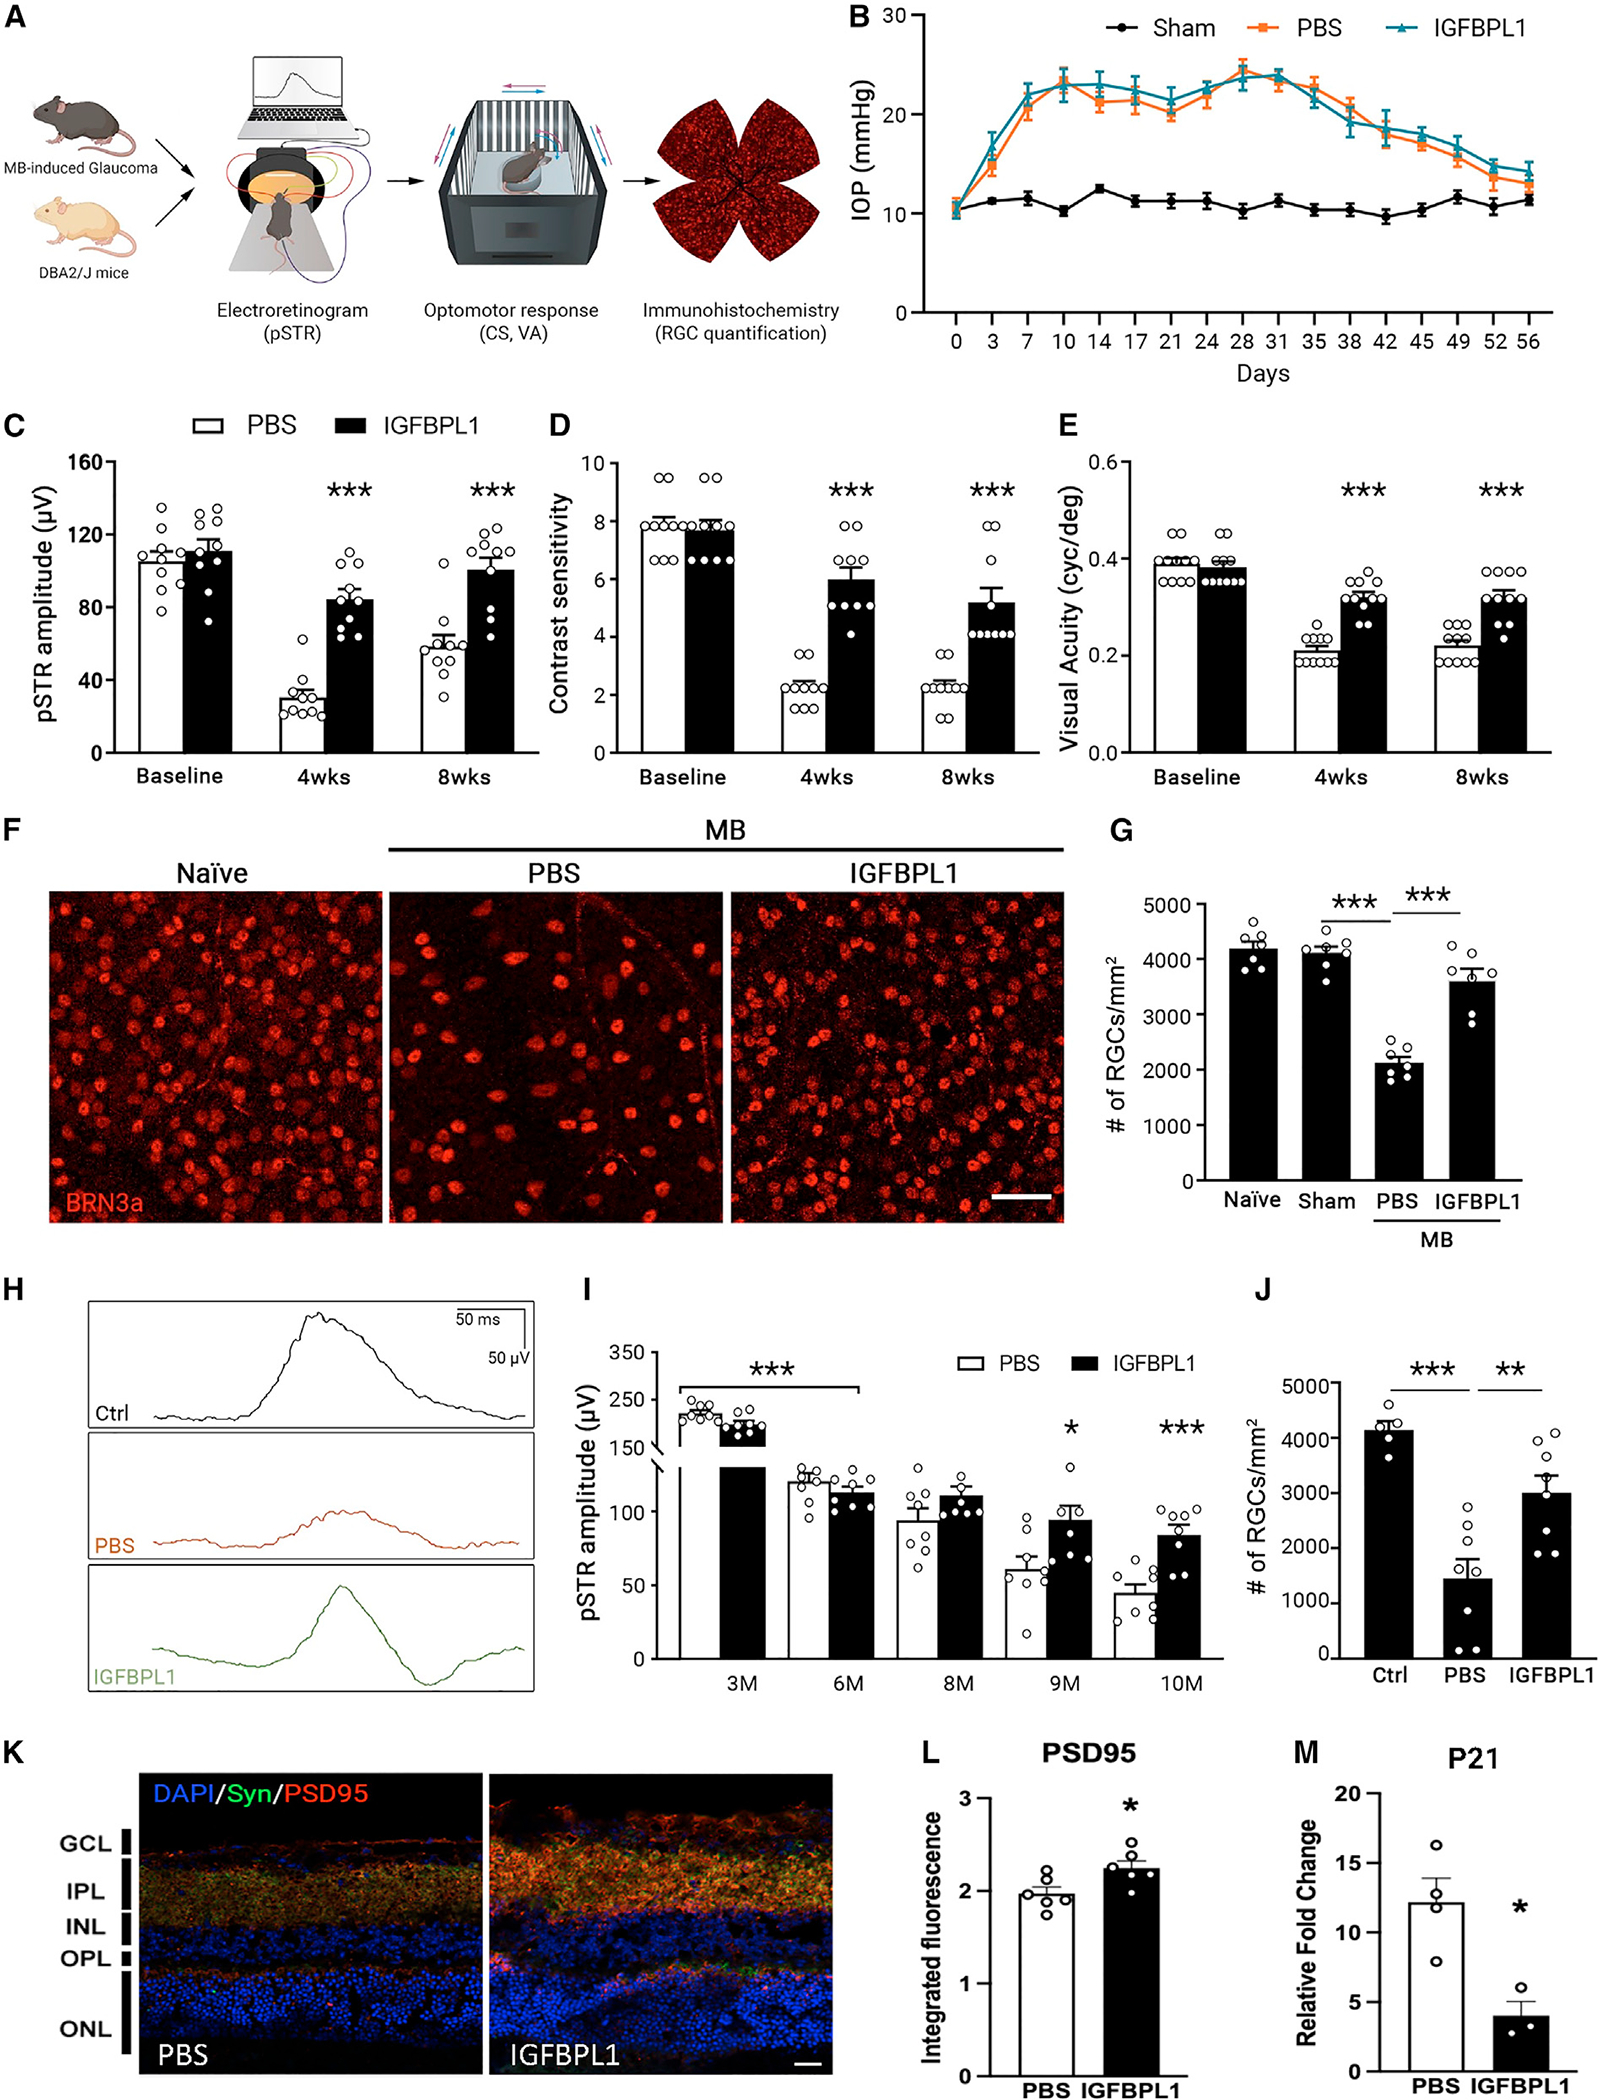
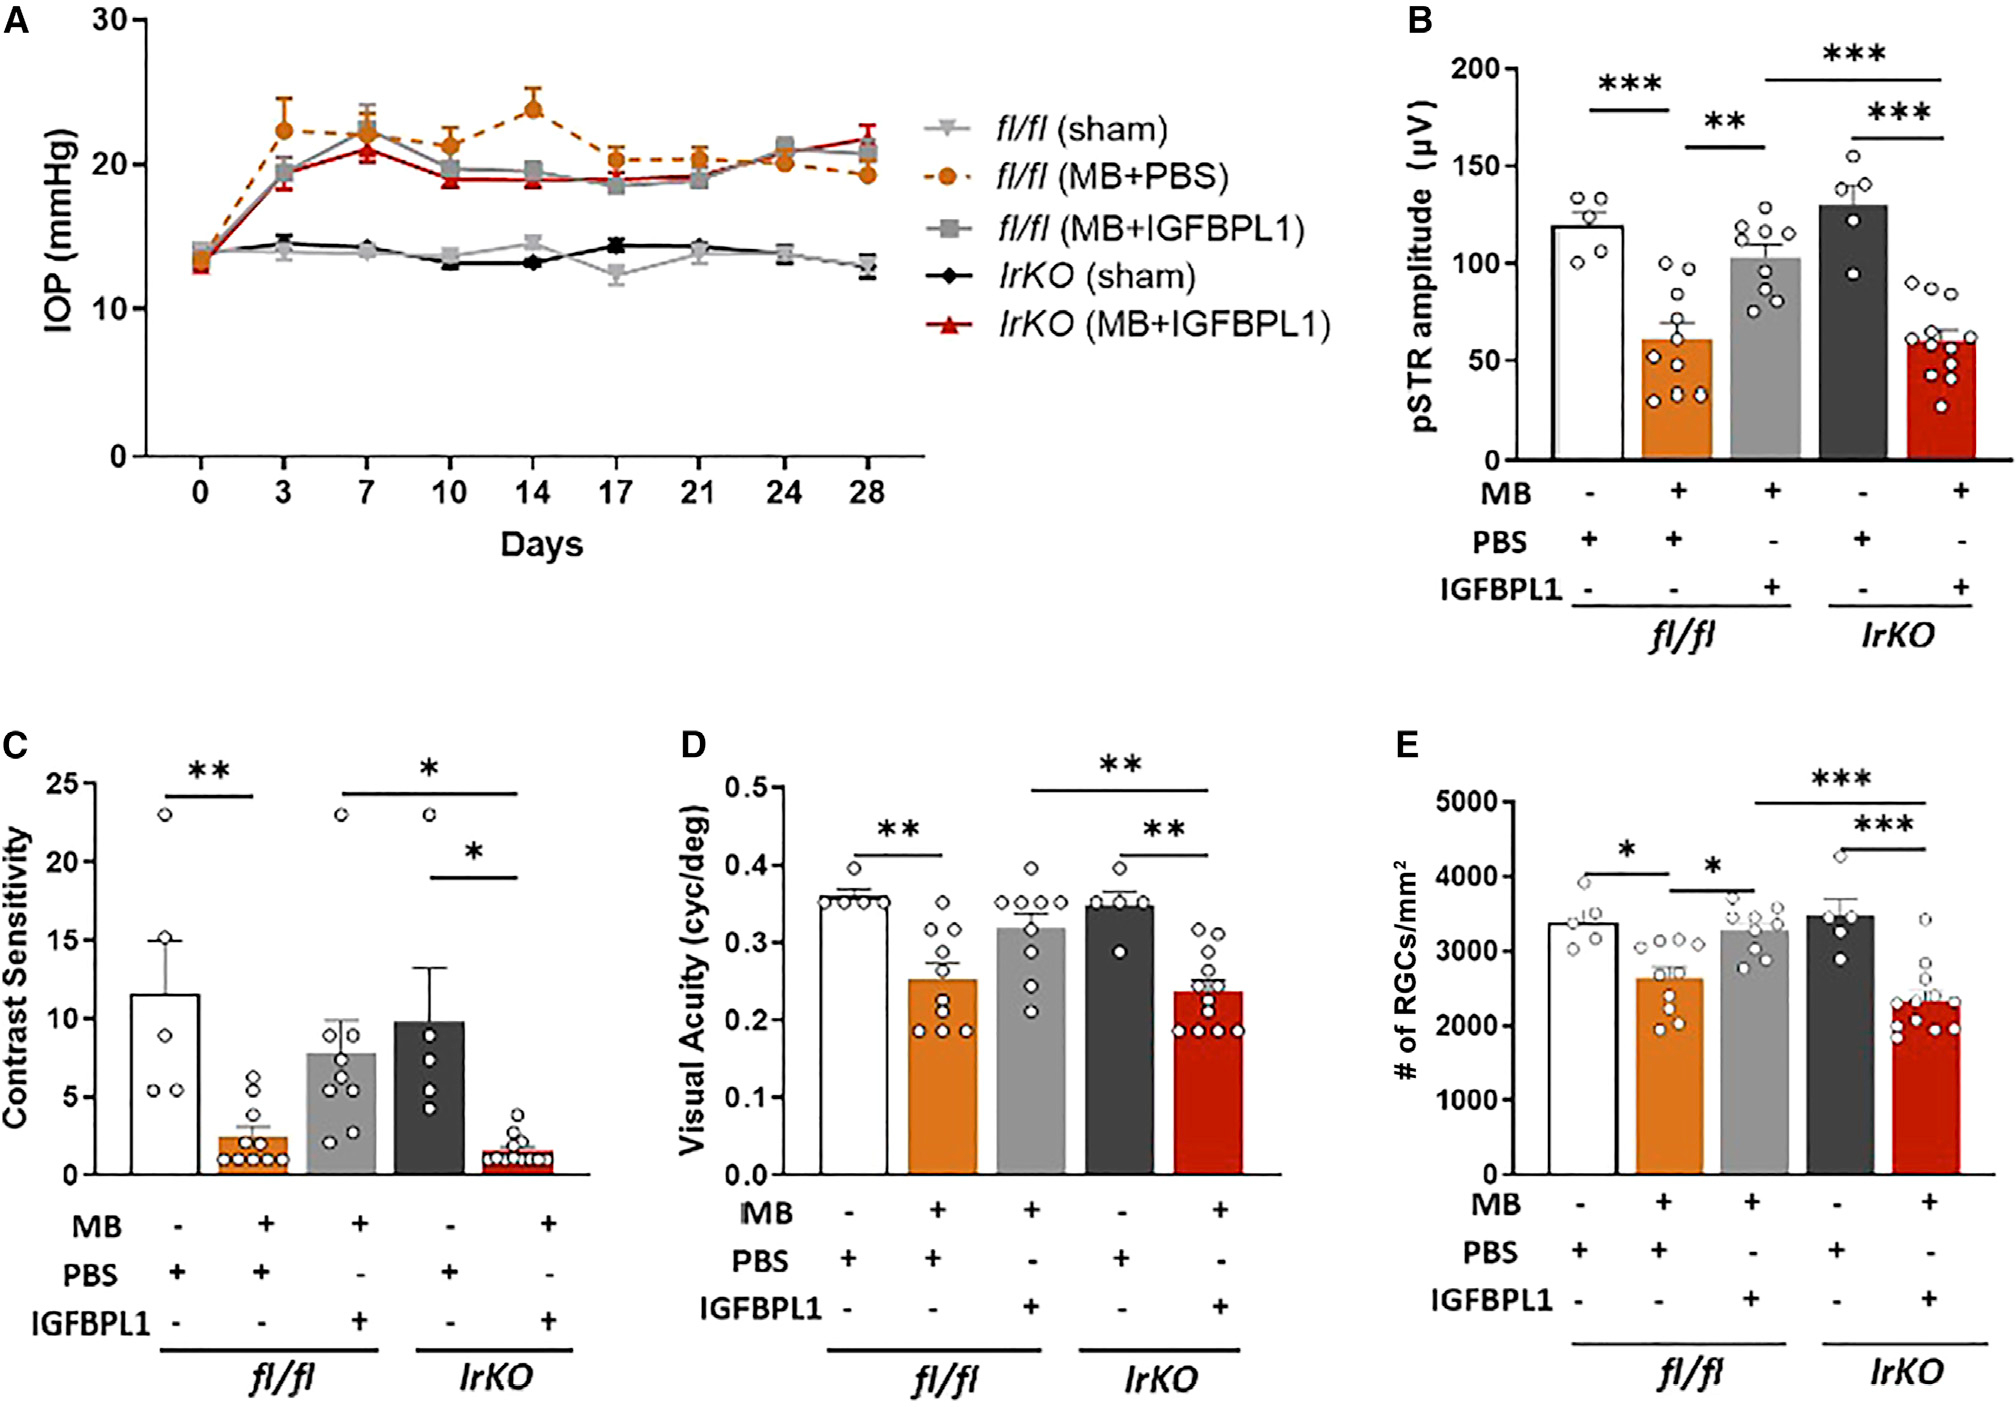
Microglia shift toward an inflammatory phenotype during aging that is thought to exacerbate age-related neurodegeneration. The molecular and cellular signals that resolve neuroinflammation post-injury are largely undefined. Here, we exploit systems genetics methods based on the extended BXD murine reference family and identify IGFBPL1 as an upstream cis-regulator of microglia-specific genes to switch off inflammation. IGFBPL1 is expressed by mouse and human microglia, and higher levels of its expression resolve lipopolysaccharide-induced neuroinflammation by resetting the transcriptome signature back to a homeostatic state via IGF1R signaling. Conversely, IGFBPL1 deficiency or selective deletion of IGF1R in microglia shifts these cells to an inflammatory landscape and induces early manifestation of brain tauopathy and retinal neurodegeneration. Therapeutic administration of IGFBPL1 drives pro-homeostatic microglia and prevents glaucomatous neurodegeneration and vision loss in mice. These results identify IGFBPL1 as a master driver of the counter-inflammatory microglial modulator that presents an endogenous resolution of neuroinflammation to prevent neurodegeneration in eye and brain.

Keywords: Alzheimer’s; CP: Immunology; CP: Neuroscience; IGF1R; IGFBPL1; disease; glaucoma; microglia; neurodegeneration; neuroinflammation; retina; single cell RNA sequencing; tau.


Conflict of interest statement

Declaration of interests D.F.C. is a co-founder and SAB member of FireCyte Therapeutics and a consultant to i-Lumen Scientific and Sichuan PriMed. K.-S.C. is a consultant to FireCyte Therapeutics. D.F.C., K.-S.C., and P.L. are inventors of patents on the neuroprotective roles of IGFBPL1, which have been licensed to FireCyte Therapeutics.

Figures

Figure 1.
Figure 1.. Systems genetics approach identifies IGFBPL1 as an immune and microglial regulator in the mouse retina
(A) Schematic of the reverse genetics approach that predicts the functions of Igfbpl1 based on genome-wide transcriptome profiles of BXD and KO mouse retinas. (B and C) Dot plots of top 7 most significant MPO (B) and enriched KEGG (C) terms and projected based on expression covaried with IGFBPL1 in the BXD mouse retinas. (D) Heatmap of DEGs between KO and WT mouse retinas. (E and F) Dotplots of top 7 most relevant MPO (E) and enriched KEGG (F) terms projected using DEGs of KO mice compared with WT mice. (G) Volcano plot showing DEGs of KO mice compared with WT mice. Red dots: FDR <0.05 and fold change (FC) >1.3. (H) Percentages of DEGs clustered to cell-type-specific genes. (I) Protein-protein interaction network of top 14 microglial associated DEGs visualized in String. See also Figure S1.
Figure 2.
Figure 2.. IGFBPL1 resets the transcriptional signature of inflammatory microglia to a homeostatic state
(A and B) Photomicrographs of mouse (A) and human (B) retinal flat mounts double immunolabeled for IGFBPL1 (red) and IBA-1 (green) and percentage of IGFBPL1-expressing microglia. Arrows indicate IGFBPL1+/IBA-1+ cells. Scale bar, 20 μm. ***p < 0.001; Student’s t test. n = 3–4 mice/group, 3 healthy donors and 1 glaucoma donor. (C) Heatmap of DEGs of cultured retinal microglia treated with control, LPS, IGFBPL1, and LPS+IGFBPL1. (D and E) Volcano plot showing DEGs of microglia treated with LPS (D) or LPS+IGFBPL1 vs. control (E). Red dots represent DEGs with padj <0.05 and |log2[FC]|>1. (F) Heatmap of cytokine levels in microglial cultures treated with control (control), LPS, IGFBPL1, LPS+IGFBPL1, and LPS+IGFBPL1+IGF1Ri assessed by cytokine arrays. (G and H) Images (G) and COX2+ cell counts (H) in microglial cultures treated with control or LPS and PBS, IGFBPL1, or IGFBPL1+IGF1Ri. Cultures were counterstained with DAPI. Scale bar, 20 μm. ***p < 0.001; one-way ANOVA with Dunnett’s multiple comparisons test. n = 3/group. Data are mean ± SEM. (I and J) Quantifications of pNF-κB (I) and pIGF1R (J) in mouse microglial cultures treated with PBS, LPS, IGFBPL1, or LPS+IGFBPL1. *p < 0.05, **p < 0.01; one-way ANOVA with Dunnett’s multiple comparisons test. n = 3/group. (K) Relative mRNA levels of pro-inflammatory cytokines in HSP27-primed microglial cultures treated with or without IGFBPL1. *p < 0.05, **p < 0.01, ***p < 0.001; one-way ANOVA with Dunnett’s multiple comparisons test. n = 6 replicates/group. Data are mean ± SEM. See also Figure S2.
Figure 3.
Figure 3.. IGFBPL1 suppresses retinal microglial activation in mice with glaucoma
(A) IOP profiles in sham-operated (sham) and MB-injected mice injected with PBS or IGFBPL1. n = 10 mice/group. (B) Images of IBA-1+ cells in retinal flat mounts of naive or MB-injected mice that received PBS or IGFBPL1 treatment. Scale bar, 50 μm. (C) Quantification of microglial cell body area and process length in retinal flat mounts of MB-injected mice that received PBS or IGFBPL1 treatment. **p < 0.01; Student’s t test. n = 4 mice/group. (D) Percentage of CD68+ microglia in retinal flat mounts of MB-injected mice that received PBS or IGFBPL1 treatment. **p < 0.01; Student’s t test. n = 3 mice/group. (E and F) Relative mRNA levels of activated microglia markers (E) and pro-inflammatory cytokines (F) in PBS- or IGFBPL1-treated retinas normalized to that of naive mice. *p < 0.05, **p < 0.01, ***p < 0.001; Student’s t test. n = 5 mice/group. (G and H) Western blot image (G) and quantification (H) of GFAP levels in retinal flat mounts of PBS- or IGFBPL1-treated mice after MB injection. GFAP expression was normalized to the corresponding β-actin intensity and presented relative to that of naive mouse retinas. **p < 0.01; two-way ANOVA with Šídák multiple comparisons test. n = 4 mice/group. Data are mean ± SEM. See also Figure S2.
Figure 4.
Figure 4.. IGFBPL1 is required for sustaining microglial homeostasis in healthy and glaucomatous retinas
(A) Quantifications of microglial cell body area and process length and percentages of CD68+ microglia in retinal flat mounts of WT and KO mice. *p < 0.05, **p < 0.01, ***p < 0.001; Student’s t test. n = 4 mice/group. (B and C) Relative mRNA levels of activated microglia markers (B) and pro-inflammatory cytokines (C) 7-month-old KO retinas normalized to those of WT mice. *p < 0.05, ***p < 0.001; Student’s t test. n = 4 mice/group. (D) tSNE map of microglial pools of 7-month-old mouse retinas. A total of 4 clusters of microglia were identified. n = 10 mice. (E) tSNE plots showing distributions of pan-microglial (Cx3cr1, Tmem119), C1 (Apoe, Igf1), C2 (Cxcl10), and C3 (Ki67) markers. (F) Dot plot of microglial signature genes identified in C0–C3. (G) Bar plot representing the relative distribution of C0–C3 microglial subsets in WT, KO, and MB-induced glaucomatous WT mice that received PBS or IGFBPL1 treatment. The abundance was normalized to that of the naive WT mice. (H) RNA velocity ForceAtlas2-based embeddings showing microglial cell-fate directions in all clusters (top panel) or in inflammatory C1 subset (bottom panel) in WT, KO, MB+PBS, and MB+IGFBPL1 retinas. Black arrows indicate the local differentiation direction from individual progenitor to progeny cell. The large red and green arrowheads indicate summed directions of cell-fate transition in C1 subset. Colors of subclusters are in correspondence to those in (D). Data are mean ± SEM. See also Figure S3.
Figure 5.
Figure 5.. IGFBPL1 signaling in microglia is required for neuronal homeostasis in the retina and brain
(A and B) Image (A) and counts (B) of Brn3a+ cells in retinal flat mounts of WT and KO mice. Scale bar, 30 μm. *p < 0.05, **p < 0.01, ***p < 0.001; two-way ANOVA with Šídák multiple comparisons test. n = 4 mice/group. (C) RGC counts in fl/fl and IrKO littermates without or at 3 months after tamoxifen injection. **p < 0.01, ***p < 0.001; one-way ANOVA with Tukey’s multiple comparisons test. n > 4 mice/group. (D) Images of IBA-1+ cells in the hippocampus of WT and KO mice. Scale bar, 20 μm. n = 4 mice/group. (E and F) Quantification of microglial cell body area (E) and process length (F) in the hippocampus of WT and KO mice. *p < 0.05, ***p < 0.001; two-way ANOVA with Šídák multiple comparisons test. n = 4 mice/group. (G and H) Images (G) and fluorescence intensity (H) of pTau S202/T205 immunolabeling in hippocampal dentate gyrus of WT and KO mice. Scale bar, 50 μm. (I–M) Western blot images (I) and quantification (J–M) of pTau and total tau in the hippocampus of WT and KO mice. The relative abundance of pTau was normalized to total Tau. *p < 0.05, ***p < 0.001; two-way ANOVA with Šídák multiple comparisons test. n = 3–4 mice/group. (N) Densitometry analysis of β-amyloid levels in the CA1 region and dentate gyrus of WT and KO mice. *p < 0.05, Student’s t test. n = 3 mice/group. (O) Manhattan plot showing a genome-wide significant eQTL. The x axis denotes the chromosomal position in megabases on the mouse genome, and the y axis indicates the LRS score. The pink and gray horizontal lines indicate significant and suggestive LRSs, respectively. The purple triangle indicates the genomic position of Igfbpl1. LRS is shown by blue line, and additive effects are shown by green line. (P) Scatterplots of the correlations between Igfbpl1 and Trem2 expression in BXD mouse eyes. Pearson correlation r and p values are indicated. Gene expression values are log2 transformed. (Q) Bayesian network structure connecting SNP at peak of Igfbpl1 eQTL (rs228463156), Igfbpl1 and Trem2 correlated genes, and glaucoma (15972: IOP) and AD (20903: y-maze performance) phenotypes. Bayesian network structure was recreated using BioRender.com design tools and assets. Data are mean ± SEM. See also Figures 4, 5, and 6.
Figure 6.
Figure 6.. IGFBPL1 rescues RGCs and visual function in glaucomatous mice
(A) Illustration of electroretinogram (ERG), optomotor response (OMR), and morphological assessments in MB-injected C57BL/6J or DBA/2J mice. (B) IOP profiles of shamor MB-injected mice that received PBS or IGFBPL1 treatments. n = 10 mice/group. (C–E) pSTR amplitudes (C) and values of CS (D) and VA (E) in MB-injected mice that received PBS or IGFBPL1 treatment. ***p < 0.001; two-way ANOVA with Šídák multiple comparisons test. n = 10 mice/group. (F and G) Images (F) and counts (G) of BRN3a+ cells in retinal flat mounts of naive and sham- and MB-induced mice that received PBS or IGFBPL treatment. Scale bar, 50 μm. n = 7 mice/group. (H) Representative pSTR waveforms in untreated 6- (control [Ctrl]) and 10-month-old DBA/2J mice that received monthly injections of PBS or IGFBPL1. (I) pSTR amplitudes in DBA/2J mice. Mice that received a monthly injection of PBS or IGFBPL1 at 7–9 months old were sacrificed at 10 months old. *p < 0.05, ***p < 0.001; two-way ANOVA with Šídák multiple comparisons test. n = 8 mice/group. (J) RGC counts in untreated 6- (Ctrl) and 10-month-old DBA/2J mice that received monthly treatments of PBS or IGFBPL1 at 7–9 months of age. **p < 0.01, ***p < 0.001; one-way ANOVA with Tukey’s multiple comparisons test. n = 8 mice/group. (K) Image (K) of PSD95 (red) and synaptophysin (Syn; green) immunolabeling in retinas of 15-month-old WT mice that received PBS or IGFBPL1 injections. Scale bar, 15 μm. (L and M) Quantification of PSD95 immunofluorescence intensity (L) and quantitative real-time PCR of p21 (M) in PBS- and IGFBPL1-treated groups. n = 3–6 mice/ group. *p < 0.05; Student’s t test. Data are mean ± SEM. See also Figure S7.
Figure 7.
Figure 7.. Microglial-specific deletion of Igf1r abolishes the neuroprotective effect of IGFBPL1 in glaucomatous mice
(A) IOP profiles of tamoxifen-treated fl/fl and IrKO mice that received PBS or IGFBPL1 treatments. (B–E) pSTR amplitudes (B), CS (C), VA (E), and RGC counts in retinal flat mounts of sham- or MB-injected fl/fl and IrKO mice that received PBS or IGFBPL1 treatments. *p < 0.05, **p < 0.01, ***p < 0.001; one-way ANOVA with Tukey’s multiple comparisons test (n > 5 mice/group). Data are mean ± SEM. See also Figure S7.

References

    1. Butovsky O, and Weiner HL (2018). Microglial signatures and their role in health and disease. Nat. Rev. Neurosci. 19, 622–635. 10.1038/s41583-018-0057-5. - DOI - PMC - PubMed
    1. Hammond TR, Marsh SE, and Stevens B (2019). Immune Signaling in Neurodegeneration. Immunity 50, 955–974. 10.1016/j.immuni.2019.03.016. - DOI - PMC - PubMed
    1. Wang SK, Xue Y, and Cepko CL (2020). Microglia modulation by TGF-beta1 protects cones in mouse models of retinal degeneration. J. Clin. Invest. 130, 4360–4369. 10.1172/JCI136160. - DOI - PMC - PubMed
    1. Silverman SM, Ma W, Wang X, Zhao L, and Wong WT (2019). C3- and CR3-dependent microglial clearance protects photoreceptors in retinitis pigmentosa. J. Exp. Med. 216, 1925–1943. 10.1084/jem.20190009. - DOI - PMC - PubMed
    1. O’Koren EG, Yu C, Klingeborn M, Wong AYW, Prigge CL, Mathew R, Kalnitsky J, Msallam RA, Silvin A, Kay JN, et al. (2019). Microglial Function Is Distinct in Different Anatomical Locations during Retinal Homeostasis and Degeneration. Immunity 50, 723–737.e7. 10.1016/j.immuni.2019.02.007. - DOI - PMC - PubMed

Publication types

Substances

LinkOut - more resources